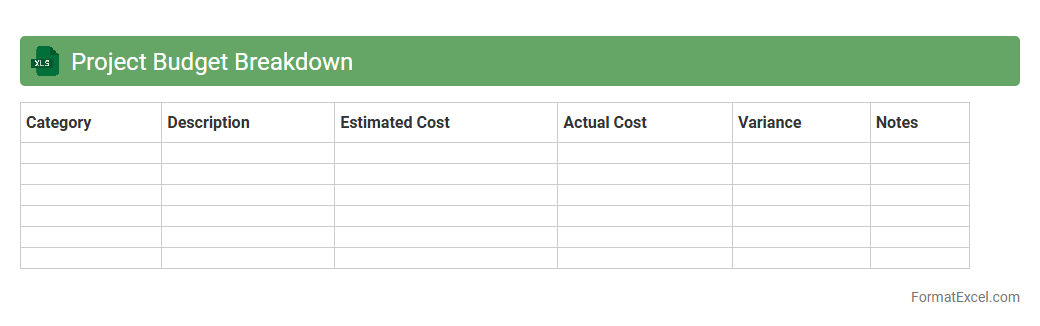
Project Budget Breakdown
A
Project Budget Breakdown Excel document is a detailed spreadsheet used to allocate and monitor financial resources across various components of a project. It helps in tracking expenses, forecasting costs, and ensuring that the project stays within financial limits by providing clear visibility into spending patterns. This tool is essential for project managers to maintain budget control, identify potential overruns early, and make informed decisions.
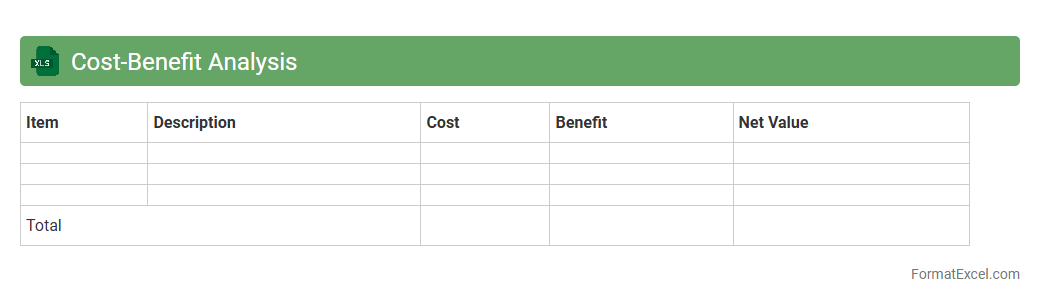
Cost-Benefit Analysis
A
Cost-Benefit Analysis Excel document is a structured spreadsheet tool designed to evaluate the financial feasibility of projects by comparing expected costs against potential benefits. It helps users quantify and visualize data, making it easier to identify whether the anticipated returns justify the investments. This tool enhances decision-making by providing clear insights into economic impacts, risk assessment, and resource allocation efficiency.
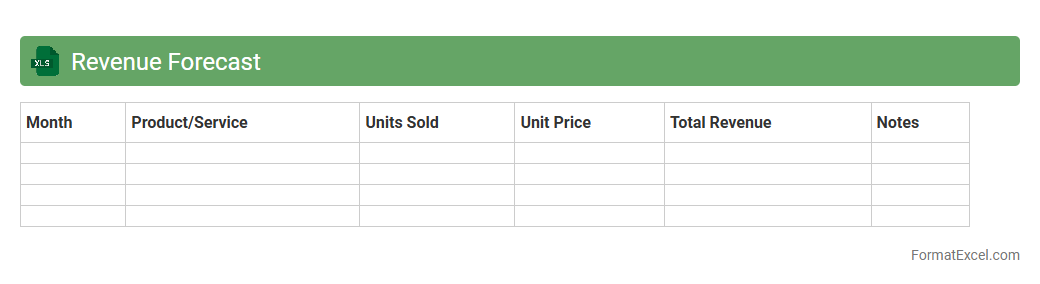
Revenue Forecast
A
Revenue Forecast Excel document is a financial tool that projects future sales and income based on historical data and market trends. It helps businesses plan budgets, allocate resources, and set realistic financial goals by providing detailed insights into expected revenue streams. Using this document enhances decision-making accuracy and supports strategic growth initiatives.
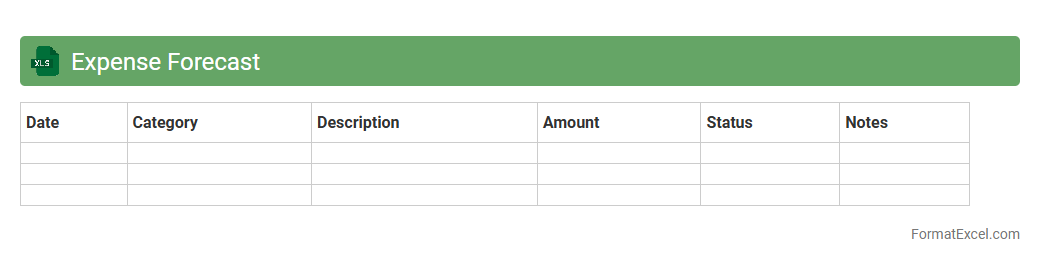
Expense Forecast
An
Expense Forecast Excel document is a spreadsheet tool designed to project and track future expenses based on historical spending data and planned budgets. It helps individuals and businesses manage cash flow effectively by anticipating costs and identifying areas for cost control. Utilizing this document enables better financial planning, ensuring resources are allocated efficiently and financial goals are met.
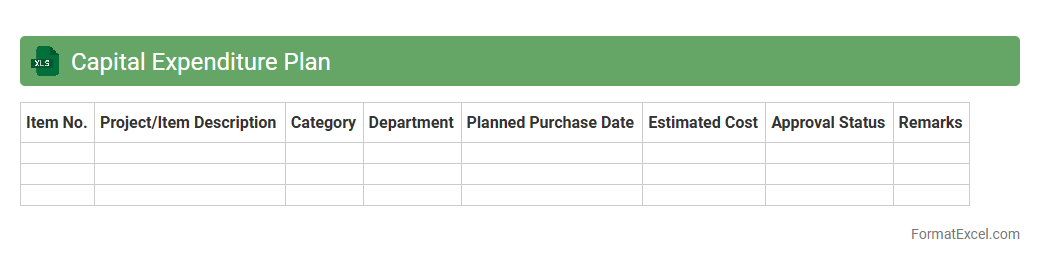
Capital Expenditure Plan
A
Capital Expenditure Plan Excel document is a detailed financial tool designed to forecast and track long-term investment costs in assets such as equipment, infrastructure, or technology. It enables organizations to allocate resources efficiently, monitor spending against budgets, and prioritize projects based on return on investment. Using this document improves strategic decision-making by providing clear visibility into future capital needs and financial commitments.
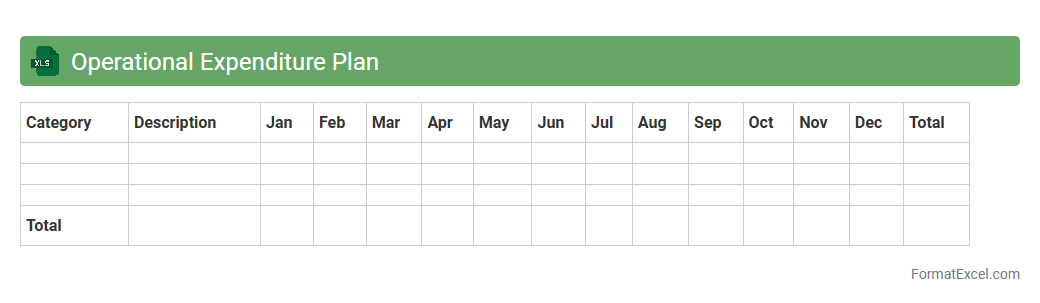
Operational Expenditure Plan
An
Operational Expenditure Plan Excel document is a detailed financial tool used to outline and track the ongoing costs essential for daily business operations, such as salaries, utilities, and maintenance expenses. It provides a clear overview of budget allocation, helping organizations manage cash flow effectively and avoid overspending. By organizing expenditures systematically, this plan enhances financial planning accuracy and supports informed decision-making.
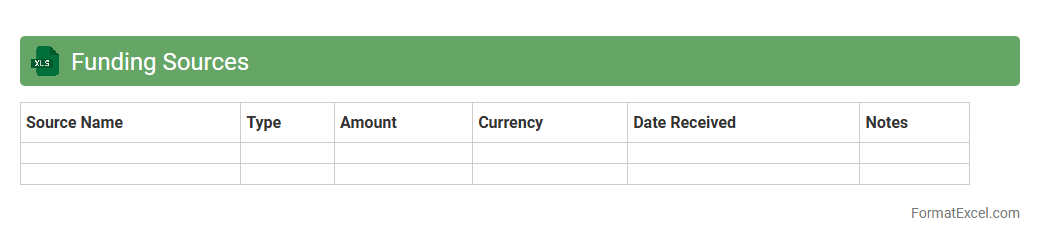
Funding Sources
A
Funding Sources Excel document is a structured spreadsheet listing various financial resources, grants, investors, and funding opportunities relevant to projects or organizations. It helps systematically organize contact details, application deadlines, eligibility criteria, and funding amounts, enabling efficient tracking and management of potential revenue streams. This tool supports informed decision-making by providing quick access to critical financial information, optimizing the pursuit of capital for growth or project completion.
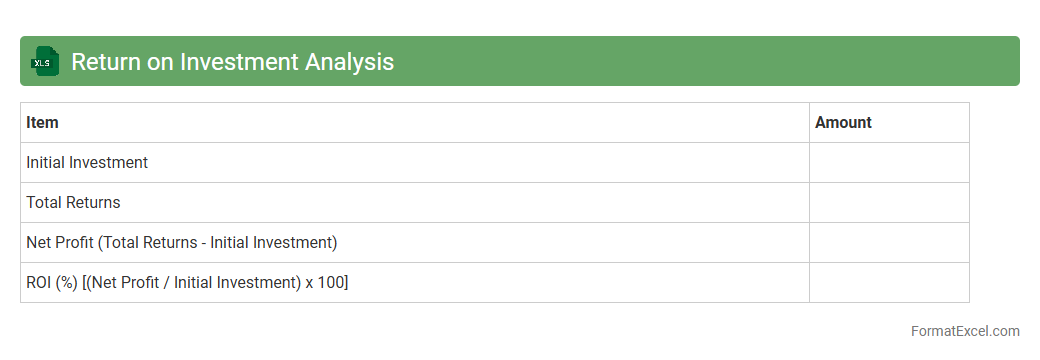
Return on Investment Analysis
Return on Investment Analysis Excel document is a powerful tool designed to calculate and evaluate the profitability of investments by comparing the returns relative to the costs incurred. It helps businesses and individuals make informed financial decisions by providing clear visualizations and detailed metrics on investment performance. Using
ROI analysis in Excel streamlines data organization, enhances accuracy, and allows for customizable scenarios to optimize financial outcomes.
Cash Flow Projection
A
Cash Flow Projection Excel document is a financial tool that forecasts the inflows and outflows of cash over a specific period, helping businesses manage liquidity effectively. It provides a clear overview of expected revenues, expenses, and net cash position, enabling informed decision-making and strategic planning. This tool is essential for anticipating cash shortages, optimizing budget allocation, and ensuring timely payments to avoid financial disruptions.
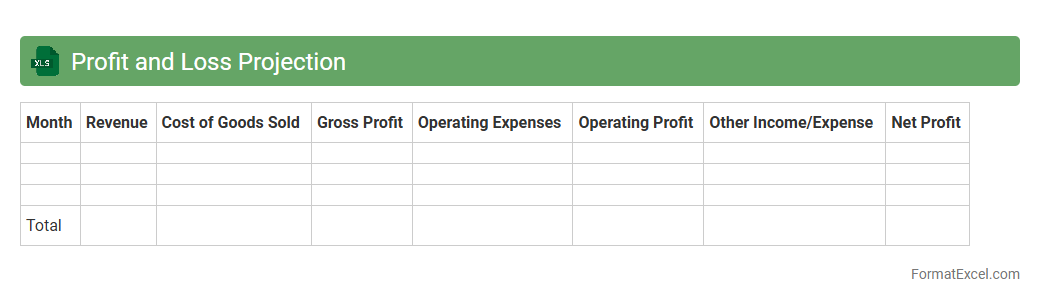
Profit and Loss Projection
A
Profit and Loss Projection Excel document is a financial tool that estimates future revenues, costs, and expenses over a specific period. It helps businesses analyze potential profitability, make informed budgeting decisions, and identify financial trends early. By providing a clear visualization of expected financial performance, it supports strategic planning and risk management efforts.
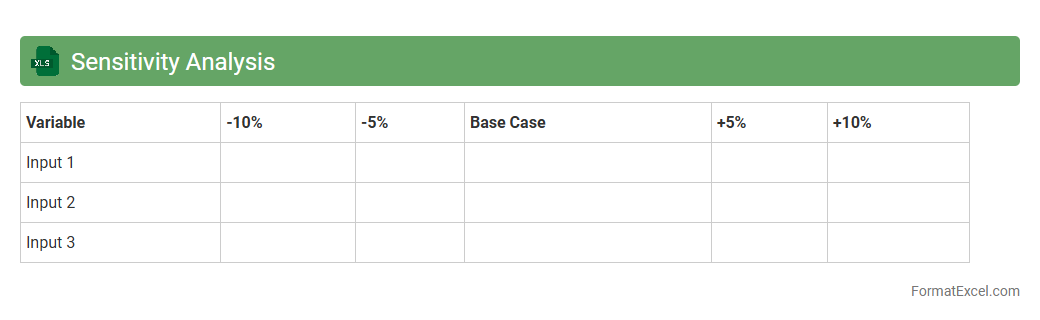
Sensitivity Analysis
Sensitivity Analysis in an
Excel document is a tool that evaluates how changes in input variables impact the output of a financial or business model. It enables users to identify critical factors affecting outcomes, improving decision-making by assessing potential risks and uncertainties. This analysis enhances strategic planning, budgeting, and forecasting by providing clear insights into variable dependencies.
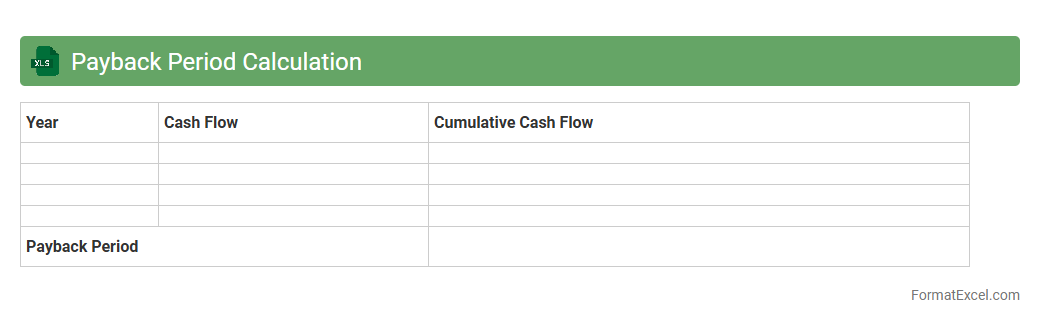
Payback Period Calculation
The
Payback Period Calculation Excel document is a financial tool designed to determine the time required for an investment to generate enough cash flow to recover its initial cost. By inputting the initial investment amount and expected annual cash inflows, users can quickly identify when their project or investment will break even. This calculation aids decision-making by providing a clear timeline for risk assessment and cash flow management, making it essential for budgeting and investment analysis.
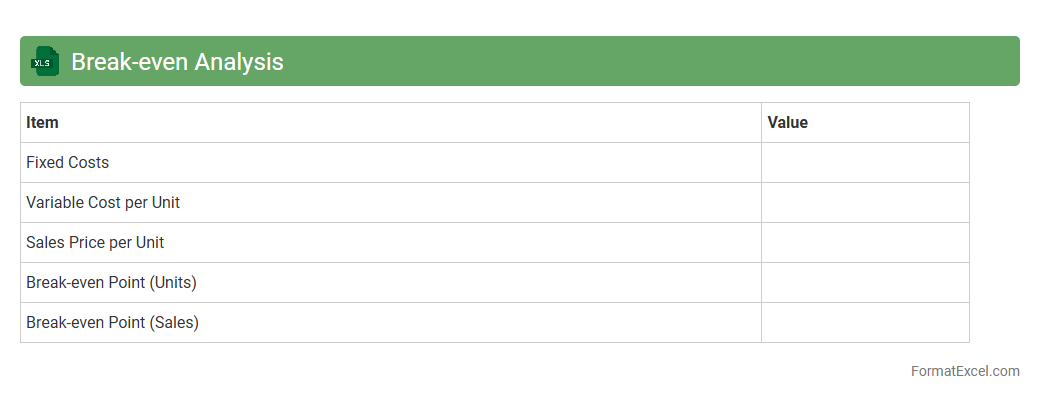
Break-Even Analysis
A
Break-Even Analysis Excel document is a financial tool that calculates the point at which total revenues equal total costs, indicating no net loss or gain. It helps businesses determine the minimum sales volume needed to cover fixed and variable expenses, facilitating accurate financial planning and decision-making. Using this Excel sheet allows users to visualize profit margins and assess the impact of cost changes on profitability efficiently.
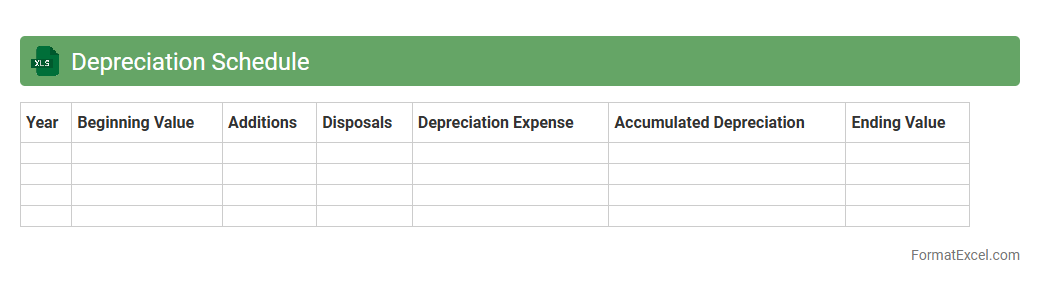
Depreciation Schedule
A
Depreciation Schedule Excel document systematically tracks the reduction in value of assets over time using methods like straight-line or declining balance. It helps businesses accurately calculate tax deductions, plan capital expenditures, and maintain proper financial records. This schedule improves asset management by providing clear depreciation timelines and cost allocations.
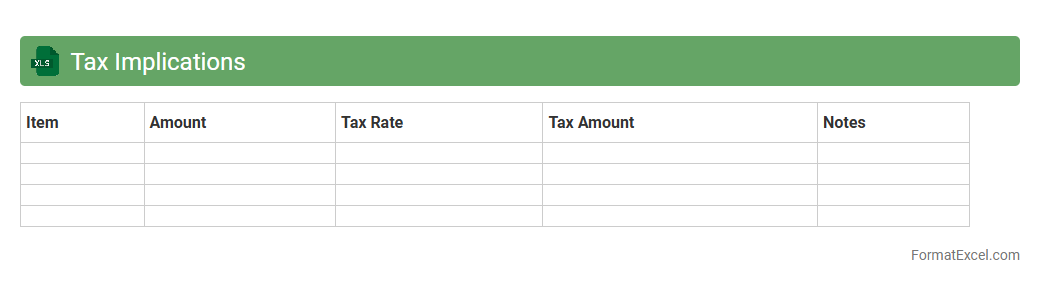
Tax Implications
The
Tax Implications Excel document is a specialized spreadsheet designed to analyze and calculate potential tax liabilities based on various financial scenarios. It helps users forecast tax outcomes, optimize financial decisions, and ensure compliance with tax regulations by providing detailed, customizable calculations. This tool is essential for individuals and businesses aiming to manage tax obligations efficiently and make informed planning strategies.
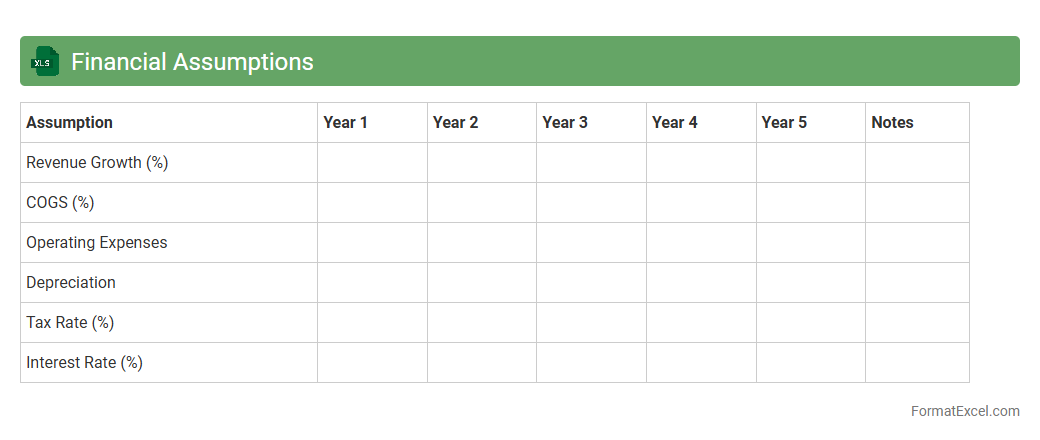
Financial Assumptions
A
Financial Assumptions Excel document is a structured spreadsheet that outlines key financial variables such as revenue growth rates, expense ratios, discount rates, and capital expenditures used in budgeting, forecasting, and financial modeling. It serves as a foundational tool for business planning by enabling users to input, adjust, and analyze critical assumptions that drive financial projections and decision-making. This document enhances accuracy in scenario analysis, supports investor presentations, and facilitates strategic planning by providing a clear, organized framework for financial hypothesis testing.
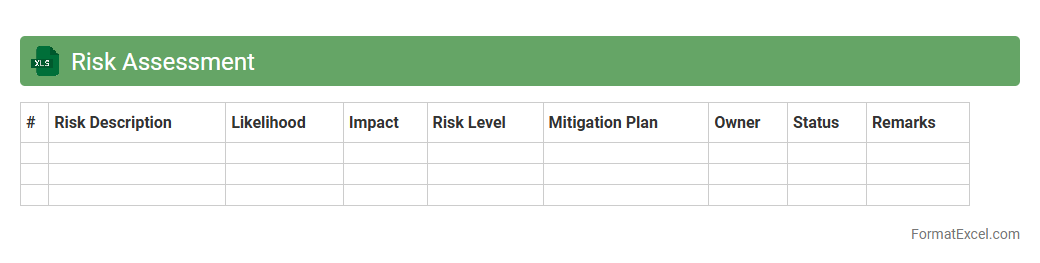
Risk Assessment
A
Risk Assessment Excel document is a structured tool designed to identify, analyze, and prioritize potential risks within a project or business operation. It allows users to systematically evaluate risk probability, impact, and mitigation strategies, helping organizations make informed decisions and implement effective risk management plans. This document enhances clarity, supports compliance, and improves resource allocation by providing a comprehensive overview of risks in an easily accessible and customizable spreadsheet format.
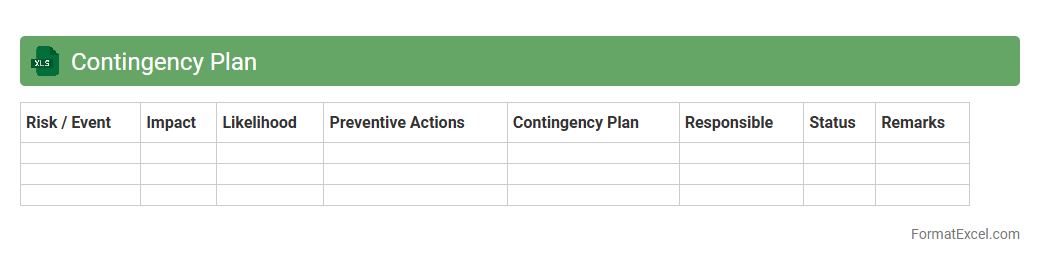
Contingency Plan
A
Contingency Plan Excel document is a structured spreadsheet designed to outline predefined actions and resources needed to respond to unexpected events or emergencies. It helps organizations systematically identify risks, assign responsibilities, and track mitigation strategies, ensuring preparedness and minimizing downtime. Using this document promotes efficient decision-making and enhances operational resilience during crises.
Loan Repayment Schedule
A
Loan Repayment Schedule Excel document is a structured spreadsheet that outlines the timeline for paying back a loan, including principal amounts, interest rates, payment dates, and outstanding balances. It helps borrowers and lenders track payment progress, manage finances effectively, and avoid missed or late payments by providing clear, organized data. This tool is essential for budgeting, forecasting cash flows, and ensuring transparency in loan management.
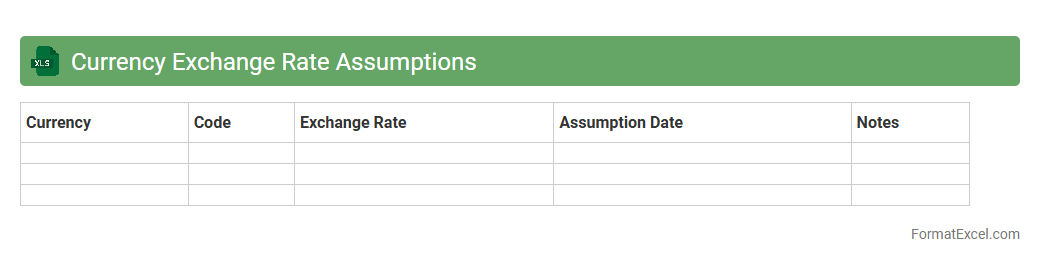
Currency Exchange Rate Assumptions
The
Currency Exchange Rate Assumptions Excel document serves as a dynamic tool to forecast and analyze foreign exchange rates for financial modeling and budgeting processes. By incorporating historical data and predictive algorithms, it enables accurate currency risk assessment and informed decision-making in international transactions. This document is essential for multinational corporations, investors, and analysts to mitigate exposure to currency fluctuations and optimize financial planning.
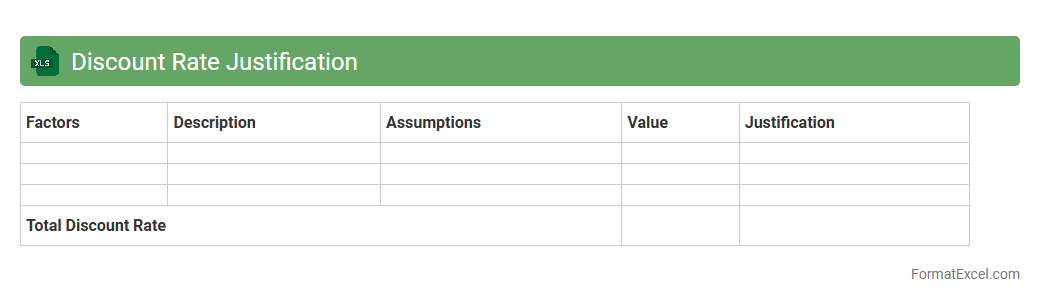
Discount Rate Justification
A
Discount Rate Justification Excel document is a tool used to calculate and validate the appropriate discount rate for financial modeling and valuation purposes. It compiles data such as risk-free rates, market risk premiums, and company-specific risk factors to establish a transparent and defendable rate that reflects the time value of money and the risk profile of the investment. This document is essential for ensuring accuracy in net present value (NPV) calculations, investment appraisals, and making informed business decisions.
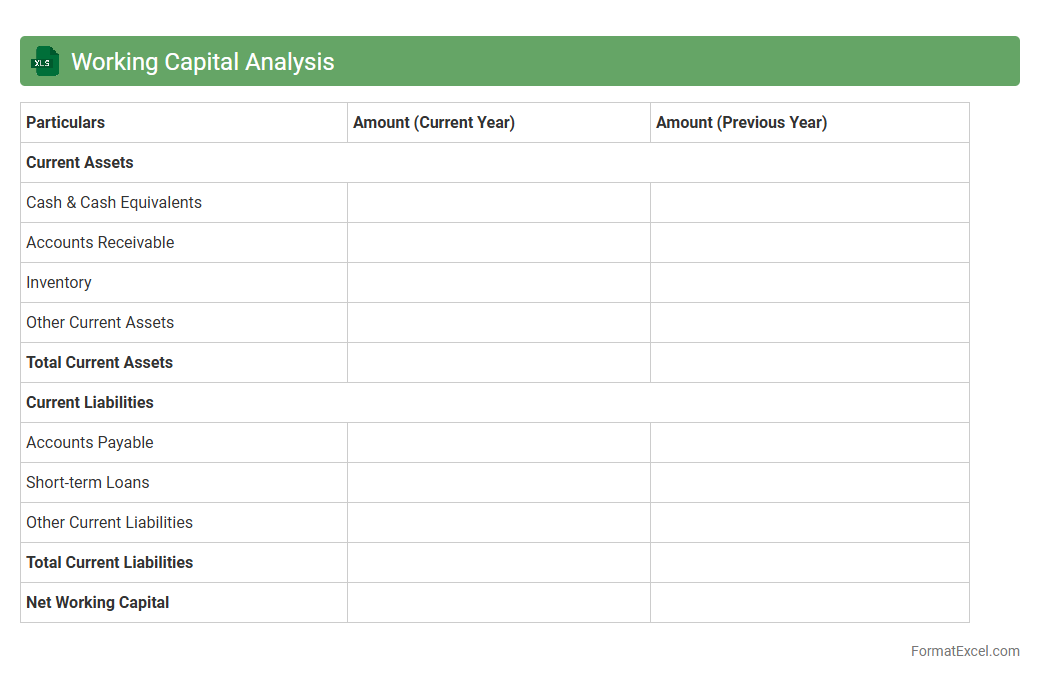
Working Capital Analysis
Working Capital Analysis excel document is a powerful financial tool designed to evaluate a company's short-term liquidity by analyzing current assets and current liabilities. It helps businesses monitor their operational efficiency, ensuring they have sufficient
working capital to meet day-to-day expenses and avoid cash flow problems. By providing clear insights into the company's financial health, this document supports informed decision-making and strategic planning.
Inflation Impact Assessment
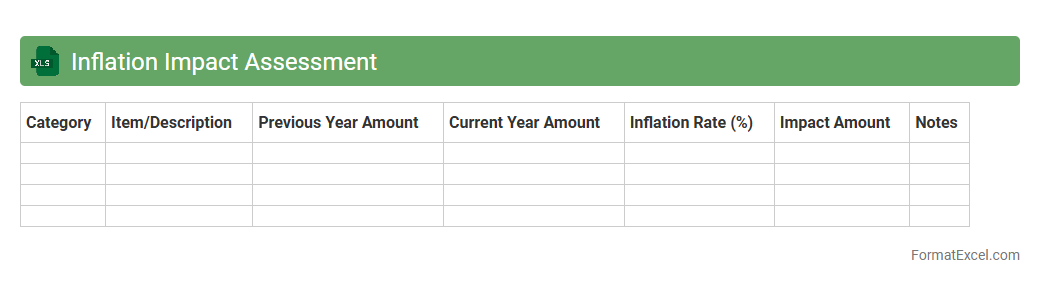
The
Inflation Impact Assessment Excel document is a tool designed to analyze and quantify the effects of inflation on various financial metrics and budgets. It helps users forecast cost increases, adjust pricing strategies, and evaluate changes in purchasing power over time. By providing structured data and scenario analysis, this document supports informed decision-making and enhances financial planning accuracy.
Milestone-Based Payment Schedule
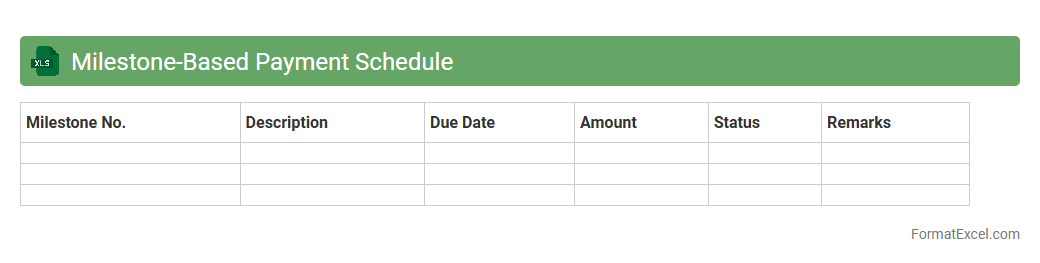
A
Milestone-Based Payment Schedule Excel document is a structured financial tool designed to track payments aligned with project milestones, ensuring organized and timely disbursements. It allows project managers and finance teams to monitor cash flow, manage budgets effectively, and maintain transparency between clients and contractors. This document enhances accountability by clearly defining payment triggers tied to deliverable completion, reducing the risk of disputes and improving overall project management efficiency.
Summary of Key Financial Indicators
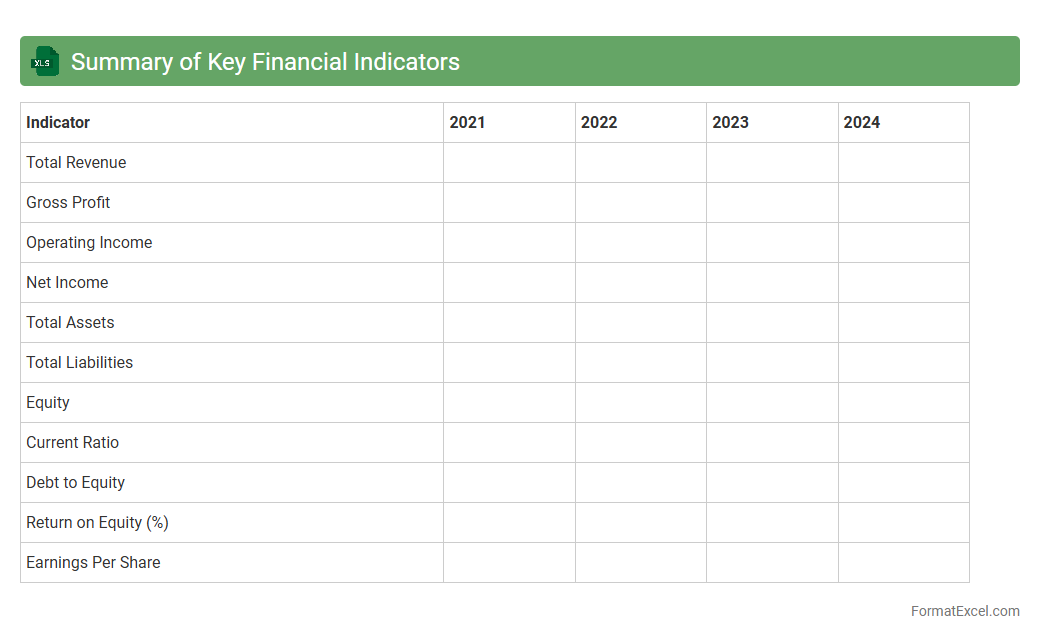
The
Summary of Key Financial Indicators Excel document consolidates essential financial metrics such as revenue, profit margins, liquidity ratios, and return on investment into a clear, organized format. This tool enables businesses and analysts to quickly assess financial health, track performance trends, and make informed decisions based on quantitative data. By providing a snapshot of critical indicators, it supports effective financial planning, budgeting, and performance evaluation.
Introduction to Financial Proposal Formats
A financial proposal format organizes key financial data for projects or services. It ensures clarity and professionalism when presenting cost estimates. Excel is widely used for its flexibility and calculation tools.
Importance of a Structured Financial Proposal
A well-structured proposal improves decision-making by providing clear, concise financial details. It builds trust between clients and vendors by showcasing transparency. Structured formats also reduce errors and enhance communication.
Key Components of a Financial Proposal in Excel
Essential elements include a summary, cost breakdown, and payment terms. Excel enables efficient calculation and easy adjustments of these components. Including visuals like charts can improve understanding.
Setting Up the Excel Financial Proposal Template
Begin by defining headers for sections such as costs, quantities, and totals. Use formulas to automate calculations and minimize manual input errors. Applying consistent formatting improves readability.
Recommended Sections for Financial Proposals
Include sections like project overview, detailed budget, assumptions, and terms & conditions. A dedicated section for contingencies helps address unforeseen expenses. Clear labeling facilitates quick navigation.
Step-by-Step Guide to Formatting in Excel
Start with organizing rows and columns logically. Use cell borders, colors, and fonts to differentiate sections. Leveraging Excel formulas ensures dynamic updates and accuracy.
Best Practices for Accuracy in Financial Proposals
Double-check formulas and cross-verify data entries for consistency. Implement validation rules to prevent incorrect inputs. Regularly update the proposal to reflect the latest pricing and scope changes.
Customizing Excel Templates for Different Industries
Adapt templates by including industry-specific cost elements and terminologies. For example, construction proposals might focus on labor and material costs. Tailoring the template ensures relevance and professionalism.
Common Mistakes to Avoid in Financial Proposals
Avoid vague cost descriptions and omitting important contingencies. Failing to use consistent formats can confuse readers and reduce credibility. Always review proposals before submission to catch errors.
Downloadable Financial Proposal Excel Templates
Many websites offer free and customizable Excel templates for financial proposals. Utilize these resources to save time and maintain professional standards. Ensure templates are compatible with your project requirements.