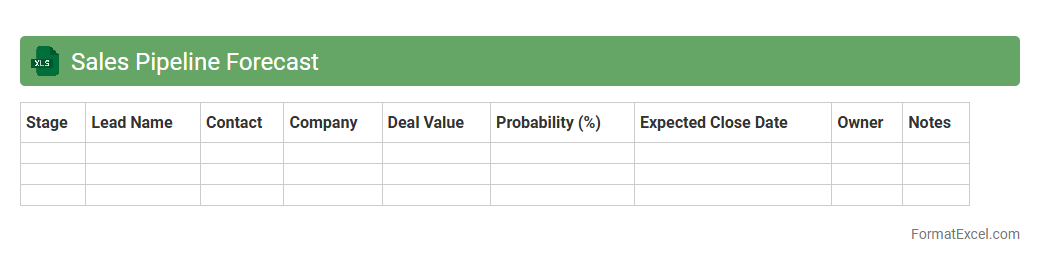
Sales Pipeline Forecast
A
Sales Pipeline Forecast Excel document is a tool that tracks and predicts future sales revenue by organizing potential deals according to their stage in the sales process. It allows sales teams to visualize the progress of leads, estimate closing dates, and prioritize efforts based on deal value and probability. This document improves accuracy in revenue projections, resource allocation, and strategic planning by providing a clear snapshot of upcoming sales opportunities.
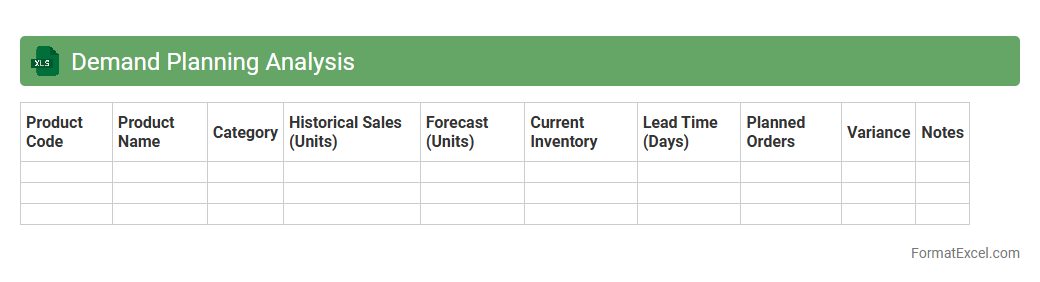
Demand Planning Analysis
Demand Planning Analysis Excel document is a powerful tool designed to forecast and manage product demand by analyzing historical sales data, market trends, and inventory levels. It enables businesses to optimize inventory, reduce stockouts, and improve customer satisfaction through accurate
demand forecasting. Utilizing this analysis supports efficient resource allocation and informed decision-making, leading to increased operational efficiency and profitability.
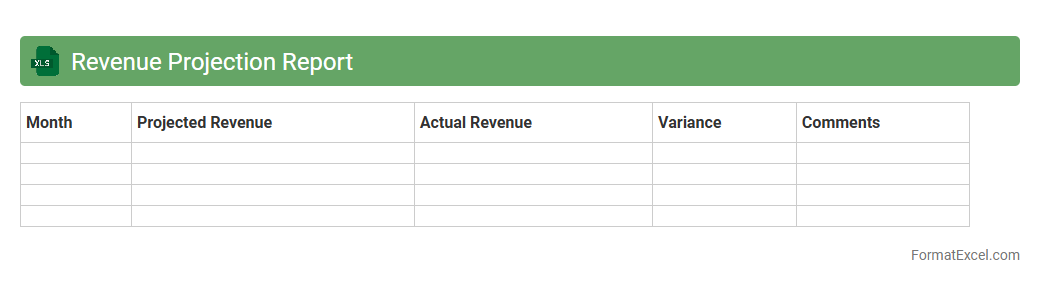
Revenue Projection Report
A
Revenue Projection Report Excel document estimates future income by analyzing historical sales data, market trends, and business growth patterns. It enables companies to forecast cash flows, set realistic sales targets, and manage budgets effectively. This tool is essential for financial planning, investor presentations, and strategic decision-making.
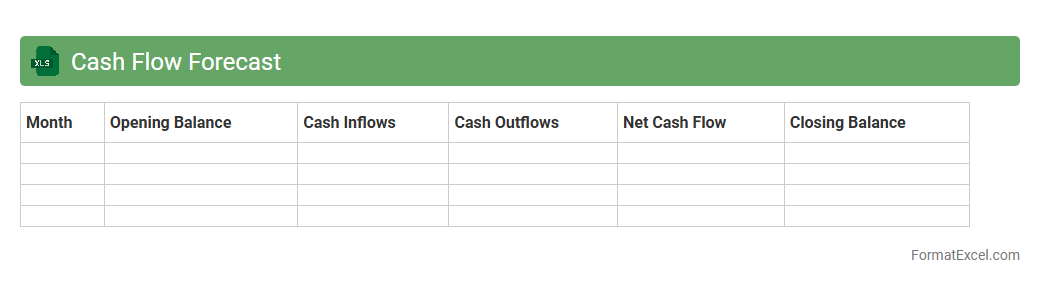
Cash Flow Forecast
A
Cash Flow Forecast Excel document is a financial tool that projects future cash inflows and outflows over a specific period, helping businesses anticipate liquidity needs. It allows users to monitor expected revenue, expenses, and net cash positions to make informed decisions and avoid cash shortages. By providing clear visibility into cash availability, this forecast supports effective budgeting, investment planning, and operational management.
Headcount Forecast
A
Headcount Forecast Excel document is a strategic tool used to project future staffing needs based on business growth, turnover rates, and budget constraints. It enables organizations to plan workforce allocation, allocate resources efficiently, and align hiring strategies with company goals. By analyzing trends and predicting headcount requirements, this document supports informed decision-making and enhances operational agility.
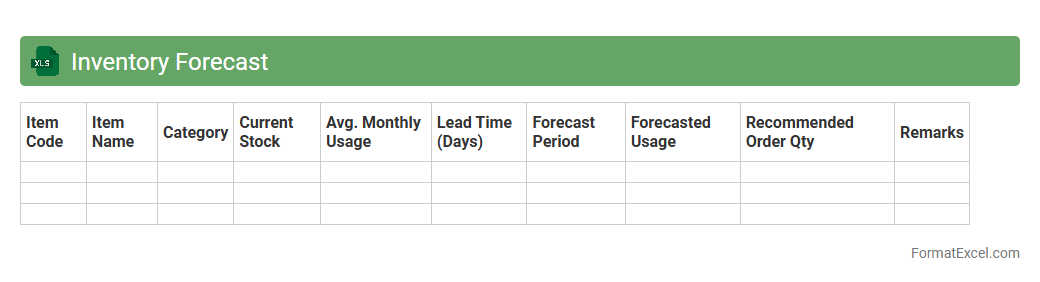
Inventory Forecast
The
Inventory Forecast Excel document is a powerful tool designed to predict future inventory needs based on historical sales data, seasonal trends, and market demand. It helps businesses optimize stock levels, reduce carrying costs, and avoid stockouts or overstock situations. Utilizing accurate inventory forecasts enhances supply chain efficiency and supports strategic decision-making for procurement and sales planning.
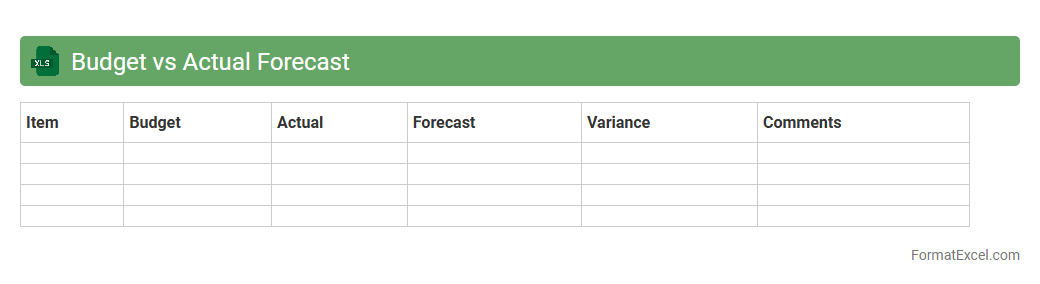
Budget vs Actual Forecast
A
Budget vs Actual Forecast Excel document is a financial tool that compares planned budget figures against real-time actual expenses and revenues, allowing for precise tracking of financial performance. This comparison helps identify variances, enabling organizations to make informed decisions for adjusting forecasts, controlling costs, and optimizing resource allocation. By providing a clear, dynamic overview of financial health, this document supports strategic planning and enhances accountability in budgeting processes.
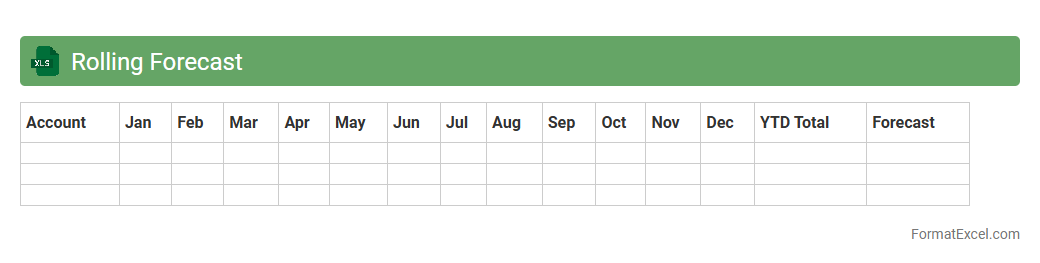
Rolling Forecast
A
Rolling Forecast Excel document is a dynamic financial planning tool that continuously updates projections by adding new periods as current periods pass, enabling ongoing visibility into future performance. It helps businesses adapt to changing market conditions by providing real-time insights for budgeting, cash flow management, and decision-making. Using a Rolling Forecast enhances accuracy and agility in financial strategy, making it essential for maintaining business resilience.
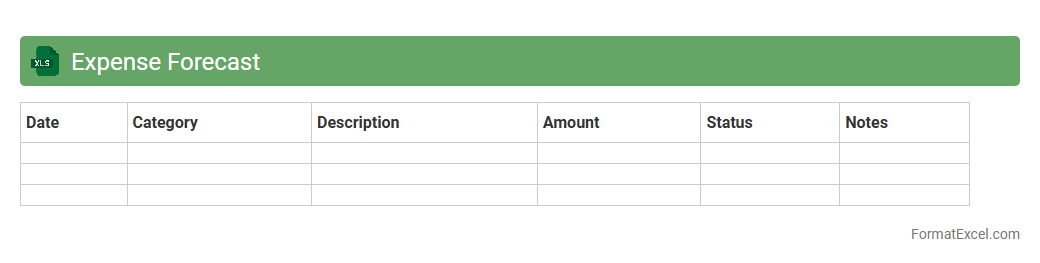
Expense Forecast
The Expense Forecast Excel document is a powerful tool designed to project future costs by organizing and analyzing spending patterns within customizable categories. It helps businesses and individuals anticipate financial obligations, manage budgets efficiently, and make informed decisions to avoid overspending. By utilizing formulas and data visualization features, the
Expense Forecast Excel enhances accuracy in financial planning and promotes proactive expense management.
Production Forecast
A
Production Forecast Excel document is a tool used to estimate future manufacturing output based on historical data, current capacity, and demand trends. It helps businesses plan resources, manage inventory, and align production schedules with market needs to optimize efficiency and reduce costs. This document provides a clear, data-driven overview that supports strategic decision-making and operational planning.
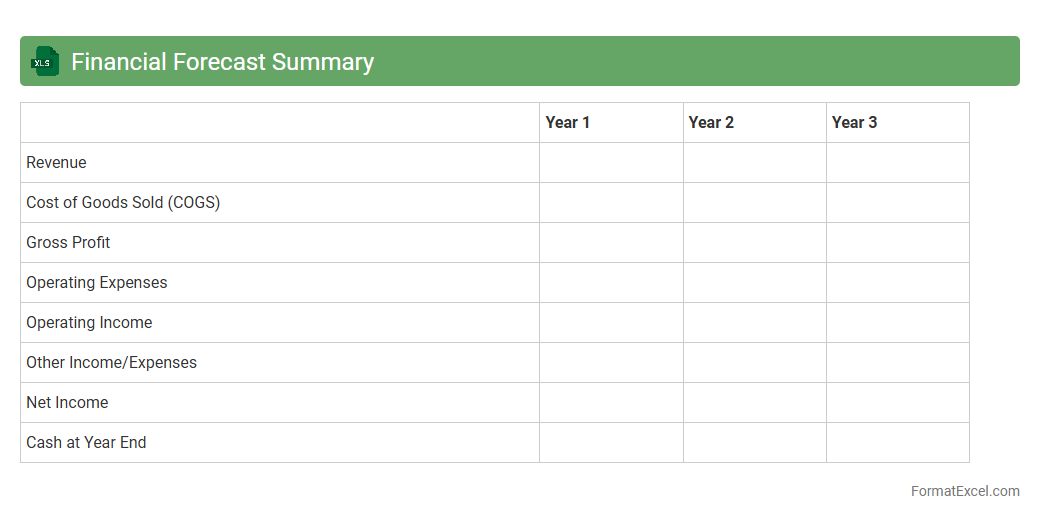
Financial Forecast Summary
A
Financial Forecast Summary Excel document provides a concise overview of projected revenues, expenses, and cash flows over a defined future period. It helps businesses and individuals anticipate financial performance, enabling informed decision-making and strategic planning. By consolidating key financial metrics, this tool supports budgeting, risk assessment, and investment evaluation efforts.
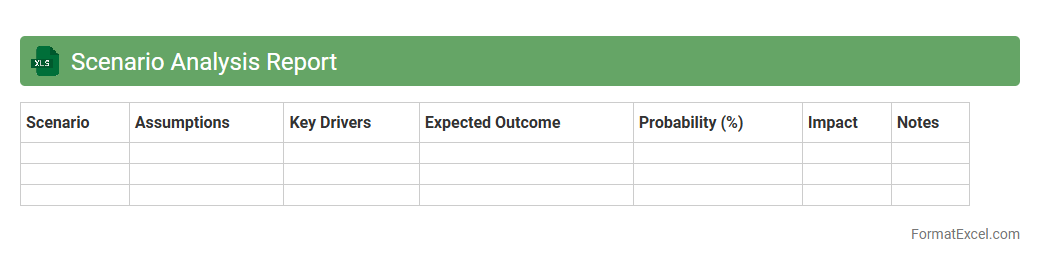
Scenario Analysis Report
A
Scenario Analysis Report Excel document is a powerful financial modeling tool that evaluates various business outcomes based on different assumptions and variables. It helps organizations forecast potential risks and opportunities by comparing multiple scenarios, enhancing strategic decision-making. This report is essential for budgeting, investment planning, and risk management, providing clear insight into how changes in key factors impact overall performance.
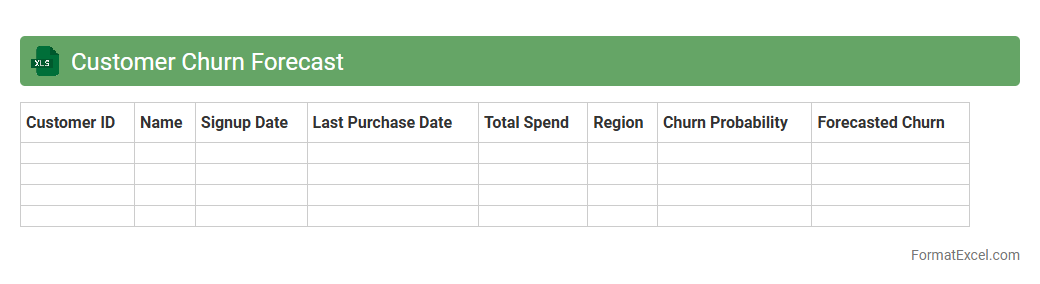
Customer Churn Forecast
The
Customer Churn Forecast Excel document is a powerful tool designed to predict which customers are likely to discontinue using a product or service based on historical data and behavioral patterns. By analyzing key metrics such as purchase frequency, customer support interactions, and engagement levels, this forecast helps businesses proactively retain customers and reduce revenue loss. Utilizing this data-driven approach enables companies to tailor marketing strategies and improve customer satisfaction effectively.
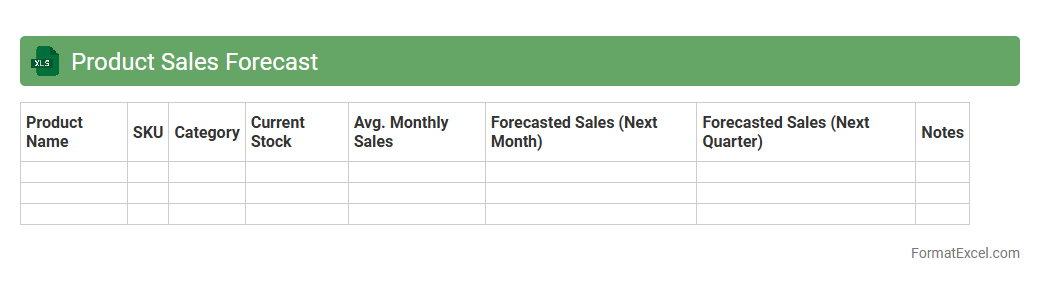
Product Sales Forecast
A
Product Sales Forecast Excel document is a spreadsheet tool designed to predict future sales volumes using historical data, seasonal trends, and market analysis. It helps businesses make informed decisions on inventory management, budgeting, and resource allocation by providing precise sales projections. Utilizing this document improves operational efficiency and supports strategic planning by minimizing risks associated with overstocking or stockouts.
Operational Forecast
The
Operational Forecast Excel document is a structured spreadsheet used to predict and analyze future business performance based on historical data and current trends. It helps in budgeting, resource allocation, and strategic planning by providing actionable insights through detailed financial and operational metrics. This tool enhances decision-making efficiency, enabling organizations to proactively manage risks and opportunities.
Profit Forecast
A
Profit Forecast Excel document is a financial planning tool that projects future revenues, expenses, and net profit over a specific period. It enables businesses to anticipate cash flow, make informed budgeting decisions, and set realistic financial goals based on historical data and market trends. Utilizing this document supports strategic planning by identifying potential risks and opportunities, ensuring more accurate financial management and growth forecasting.
Growth Trend Analysis
A
Growth Trend Analysis Excel document tracks and visualizes data over time to identify patterns and trajectories in business performance or market behavior. It enables users to forecast future growth, make informed decisions, and allocate resources efficiently based on historical trends. By leveraging formulas, charts, and pivot tables, this tool simplifies complex data into actionable insights for strategic planning.
Territory Sales Forecast
A
Territory Sales Forecast Excel document is a strategic planning tool that predicts future sales performance across different geographic regions or sales territories. It helps businesses allocate resources, set realistic targets, and identify growth opportunities by analyzing historical sales data and market trends. Using this forecast enhances decision-making, improves sales team accountability, and drives revenue optimization by providing clear visibility into expected sales outcomes.
Market Share Forecast
A
Market Share Forecast Excel document is a powerful tool designed to estimate future market positions of companies or products based on historical data and predictive analytics. It enables businesses to visualize trends, assess competitive landscapes, and make data-driven decisions for strategic planning. Utilizing this forecast helps optimize marketing efforts, resource allocation, and investment by identifying potential growth opportunities and risks in the market.
Resource Allocation Forecast
A
Resource Allocation Forecast Excel document is a dynamic tool designed to predict and plan the distribution of resources such as personnel, equipment, and budget across various projects or departments. It helps organizations optimize resource utilization by providing clear visibility into future demands and availability, enabling efficient scheduling and avoiding overallocation. This forecast supports informed decision-making, ensuring that key projects are adequately staffed and resources are aligned with strategic goals.
Quarterly Forecast Comparison
The
Quarterly Forecast Comparison Excel document is a powerful tool that tracks and analyzes financial performance predictions against actual results across multiple quarters. It enables businesses to identify trends, adjust strategies, and improve budgeting accuracy by providing clear visual comparisons and detailed variance analysis. Utilizing this document enhances decision-making processes and ensures more reliable financial planning.
Backorder Forecast
The
Backorder Forecast Excel document is a powerful tool designed to track and predict inventory shortages by analyzing past order patterns and current stock levels. It enables businesses to identify potential backorders in advance, improving supply chain management and customer satisfaction. Utilizing this forecast helps reduce delays, optimize reorder timing, and maintain steady product availability.
Forecast Accuracy Assessment
The
Forecast Accuracy Assessment Excel document is a tool designed to evaluate the precision of predicted values against actual outcomes, helping businesses measure the reliability of their forecasting models. It enables users to calculate key performance metrics such as Mean Absolute Percentage Error (MAPE), Root Mean Square Error (RMSE), and tracking signals, providing actionable insights for improving forecasting methods. This assessment enhances decision-making by identifying discrepancies and optimizing resource allocation based on more accurate demand predictions.
Order Intake Forecast
The
Order Intake Forecast Excel document is a vital tool for projecting future sales by tracking and analyzing incoming customer orders over a specified period. It allows businesses to plan production schedules, manage inventory levels, and allocate resources efficiently, ensuring timely fulfillment of orders. By providing accurate demand insights, it enhances decision-making processes, helping companies optimize cash flow and improve supply chain management.
Bookings Forecast
The
Bookings Forecast Excel document is a powerful tool designed to project future sales bookings based on historical data and market trends. It enables businesses to anticipate revenue streams, manage resources more effectively, and align strategic planning with expected customer demand. Utilizing this document improves decision-making accuracy by providing clear insights into expected business performance.
Introduction to Forecast Analysis in Excel
Forecast analysis in Excel involves using historical data and statistical methods to predict future trends. Excel provides a versatile platform with various built-in tools and functions that facilitate accurate forecasting. Understanding how to leverage Excel's forecasting capabilities is essential for data-driven decision making.
Importance of Structured Forecast Formats
Structured forecast formats ensure consistency, clarity, and easy interpretation of predictive data. They help organize information systematically for effective analysis and communication. Using a standardized forecast template reduces errors and improves efficiency.
Key Components of a Forecast Analysis Template
A comprehensive forecast template includes data inputs, forecasting models, assumptions, and output visuals. Each component plays a critical role in the accuracy and usability of the forecast. The integration of these elements allows for seamless updates and analysis.
Setting Up Data Inputs for Forecasting
Accurate forecasting starts with clean, relevant, and well-organized data inputs. Input data often includes historical sales, market trends, and external variables influencing the forecast. Ensuring data accuracy and completeness is vital for reliable predictions.
Choosing the Right Forecasting Models
Selecting the appropriate forecasting model depends on the data pattern and business context. Common models include moving averages, exponential smoothing, and regression analysis. The model choice directly impacts forecast precision and usefulness.
Step-by-Step Guide to Building a Forecast Format
Building a forecast format involves defining objectives, gathering data, choosing models, and designing a user-friendly template. Incorporate formulas and functions to automate calculations and updates. A stepwise approach ensures a robust and scalable forecast system.
Utilizing Excel Functions for Accurate Predictions
Excel offers powerful functions like FORECAST, TREND, and LINEST that enable precise forecasting calculations. Combining these functions with data validation enhances prediction accuracy. Mastering Excel's forecasting functions is crucial for effective analysis.
Visualizing Forecast Data with Excel Charts
Charts such as line graphs, scatter plots, and bar charts help illustrate forecast trends visually. Clear visualization aids in stakeholder understanding and decision-making. Using dynamic Excel charts improves the presentation of forecast data.
Tips for Maintaining and Updating Forecast Templates
Regularly updating forecast templates with new data ensures ongoing accuracy. Implement version control and document changes for transparency. Maintaining template flexibility allows adaptation to evolving business needs.
Best Practices for Sharing and Presenting Forecast Results
Effective presentation involves concise summaries, clear visuals, and actionable insights tailored to the audience. Utilize Excel's collaboration tools for sharing and feedback. Emphasizing result clarity enhances the impact of forecast presentations.