Sales Revenue Forecast Report
A
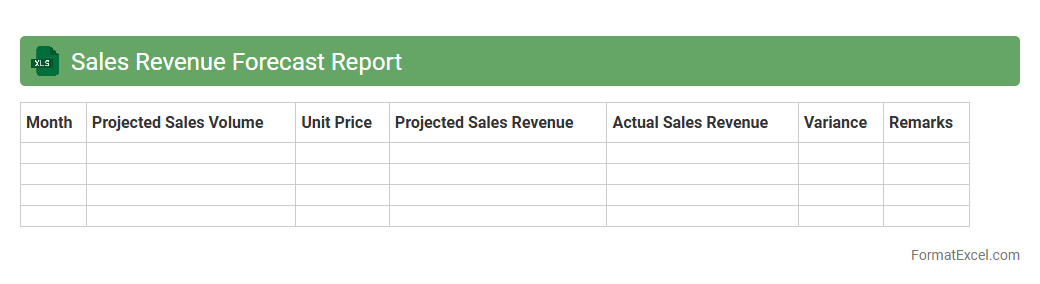
Sales Revenue Forecast Report Excel document is a tool that projects future sales income based on historical data, market trends, and sales analytics. It helps businesses anticipate cash flow, set realistic sales targets, and make informed budgeting decisions. Utilizing this report enhances strategic planning by providing clear visibility into expected revenue streams.
Inventory Forecast Report
An
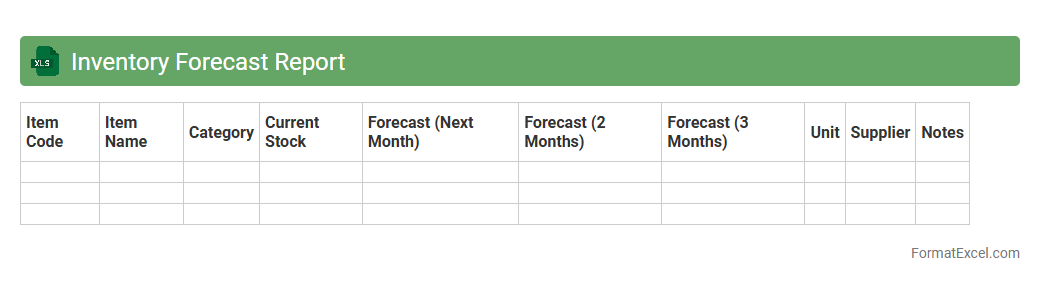
Inventory Forecast Report Excel document analyzes historical stock data to predict future inventory requirements, helping businesses maintain optimal stock levels. It assists in reducing overstock and stockouts by providing accurate demand projections based on sales trends and seasonal patterns. This report supports supply chain efficiency, cost reduction, and improved customer satisfaction through better inventory management.
Expense Forecast Report
An
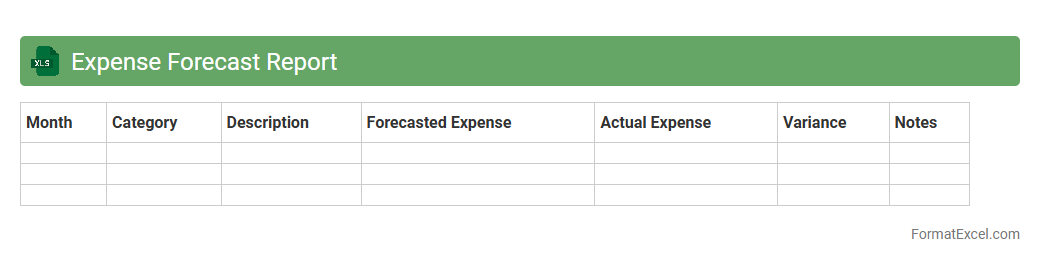
Expense Forecast Report Excel document is a financial planning tool that estimates future expenditures based on historical data and budget assumptions. It helps businesses monitor cash flow, plan resource allocation, and identify potential cost overruns before they occur. By providing clear visibility into expected costs, this report supports informed decision-making and enhances financial control.
Cash Flow Forecast Report
A
Cash Flow Forecast Report Excel document is a financial tool that projects future cash inflows and outflows over a specific period, helping businesses anticipate their liquidity needs. It enables accurate budgeting, ensures timely payments, and prevents cash shortages by offering a clear overview of expected cash positions. Utilizing this report supports informed decision-making and strengthens financial planning for sustained business growth.
Demand Forecast Report
A
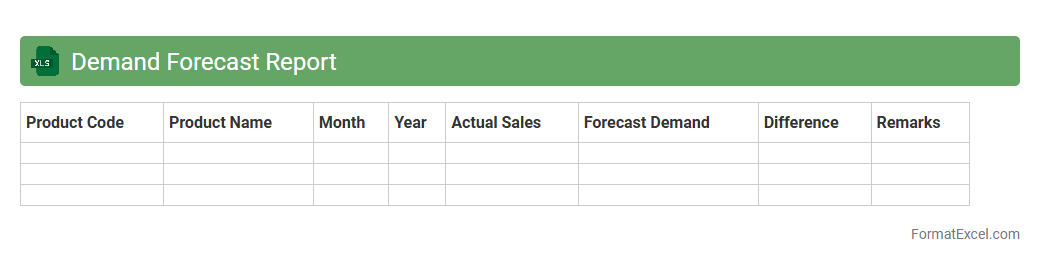
Demand Forecast Report Excel document is a detailed spreadsheet used to predict future customer demand for products or services based on historical sales data, market trends, and seasonality. It helps businesses optimize inventory levels, reduce stockouts, and improve supply chain efficiency by providing accurate demand projections. Utilizing this report enables better financial planning and resource allocation, ultimately enhancing overall operational performance.
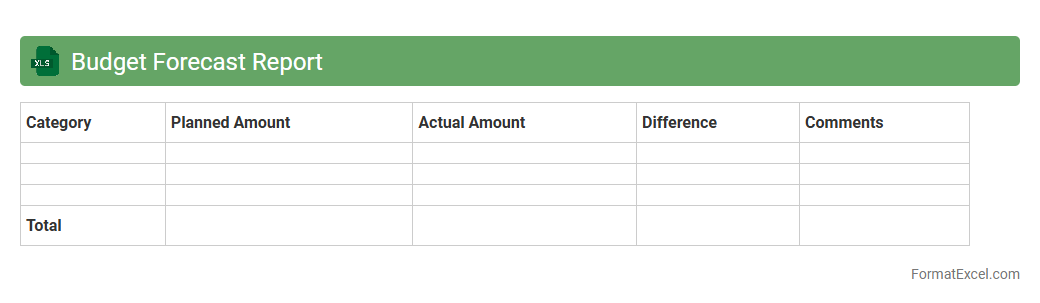
Budget Forecast Report
A
Budget Forecast Report Excel document is a detailed financial tool used to project future income, expenses, and cash flow based on historical data and planned activities. It helps businesses and individuals anticipate financial needs, identify potential shortfalls, and make informed decisions for resource allocation. By analyzing trends and variances, this report improves budgeting accuracy and supports strategic financial planning.
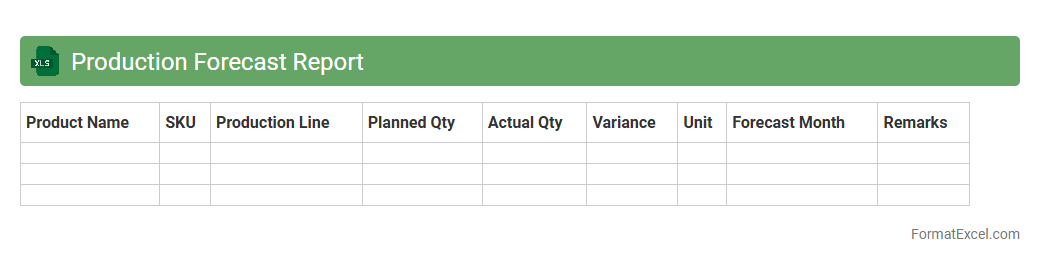
Production Forecast Report
A
Production Forecast Report Excel document is a tool used to predict future production volumes by analyzing historical data, current market trends, and capacity constraints. It helps businesses optimize resource allocation, reduce downtime, and improve supply chain management by providing actionable insights into expected output. Organizations utilize this report to plan inventory, schedule maintenance, and align production goals with demand forecasts for enhanced operational efficiency.
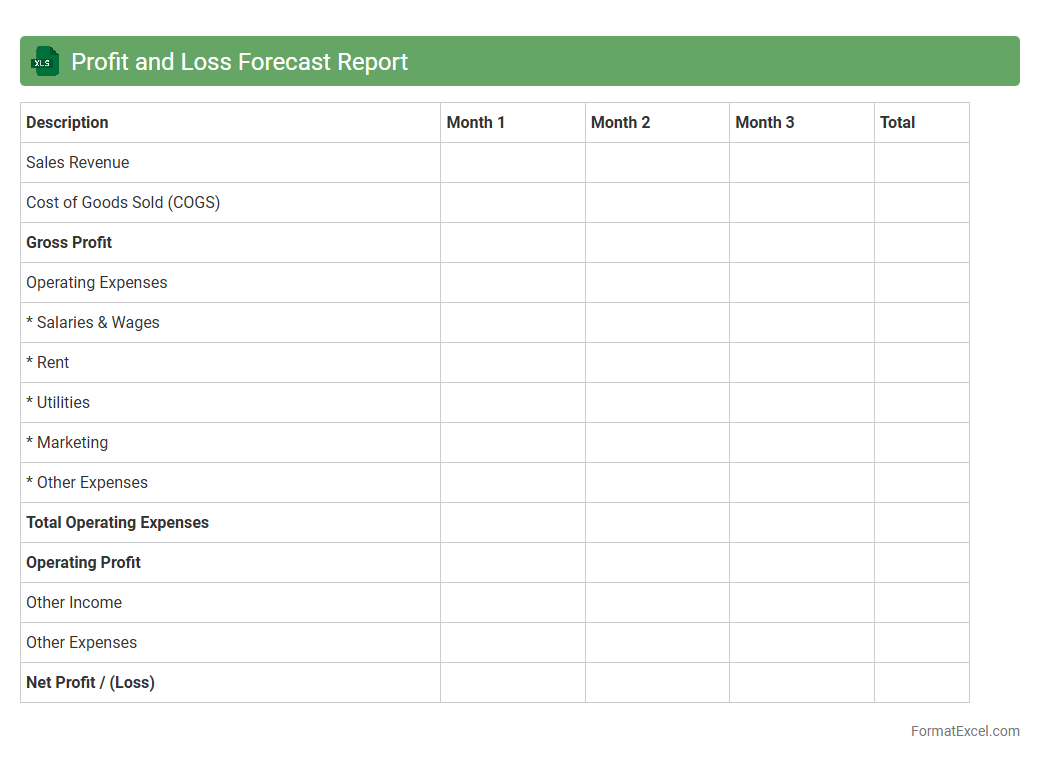
Profit and Loss Forecast Report
A
Profit and Loss Forecast Report Excel document is a financial planning tool that projects future revenues, expenses, and net profit over a specific period. It helps businesses anticipate financial outcomes, manage cash flow, and make informed decisions regarding budgeting and investment. Utilizing this report allows companies to identify potential financial risks and opportunities, ensuring better strategic planning and resource allocation.
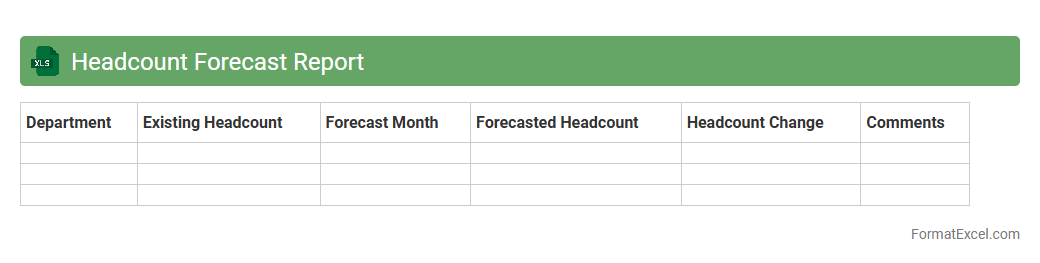
Headcount Forecast Report
The
Headcount Forecast Report Excel document projects future staffing needs by analyzing current employee data, turnover rates, and business growth trends. It enables organizations to plan workforce requirements effectively, ensuring optimal resource allocation and preventing overstaffing or shortages. This report supports strategic decision-making in budgeting, recruitment, and talent management by providing clear, data-driven insights into upcoming headcount changes.
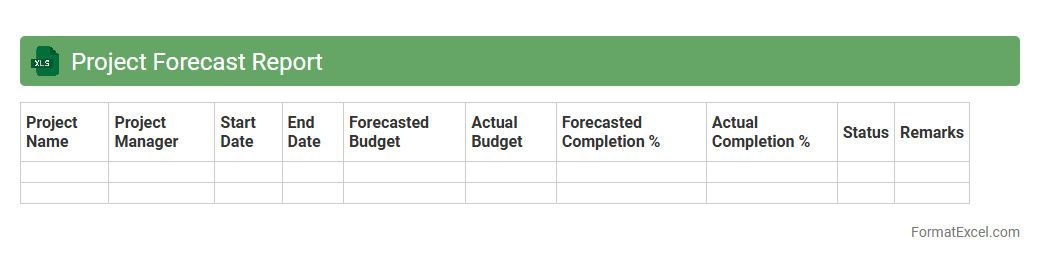
Project Forecast Report
A
Project Forecast Report Excel document is a dynamic tool designed to predict future project performance by analyzing current data trends and historical metrics. It helps project managers and stakeholders anticipate potential risks, allocate resources efficiently, and make informed decisions to ensure project success. By providing clear visualizations of timelines, budgets, and task progress, this report enhances transparency and strategic planning throughout the project lifecycle.
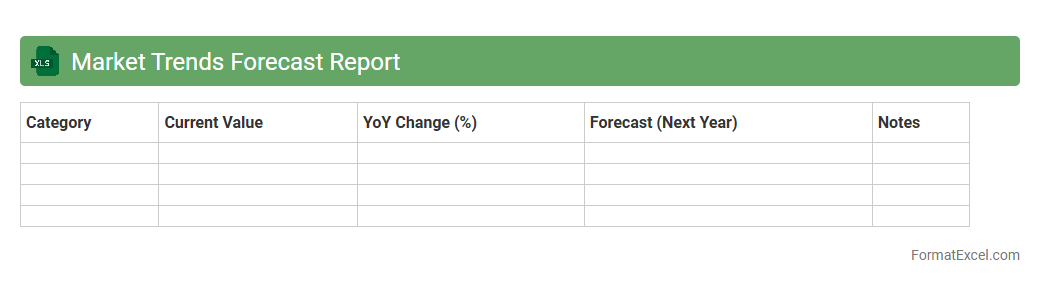
Market Trends Forecast Report
A
Market Trends Forecast Report Excel document compiles data on industry patterns, sales projections, and consumer behavior to predict future market movements. It helps businesses make informed decisions by analyzing historical data and identifying emerging opportunities. Using this report, companies can optimize strategies, allocate resources efficiently, and reduce risks associated with market fluctuations.
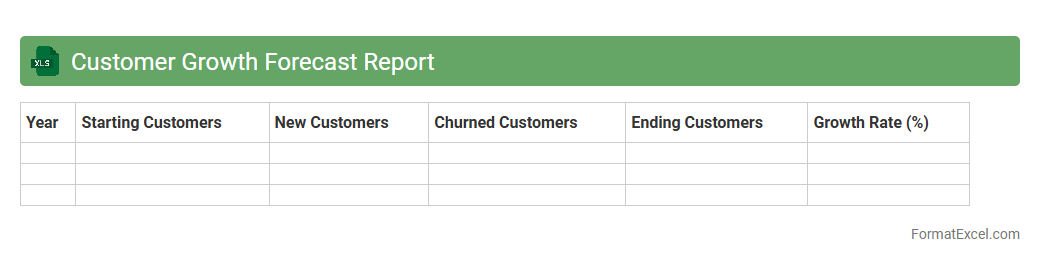
Customer Growth Forecast Report
The
Customer Growth Forecast Report Excel document is a detailed tool that analyzes historical customer data to predict future growth trends, enabling businesses to make informed decisions. It utilizes advanced formulas and visualization features to track key metrics such as customer acquisition, retention rates, and revenue projections. This report is essential for strategic planning, resource allocation, and identifying opportunities to enhance customer engagement and increase profitability.
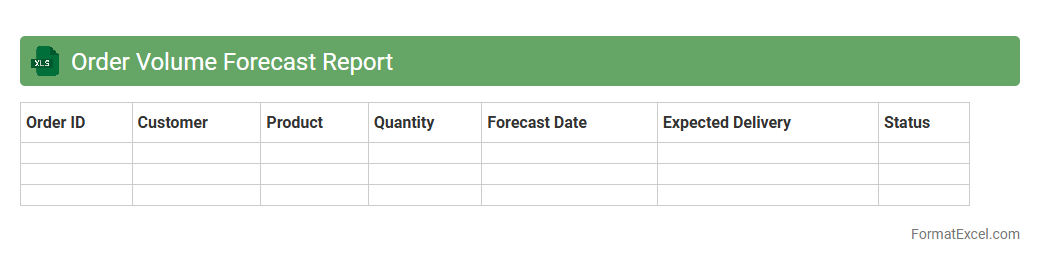
Order Volume Forecast Report
The
Order Volume Forecast Report Excel document provides a detailed projection of expected order quantities based on historical sales data and market trends. It helps businesses optimize inventory management, streamline supply chain operations, and improve demand planning accuracy. By forecasting order volumes, companies can reduce stockouts, minimize excess inventory, and enhance overall operational efficiency.
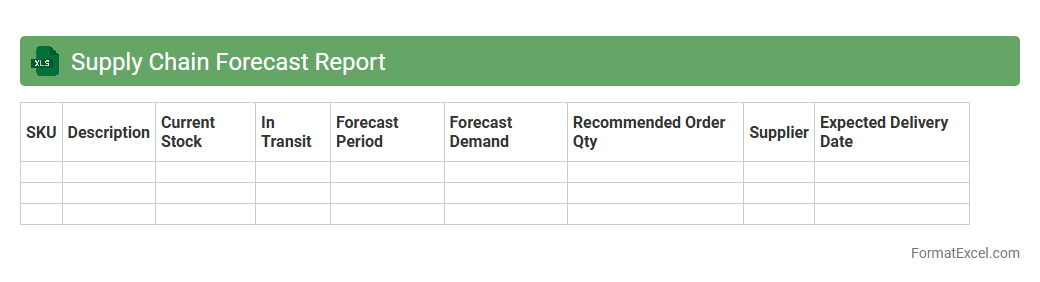
Supply Chain Forecast Report
The
Supply Chain Forecast Report Excel document provides detailed projections of inventory levels, demand patterns, and supplier performance, enabling businesses to optimize procurement and production planning. By analyzing historical data and market trends, it helps minimize stockouts and excess inventory, improving overall operational efficiency. This report supports strategic decision-making by offering clear visibility into future supply chain requirements and potential disruptions.
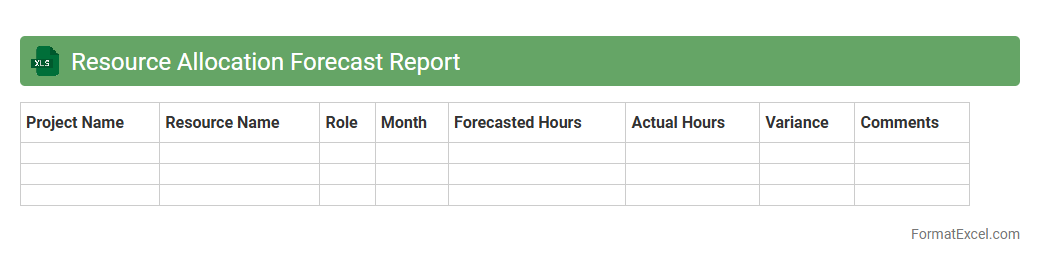
Resource Allocation Forecast Report
A
Resource Allocation Forecast Report Excel document systematically tracks and predicts the distribution of resources across projects and tasks, enabling efficient planning and management. This report helps identify potential resource shortages or surpluses, optimize workforce utilization, and align resource availability with project timelines. By providing clear visibility into resource allocation trends, it supports informed decision-making and enhances overall project productivity.
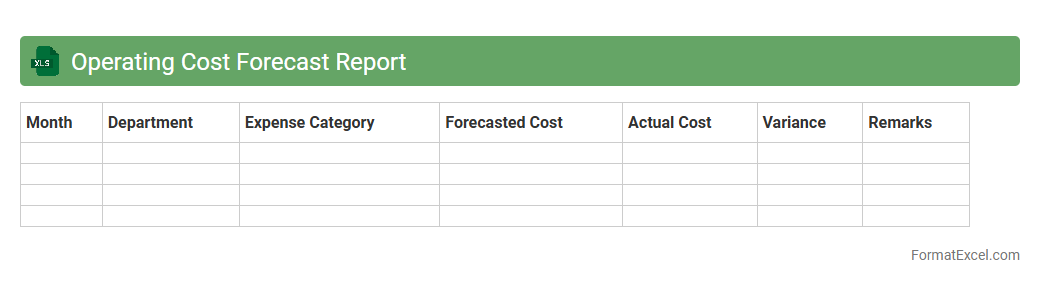
Operating Cost Forecast Report
The
Operating Cost Forecast Report Excel document provides a detailed projection of future expenses related to daily business operations, including labor, materials, utilities, and maintenance costs. This report is useful for budgeting, financial planning, and identifying potential cost-saving opportunities by analyzing historical data and trends. Businesses rely on it to ensure efficient resource allocation and to maintain profitability over time.
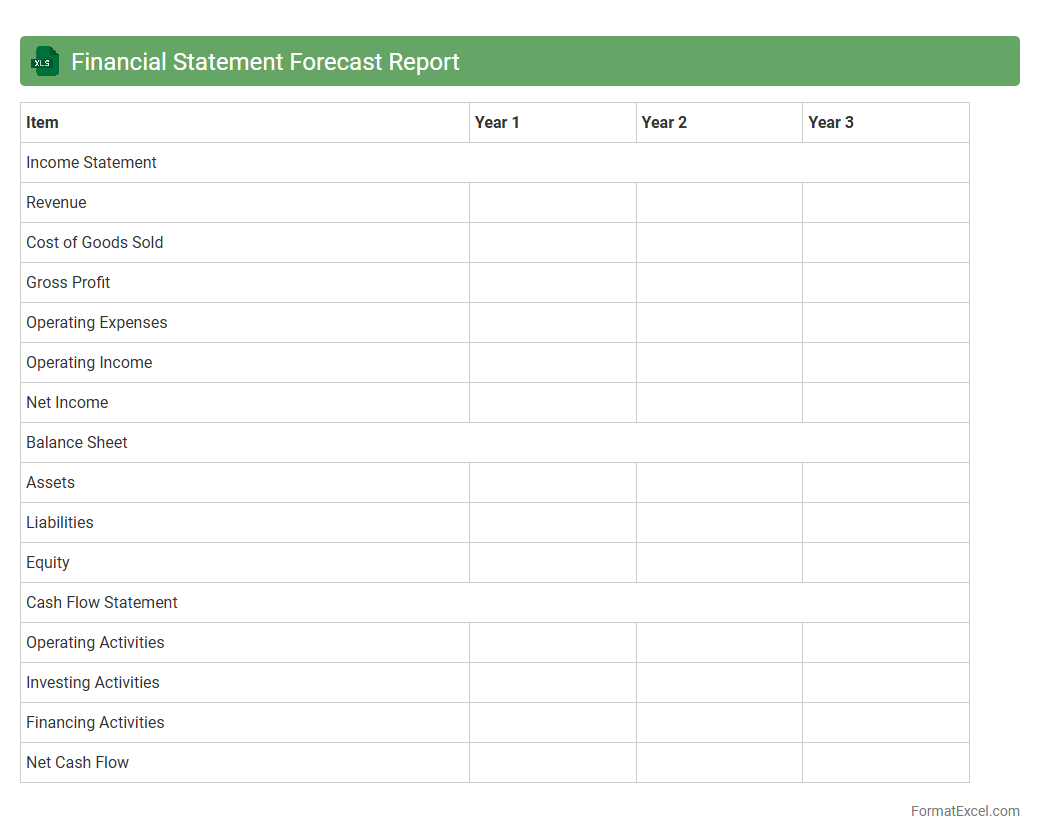
Financial Statement Forecast Report
The
Financial Statement Forecast Report Excel document is a tool that helps businesses project future financial performance by analyzing historical data and estimating revenues, expenses, and cash flows. It enables decision-makers to plan budgets, manage risks, and allocate resources efficiently by visualizing potential financial outcomes. Using this forecast report improves strategic planning and supports investor communication by providing transparent and data-driven financial insights.
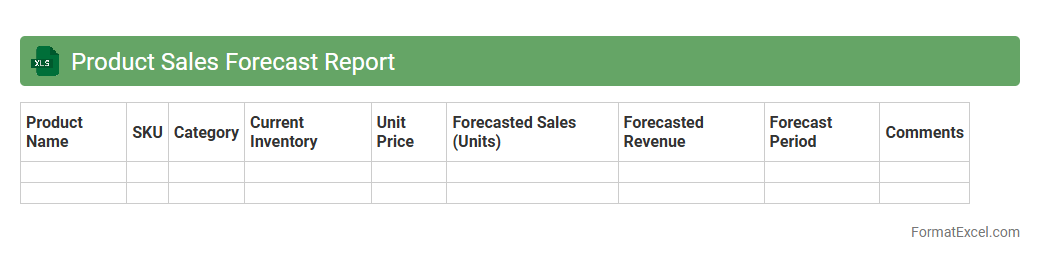
Product Sales Forecast Report
A
Product Sales Forecast Report Excel document projects future sales based on historical data, trends, and market analysis. It helps businesses plan inventory, manage cash flow, and set realistic sales targets by providing data-driven insights. Utilizing this report enhances decision-making accuracy and supports strategic growth initiatives.
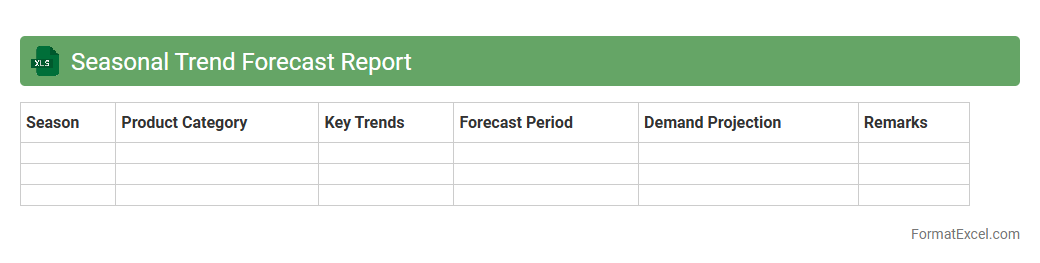
Seasonal Trend Forecast Report
A
Seasonal Trend Forecast Report Excel document is a detailed analysis tool that compiles historical sales and market data to predict upcoming seasonal patterns and consumer behavior. This report helps businesses optimize inventory management, marketing strategies, and product launches by providing clear insights into peak demand periods and shifting market trends. Utilizing such data-driven forecasts enables companies to reduce costs, increase sales efficiency, and maintain competitive advantage throughout fluctuating seasons.
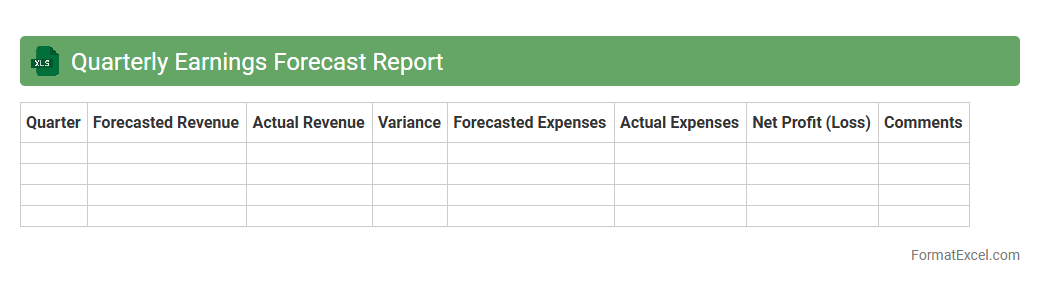
Quarterly Earnings Forecast Report
The
Quarterly Earnings Forecast Report Excel document provides a detailed projection of a company's anticipated financial performance for the upcoming quarter, including revenue, expenses, and net profit estimates. This report is essential for investors, analysts, and management to make informed decisions, track business trends, and adjust strategies based on expected financial outcomes. Utilizing this document allows for better budgeting, resource allocation, and preparation for market fluctuations.
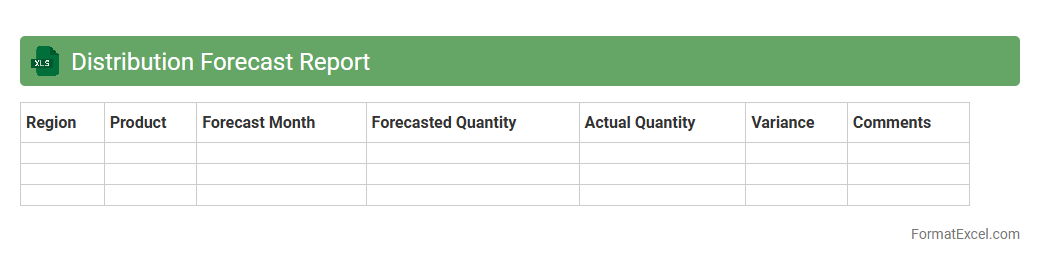
Distribution Forecast Report
A
Distribution Forecast Report Excel document provides detailed projections of product distribution volumes across various channels and time periods, enabling businesses to anticipate supply chain needs accurately. This report helps in optimizing inventory levels, reducing stockouts, and improving overall logistics efficiency by analyzing historical data and market trends. Using this tool, companies can make informed decisions to align production schedules with market demand and enhance customer satisfaction.
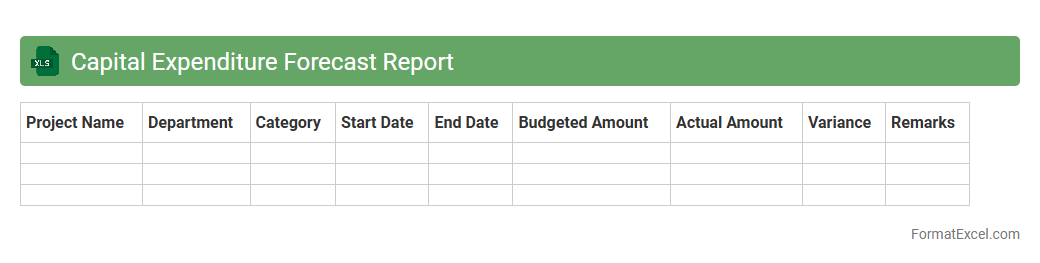
Capital Expenditure Forecast Report
A
Capital Expenditure Forecast Report Excel document is a financial planning tool that helps organizations estimate future spending on long-term assets such as equipment, property, and infrastructure. It enables businesses to allocate budgets accurately, anticipate funding needs, and make informed investment decisions. This report is essential for tracking capital expenses over time, optimizing cash flow management, and ensuring alignment with strategic growth objectives.
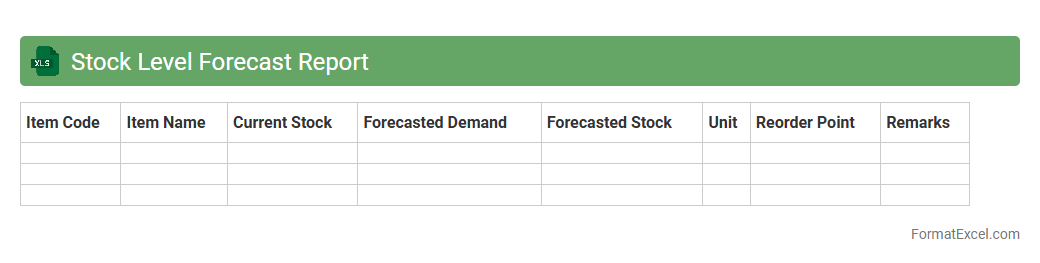
Stock Level Forecast Report
A
Stock Level Forecast Report Excel document projects future inventory needs by analyzing historical sales and current stock data to prevent overstocking or stockouts. It enables businesses to optimize inventory levels, reduce carrying costs, and improve supply chain efficiency. This report provides actionable insights for making informed purchasing and production decisions.
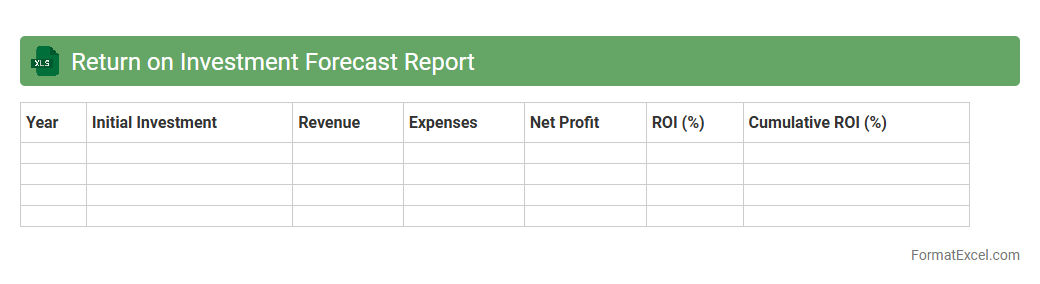
Return on Investment Forecast Report
A
Return on Investment Forecast Report Excel document projects future financial returns by analyzing investment costs and expected revenues, helping businesses estimate profitability and optimize resource allocation. It enables decision-makers to compare different investment opportunities, assess risks, and set realistic financial goals. Utilizing this report enhances strategic planning and supports evidence-based financial management.
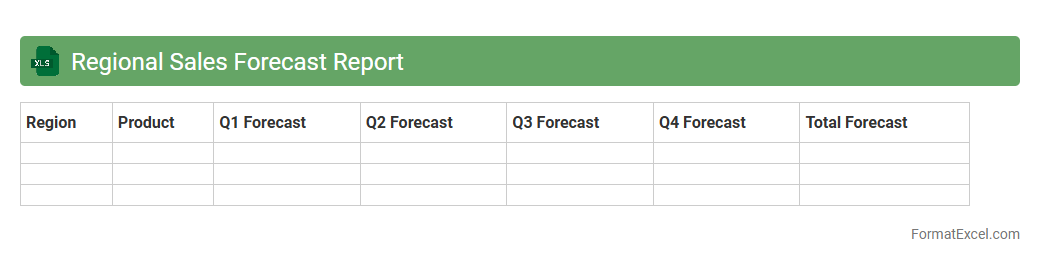
Regional Sales Forecast Report
The
Regional Sales Forecast Report Excel document provides a detailed projection of sales performance across different geographic regions, utilizing historical data and market trends to predict future sales volumes. It enables businesses to allocate resources efficiently, identify high-potential markets, and design targeted marketing strategies. Accurate regional sales forecasts are essential for inventory management, budgeting, and enhancing overall sales growth.
Introduction to Forecast Report Format in Excel
The Forecast Report Format in Excel serves as a structured framework for predicting future trends based on historical data. It simplifies data analysis and supports strategic decision-making. Excel's versatility makes it a preferred tool for creating these reports efficiently.
Importance of Standardized Forecast Reports
Standardized forecast reports ensure consistency, accuracy, and reliability in presenting predictions across various departments. They facilitate easier comparison of data and help stakeholders understand forecast outcomes clearly. Uniformity also streamlines report updating and auditing processes.
Key Components of an Excel Forecast Report
A typical Excel forecast report includes data input tables, trend analysis, visual charts, and summary sections. Each component plays a crucial role in organizing, analyzing, and interpreting forecast data effectively. Including assumptions and notes further enhances understanding and transparency.
Step-by-Step Guide to Creating a Forecast Report in Excel
Begin by gathering historical data, then input it into organized Excel tables. Use built-in functions and charts to analyze trends, followed by summarizing insights in the report. A systematic process ensures accuracy and clarity throughout the creation of the forecast.
Essential Excel Functions for Forecasting
Functions like FORECAST, TREND, and LINEST are essential for predicting future values based on past data patterns. Additionally, statistical functions like AVERAGE and STDEV support variability assessment. Mastering these functions enhances the precision of forecasts in Excel.
Designing Effective Data Tables and Charts
Effective tables organize raw data clearly, while charts visually represent trends and comparisons. Using dynamic elements like slicers or pivot charts improves data visualization and user interaction. Well-designed layouts enhance comprehension and presentation quality.
Customizing Templates for Forecast Reports
Templates can be tailored by modifying layouts, color schemes, and input fields to suit specific forecasting needs. This customization saves time and ensures alignment with branding or reporting standards. A customized template streamlines report generation across multiple projects.
Tips for Accurate Financial Forecasting in Excel
Maintain updated and clean data sets to improve forecast accuracy. Incorporate scenarios and sensitivity analysis to capture potential variations. Following these tips reduces errors and enhances the reliability of financial forecasts.
Common Mistakes to Avoid in Excel Forecast Reports
Avoid errors like using incomplete data, ignoring data trends, or neglecting proper formatting. Overcomplicated models can confuse users and reduce report effectiveness. Recognizing these mistakes ensures clearer, more reliable forecast reports.
Downloadable Forecast Report Templates for Excel
Access free and premium downloadable templates to jumpstart your forecasting process. These templates offer pre-built structures with formulas and charts ready for customization. Utilizing templates saves time and supports best practices in report design.