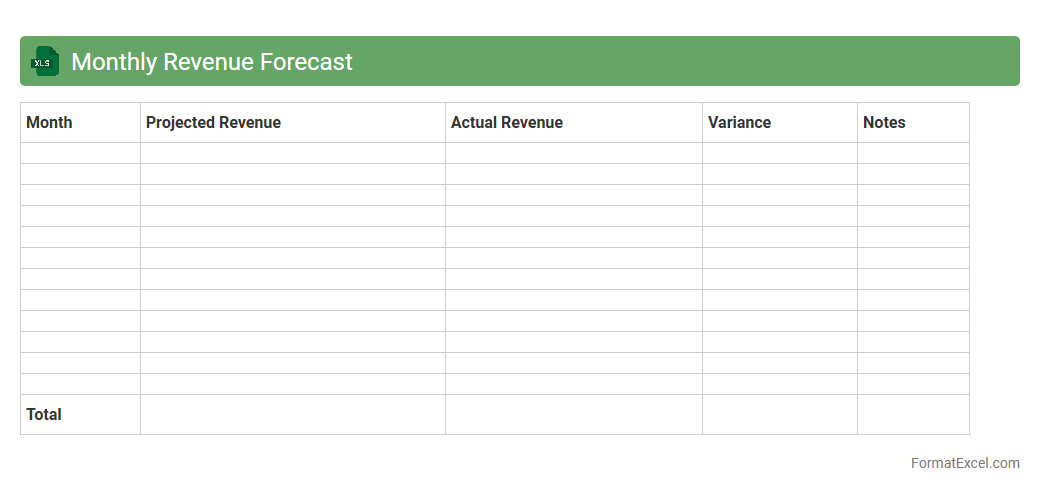
Monthly Revenue Forecast
The
Monthly Revenue Forecast Excel document is a dynamic financial tool that projects expected income over upcoming months, based on historical sales data and market trends. It enables businesses to anticipate cash flow, set realistic financial goals, and make informed decisions on budgeting and resource allocation. Leveraging this forecast supports strategic planning by highlighting potential revenue fluctuations and identifying growth opportunities.
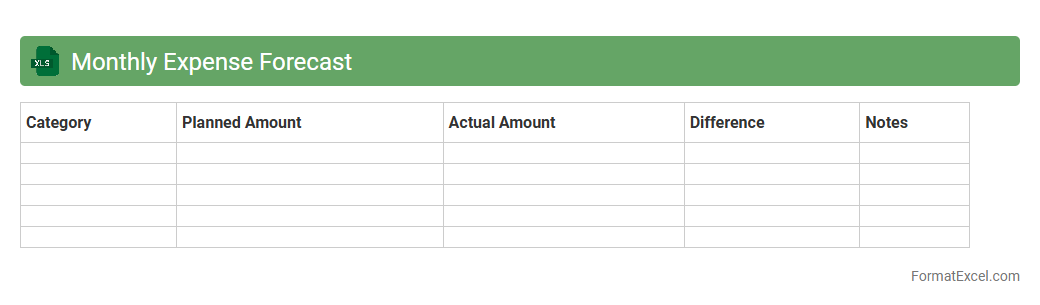
Monthly Expense Forecast
The
Monthly Expense Forecast Excel document is a financial tool designed to track and predict upcoming expenses based on historical spending patterns and planned budgets. It helps users identify spending trends, allocate resources efficiently, and avoid overspending by providing clear visibility into expected monthly outflows. Businesses and individuals can make informed financial decisions and improve cash flow management by regularly updating and analyzing this forecast.
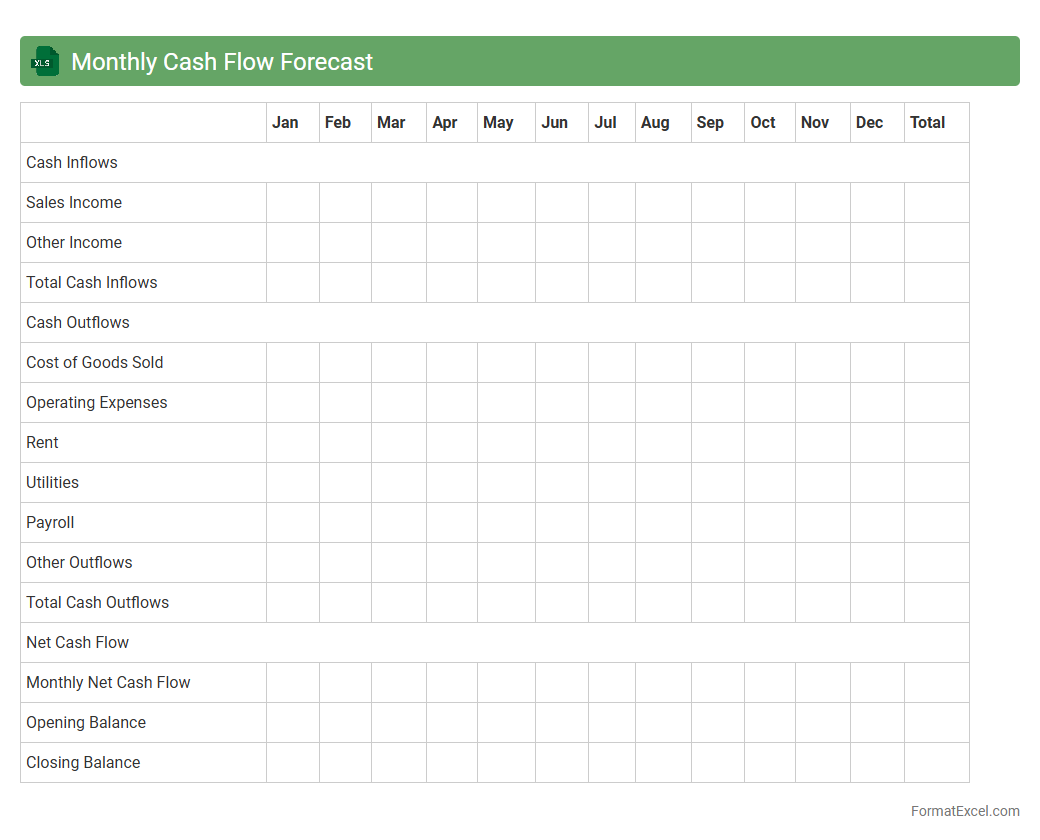
Monthly Cash Flow Forecast
The
Monthly Cash Flow Forecast Excel document is a financial tool that estimates a business's cash inflows and outflows over a specified month. It helps businesses anticipate periods of liquidity shortages or surpluses, enabling proactive financial management. By tracking expected revenue and expenses, this document supports budgeting, ensures timely bill payments, and improves overall financial planning accuracy.
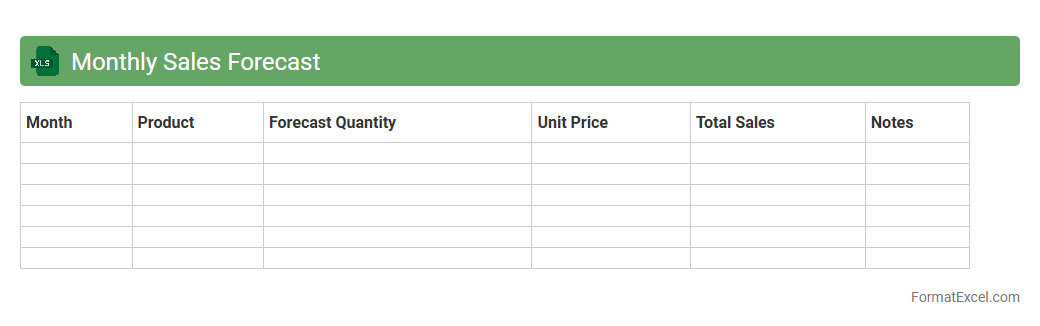
Monthly Sales Forecast
A
Monthly Sales Forecast Excel document is a spreadsheet tool designed to project future sales based on historical data, market trends, and sales patterns. It helps businesses plan inventory, set realistic targets, allocate resources effectively, and make informed financial decisions. By analyzing monthly sales forecasts, companies can anticipate demand fluctuations and improve overall sales strategy execution.
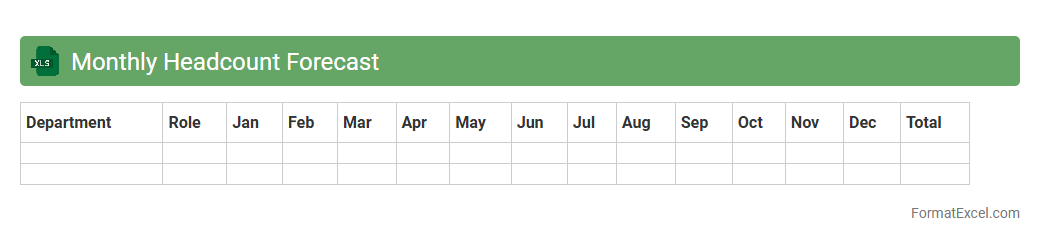
Monthly Headcount Forecast
The
Monthly Headcount Forecast Excel document is a detailed tool used to predict workforce needs by analyzing hiring trends, attrition rates, and business growth projections on a monthly basis. It enables HR and management teams to optimize staffing decisions, control labor costs, and ensure adequate manpower aligns with company objectives. Accurate forecasting through this document supports strategic planning, budget allocation, and helps prevent overstaffing or understaffing challenges.
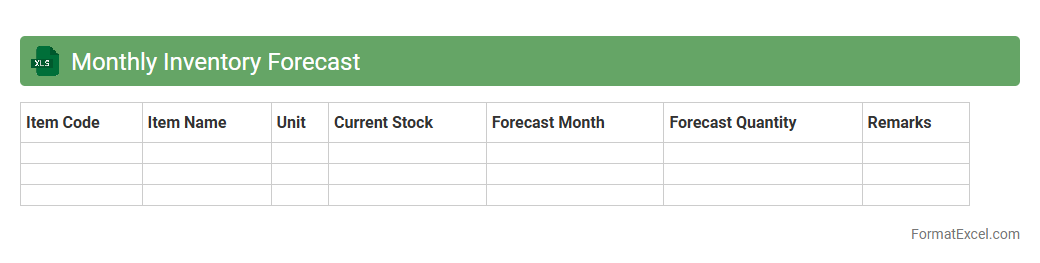
Monthly Inventory Forecast
The
Monthly Inventory Forecast Excel document is a powerful tool designed to predict future inventory needs based on historical sales data, seasonal trends, and supplier lead times. It helps businesses maintain optimal stock levels, minimize carrying costs, and avoid stockouts by providing accurate demand projections for each month. Utilizing this forecast enables more informed purchasing decisions and improves overall supply chain efficiency.
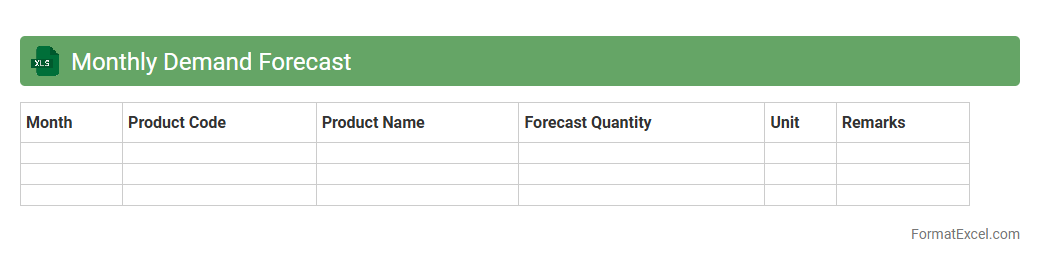
Monthly Demand Forecast
The
Monthly Demand Forecast Excel document is a data-driven tool designed to predict product or service demand for upcoming months based on historical sales, market trends, and seasonal patterns. It helps businesses optimize inventory management, reduce stockouts or overstock situations, and plan production schedules efficiently. Leveraging this forecast enhances decision-making accuracy, leading to improved customer satisfaction and cost savings.
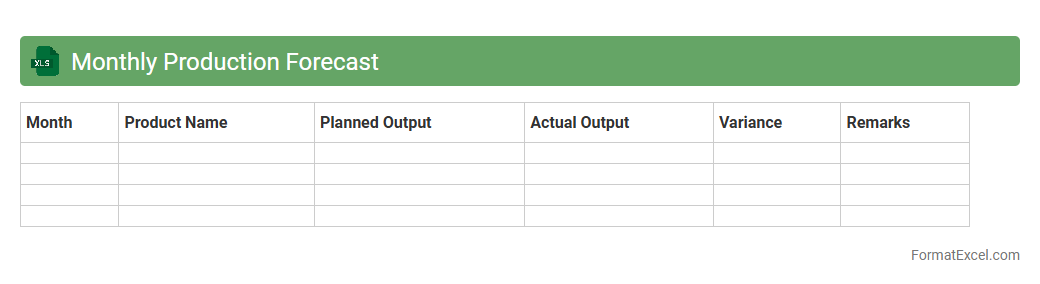
Monthly Production Forecast
A
Monthly Production Forecast Excel document is a strategic tool used to estimate future manufacturing output based on historical data, market demand, and production capacity. This forecast helps businesses optimize resource allocation, manage inventory levels, and align supply chain operations efficiently. By providing clear visibility into expected production volumes, it supports decision-making processes and enhances operational planning accuracy.
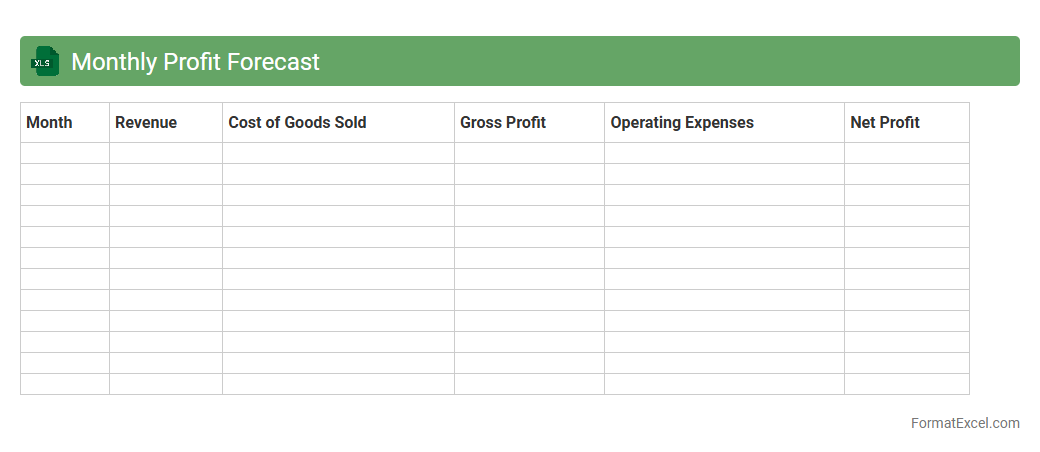
Monthly Profit Forecast
The
Monthly Profit Forecast Excel document is a financial tool designed to project expected profits over a given month by analyzing revenue, expenses, and other key financial metrics. It helps businesses anticipate cash flow trends, identify potential shortfalls, and make informed decisions regarding budgeting and resource allocation. By providing a clear overview of projected profitability, this document supports strategic planning and enhances financial management accuracy.
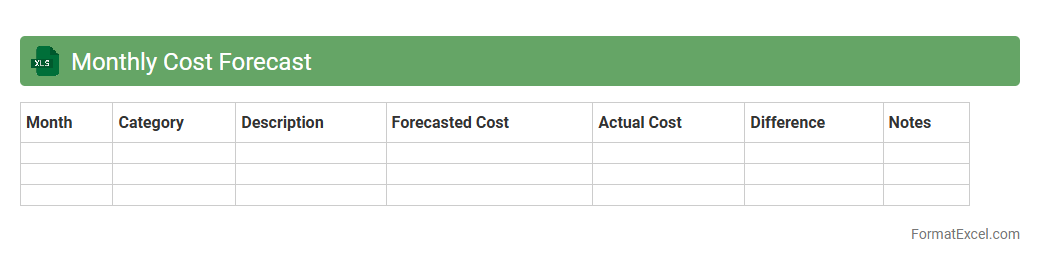
Monthly Cost Forecast
A
Monthly Cost Forecast Excel document is a financial tool used to project and track expenses over a specific period, usually on a monthly basis. It helps businesses and individuals anticipate cash flow needs, manage budgets effectively, and identify potential cost overruns before they occur. By providing detailed insights into future expenditures, this forecast supports strategic decision-making and improves financial planning accuracy.
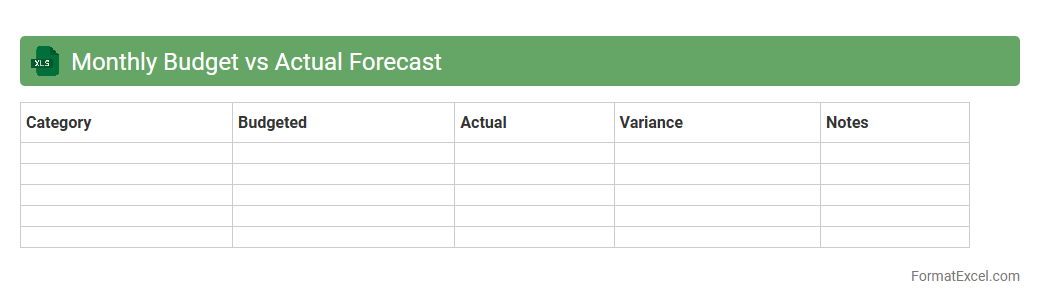
Monthly Budget vs Actual Forecast
The
Monthly Budget vs Actual Forecast Excel document is a financial tool designed to compare planned budget figures against actual income and expenses within a specific month, enabling accurate tracking of financial performance. It helps identify variances between expected and real financial outcomes, facilitating better decision-making, expense control, and resource allocation. Using this document improves financial accountability and supports strategic planning by providing clear visibility into budget adherence and cash flow management.
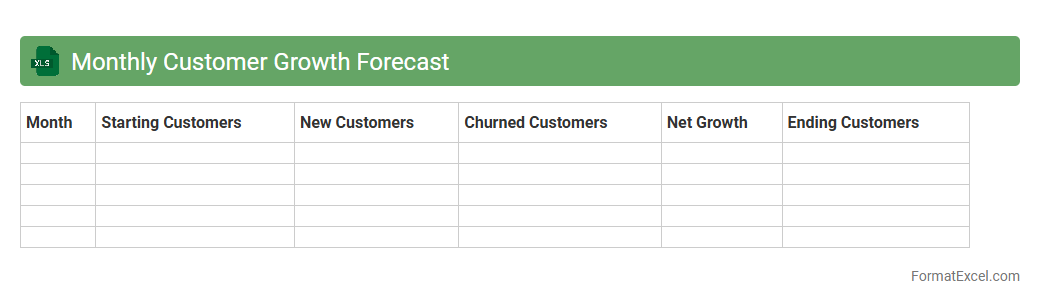
Monthly Customer Growth Forecast
The
Monthly Customer Growth Forecast Excel document is a strategic tool designed to project future customer increases based on historical data and market trends. It enables businesses to anticipate demand fluctuations, optimize resource allocation, and tailor marketing efforts effectively. Utilizing this forecast helps improve decision-making by providing clear insights into potential customer base expansions over time.
Monthly Churn Forecast
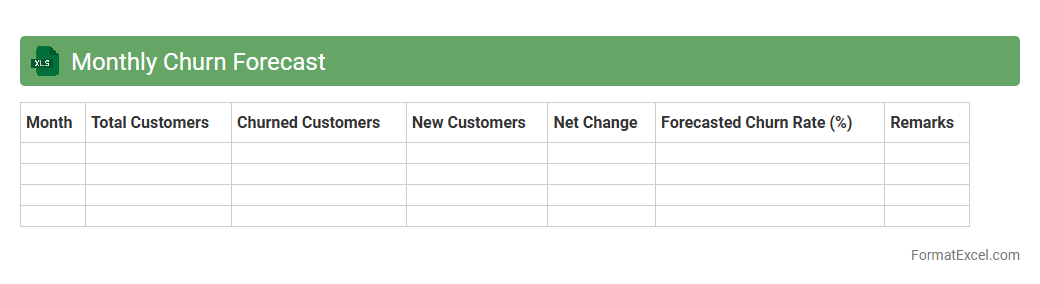
The
Monthly Churn Forecast Excel document is a strategic tool designed to predict customer attrition rates over a set period, enabling businesses to anticipate turnover and manage retention efforts effectively. This document compiles historical data and key metrics such as customer engagement, subscription renewal rates, and cancellation trends to generate accurate forecasts. Utilizing this forecast helps organizations identify potential revenue losses early and implement targeted interventions to improve customer loyalty and overall business stability.
Monthly Project Forecast
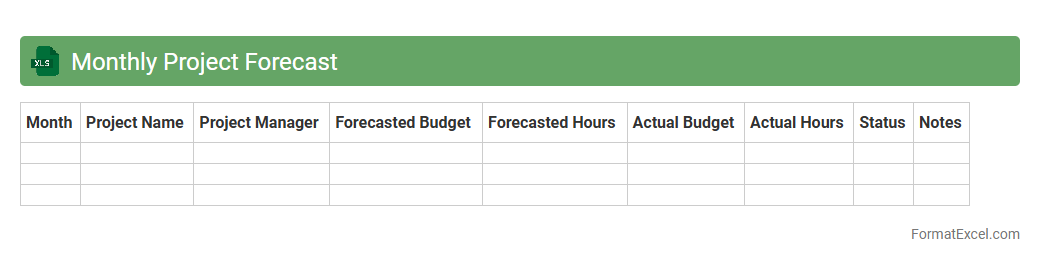
The
Monthly Project Forecast Excel document is a strategic tool designed to estimate project progress, resource allocation, and budget utilization on a monthly basis. It provides detailed insights into timelines, milestones, and financial projections, enabling teams to identify potential delays and cost overruns early. This document is essential for data-driven decision-making, improving project management efficiency, and ensuring alignment with organizational goals.
Monthly Capital Expenditure Forecast
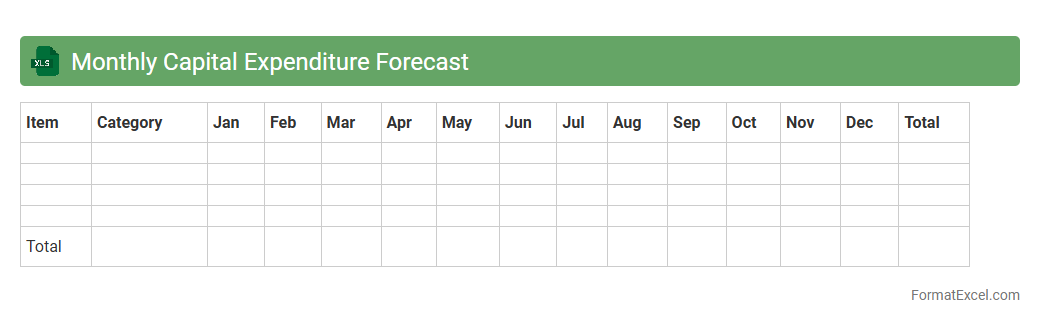
A
Monthly Capital Expenditure Forecast Excel document is a financial planning tool that projects upcoming capital expenses for a business or project on a month-by-month basis. It helps organizations allocate budgets efficiently, anticipate cash flow requirements, and make informed investment decisions by tracking planned expenditures on assets like equipment, property, or technology. Utilizing this forecast enables better financial control and supports strategic planning to align capital spending with business objectives.
Monthly Order Forecast
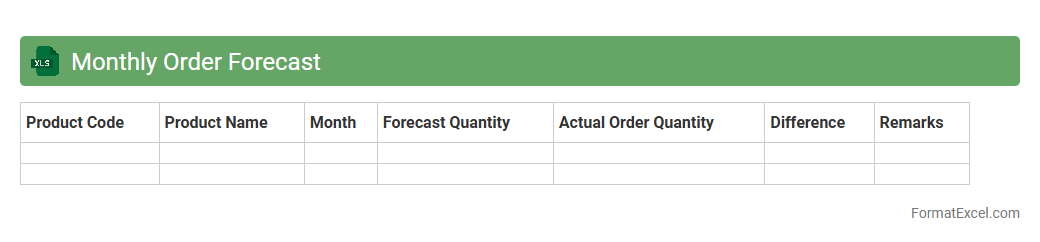
The
Monthly Order Forecast Excel document is a detailed tool that projects future customer orders based on historical sales data and market trends. It helps businesses anticipate demand, optimize inventory levels, and plan production schedules more efficiently. Utilizing this forecast reduces stockouts and excess inventory, leading to improved cash flow and customer satisfaction.
Monthly Lead Forecast
The
Monthly Lead Forecast Excel document projects the number of potential sales leads expected each month, enabling sales teams to plan resources and strategies effectively. It consolidates historical lead data and market trends to provide accurate predictions that improve decision-making. This tool enhances pipeline management and helps identify periods requiring increased marketing efforts.
Monthly Gross Margin Forecast
The
Monthly Gross Margin Forecast Excel document is a financial tool designed to project the company's gross profit by estimating revenue and subtracting the cost of goods sold on a monthly basis. It helps businesses anticipate profitability trends, make informed budgeting decisions, and identify potential cost-saving opportunities. Using this forecast, managers can optimize pricing strategies, allocate resources more efficiently, and improve overall financial planning.
Monthly Marketing Spend Forecast
The
Monthly Marketing Spend Forecast Excel document is a strategic tool designed to project and track marketing expenses over a specific period. It helps businesses allocate budgets efficiently by estimating future costs based on historical data, campaign plans, and seasonal trends. This document enhances financial planning accuracy, enabling teams to optimize resource allocation and maximize return on marketing investments.
Monthly Resource Allocation Forecast
The
Monthly Resource Allocation Forecast Excel document is a strategic tool used for planning and distributing resources effectively across projects or departments over a monthly period. It helps organizations anticipate resource needs, avoid overallocation, and ensure optimal utilization by providing detailed visibility into workforce availability, workload, and capacity. Utilizing this forecast enhances decision-making, improves project timelines, and supports budget management by aligning resources with business priorities.
Monthly Utilization Forecast
The
Monthly Utilization Forecast Excel document is a tool designed to project resource usage and capacity planning over a specific month. It helps organizations anticipate workload distribution, optimize staffing, and manage operational efficiency by providing clear visibility into expected utilization rates. This forecast enables informed decision-making to prevent resource overallocation or underutilization, enhancing productivity and cost management.
Monthly Pipeline Forecast
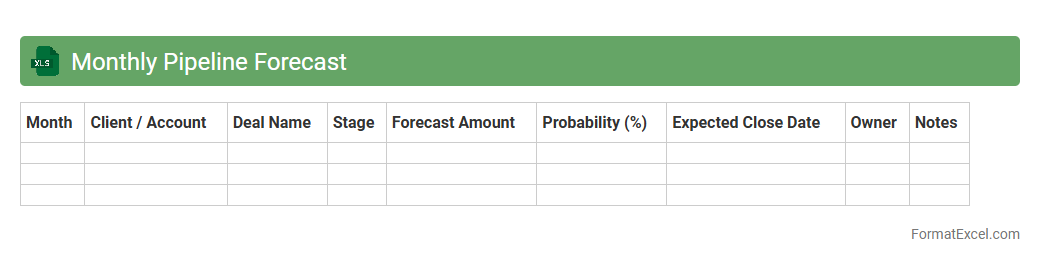
The
Monthly Pipeline Forecast Excel document is a detailed tool used to track and project sales opportunities throughout a given month, providing clear visibility into potential revenue streams and deal progress. It organizes data on lead sources, deal stages, expected close dates, and forecasted values, enabling teams to prioritize efforts and allocate resources effectively. This forecast model supports strategic decision-making by highlighting trends, identifying bottlenecks, and ensuring alignment with overall sales targets.
Monthly Pricing Forecast
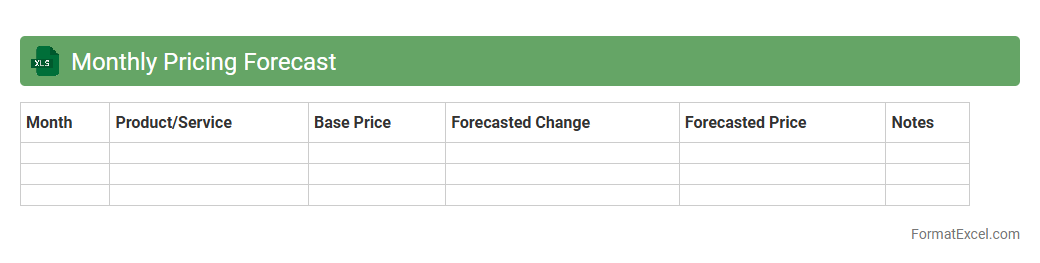
The
Monthly Pricing Forecast Excel document provides detailed projections of product or service prices over the upcoming months based on historical data and market trends. It enables businesses to anticipate cost fluctuations, optimize budgeting, and make informed purchasing or pricing decisions. Utilizing this tool enhances financial planning accuracy and supports strategic response to market changes.
Monthly ROI Forecast
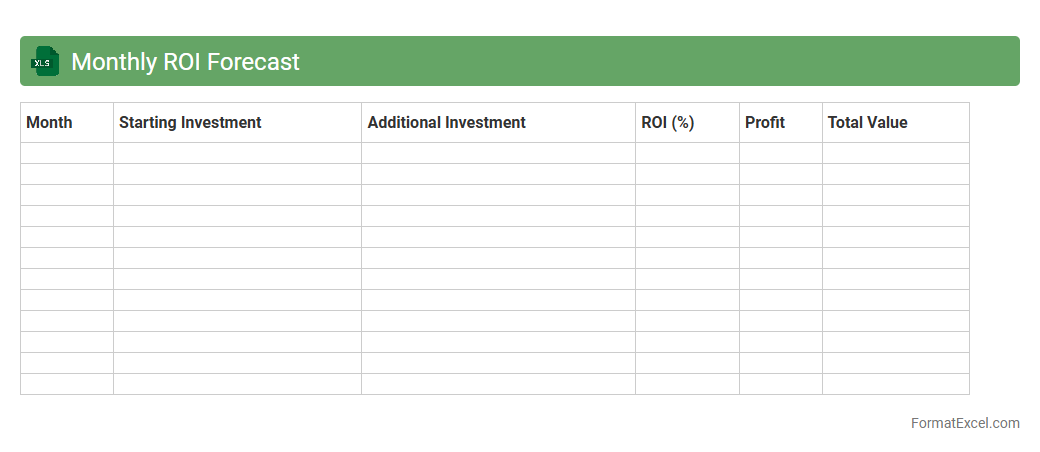
The
Monthly ROI Forecast Excel document is a financial tool designed to project the expected return on investment over each month, integrating key variables such as revenue, expenses, and growth rates. By analyzing historical data and future assumptions, this document helps businesses make informed decisions, optimize budget allocation, and forecast profitability. It supports strategic planning by providing clear insights into how investments will perform, minimizing risks, and enhancing financial management efficiency.
Monthly Accounts Receivable Forecast
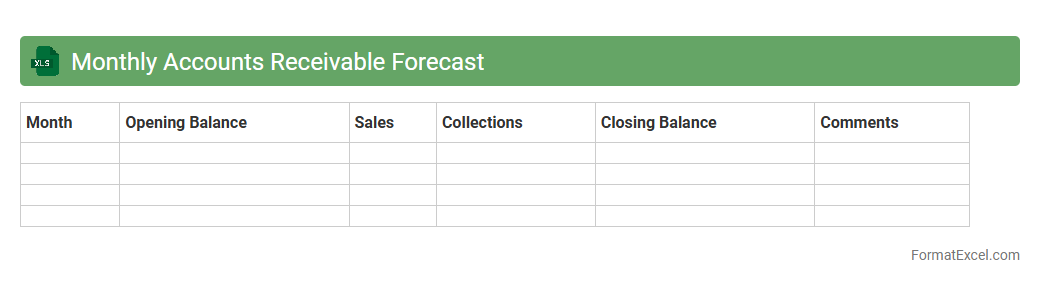
The
Monthly Accounts Receivable Forecast Excel document is a financial tool designed to project outstanding customer payments over a specific period, enabling businesses to anticipate cash inflows accurately. It helps in managing cash flow efficiently by tracking due payments, identifying potential collection issues, and planning budgeting or funding needs accordingly. Utilizing this forecast improves decision-making related to credit policies and operational expenses by providing a clear, data-driven view of expected receivables.
Introduction to Monthly Forecast Format in Excel
The monthly forecast format in Excel is a structured template used to predict financial and operational metrics for each month. It allows businesses to plan budgets, track performance, and make informed decisions. Excel's flexibility makes it an ideal tool for creating customizable forecasting models.
Importance of Accurate Forecasting
Accurate forecasting is crucial for budgeting and resource allocation, reducing financial risks. It helps organizations anticipate market trends and adjust strategies proactively. Reliable forecasting enhances decision-making and overall business performance.
Key Components of a Monthly Forecast Template
A well-designed template includes sections for revenue, expenses, profits, and key performance indicators. It often features time-based columns for each month and rows categorizing various financial elements. Incorporating key components ensures comprehensive data capture and analysis.
Setting Up Your Excel Workbook
Begin by creating separate sheets for raw data, calculations, and dashboard visuals. Naming conventions and structured tables improve navigation and data integrity. Proper workbook setup lays the foundation for an effective forecasting process.
Designing the Layout for Clarity
Organize data logically with clear headings, consistent fonts, and color-coded sections. Use merged cells and borders to differentiate categories and totals. A clean layout enhances readability and minimizes errors in the forecast format.
Essential Formulas for Monthly Forecasts
Utilize formulas like SUM, IF, and VLOOKUP to automate calculations and data retrieval. Advanced functions such as OFFSET and INDEX can handle dynamic ranges. Mastering essential formulas increases efficiency and accuracy.
Steps to Input and Organize Data
Collect historical data and enter it consistently to maintain accuracy. Validate inputs and categorize entries to align with forecasting goals. Systematic data input and organization leads to reliable forecast outputs.
Tips for Customizing Your Forecast Format
Adapt templates to reflect your specific business model and reporting needs. Incorporate drop-down lists and conditional formatting for user-friendly customization. Tailoring the forecast format boosts relevance and usability.
Visualizing Data with Excel Charts
Use line graphs, bar charts, and pie charts to represent trends and distributions effectively. Visual elements help stakeholders interpret forecast data quickly. Implementing visualization improves communication of insights.
Best Practices for Updating and Sharing Forecasts
Regularly update forecasts with new data to reflect changing conditions accurately. Use cloud storage or collaboration tools for efficient sharing and version control. Following best practices ensures transparency and ongoing relevance.