Headcount Projection
A
Headcount Projection Excel document forecasts future staffing needs by analyzing current employee data, turnover rates, and business growth trends. It helps organizations plan budgets, allocate resources efficiently, and align workforce capacity with strategic goals. This tool enhances decision-making by providing clear visibility into hiring requirements and potential staffing gaps over specific periods.
Attrition Rate Analysis
Attrition Rate Analysis Excel document is a powerful tool that tracks employee turnover by calculating the percentage of employees who leave an organization over a specific period. This analysis helps HR professionals identify trends in employee departure, enabling data-driven decisions to improve retention strategies and reduce costs related to recruitment and training. Using this document enhances workforce planning and supports sustained organizational growth through effective human resource management.
New Hire Planning
The
New Hire Planning Excel document is a strategic tool designed to organize and manage employee onboarding schedules, roles, and budget allocations effectively. It streamlines the recruitment process by maintaining a clear overview of hiring timelines, headcount goals, and associated costs, enabling better workforce planning and resource management. This document supports HR teams in making data-driven decisions to optimize talent acquisition and ensure smooth integration of new employees.
Turnover Trend Analysis
Turnover Trend Analysis Excel document is a powerful tool designed to track and visualize employee turnover rates over specific periods, helping organizations identify patterns and underlying causes of staff attrition. By leveraging data such as monthly turnover percentages, department-specific exits, and tenure breakdowns, businesses can pinpoint critical areas needing retention strategies and forecast future workforce changes. This analysis supports informed decision-making to enhance employee satisfaction and reduce costly turnover, making
Turnover Trend Analysis essential for HR management and organizational growth.
Succession Planning
A
Succession Planning Excel document is a structured spreadsheet used to identify and develop internal talent to fill key leadership positions within an organization. It helps track employee skills, potential successors, and development plans, ensuring business continuity and minimizing disruptions. This tool streamlines workforce planning by providing clear visibility into future leadership gaps and readiness.
Internal Mobility Tracking
An
Internal Mobility Tracking Excel document is a tool used to monitor and analyze employee movements within an organization, including promotions, lateral transfers, and role changes. It provides valuable insights into workforce dynamics, talent development, and succession planning. This document helps HR teams identify skill gaps, improve employee retention, and streamline internal recruitment processes.
Retirement Forecast
A
Retirement Forecast Excel document is a financial planning tool designed to estimate future retirement savings and income based on current data and assumptions such as contribution rates, investment growth, and inflation. It helps users model different scenarios to understand how various factors impact their retirement readiness, allowing for informed decisions about saving and spending habits. This forecast enables proactive adjustments to retirement strategies, ensuring a more secure financial future.
Seasonal Staffing Needs
The
Seasonal Staffing Needs Excel document is a strategic tool designed to manage workforce requirements during peak and off-peak times efficiently. It helps businesses forecast labor demands based on historical data and seasonal trends, ensuring optimal staff allocation. Utilizing this document reduces overstaffing costs and minimizes understaffing risks, enhancing overall operational productivity.
Workforce Demand Planning
A
Workforce Demand Planning Excel document is a strategic tool designed to forecast staffing needs based on business goals, market trends, and operational data. It helps organizations optimize labor costs, prevent overstaffing or understaffing, and align workforce capacity with project demands. By analyzing historical data and predictive models, this document enables precise resource allocation and supports better decision-making in human capital management.
Job Requisition Tracking
A
Job Requisition Tracking Excel document is a structured tool used to monitor and manage the recruitment process by recording details such as job titles, requisition numbers, hiring managers, status updates, and candidate progress. It enhances organizational efficiency by providing a centralized overview of all open positions, enabling HR teams to streamline communication, prioritize tasks, and ensure timely hiring decisions. This tracking system also supports data-driven recruitment strategies through easy customization and real-time updates within the spreadsheet.
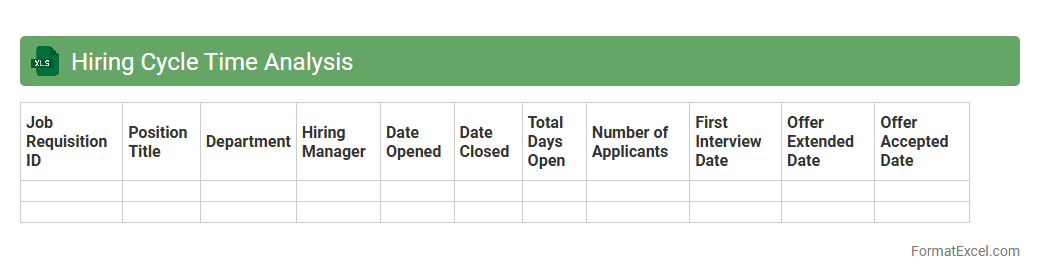
Hiring Cycle Time Analysis
Hiring Cycle Time Analysis document enables better resource allocation, enhances candidate experience, and supports strategic workforce planning.Employee Tenure Analysis
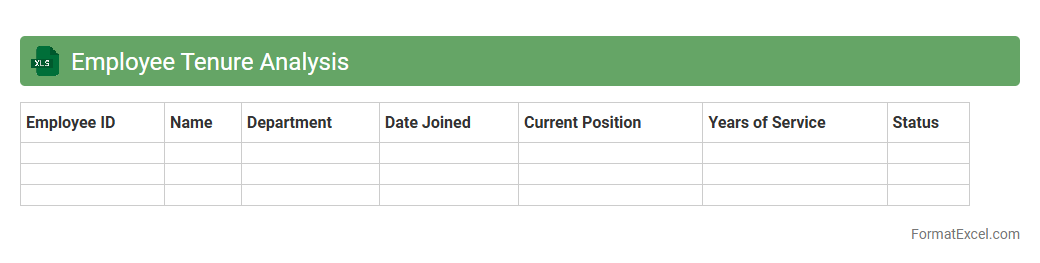
Employee Tenure Analysis Excel document is a powerful tool designed to track and evaluate the length of time employees have stayed within an organization. It provides critical insights into workforce stability, helps identify trends in employee retention or turnover, and supports data-driven decision-making for HR strategies. This analysis enhances
employee retention efforts by pinpointing areas for improvement and fostering a more engaged, long-lasting workforce.
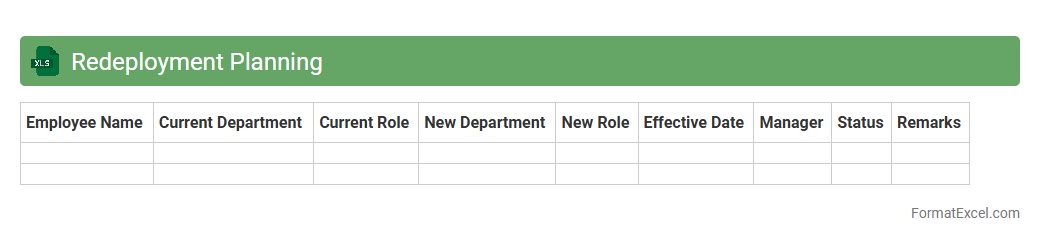
Redeployment Planning
The
Redeployment Planning Excel document is a structured tool designed to efficiently track and manage employee transitions within an organization. It helps identify available roles, match skill sets, and schedule redeployment to minimize downtime and maintain productivity. This document enhances workforce optimization by providing clear visibility into resource allocation and future staffing needs.
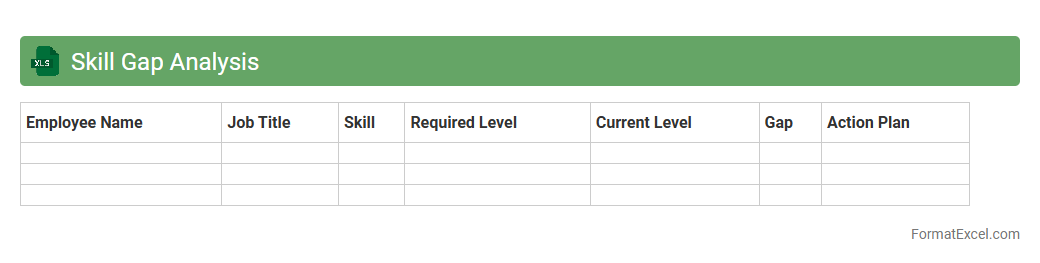
Skill Gap Analysis
A
Skill Gap Analysis Excel document is a structured tool designed to identify the differences between the current skills of employees and the skills required for specific roles or projects. It helps organizations pinpoint areas needing improvement, enabling targeted training programs and resource allocation. By using this analysis, companies can enhance workforce productivity, improve performance, and support strategic planning for talent development.
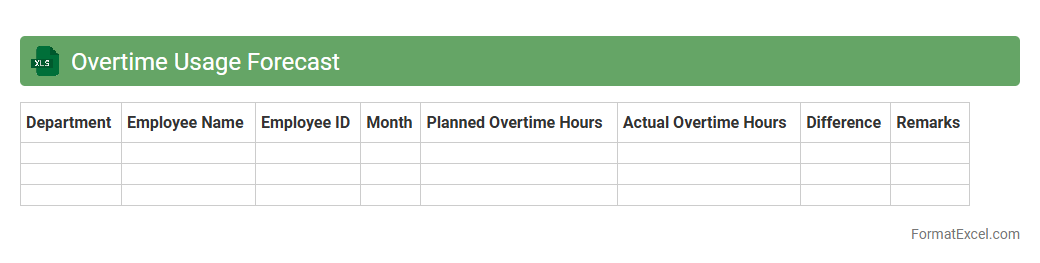
Overtime Usage Forecast
The
Overtime Usage Forecast Excel document is a strategic tool designed to predict and manage employee overtime hours based on historical data and upcoming project demands. It helps organizations optimize labor costs by providing detailed insights into expected overtime trends, enabling better budgeting and workforce planning. By accurately forecasting overtime, businesses can improve resource allocation, reduce unnecessary expenses, and maintain compliance with labor regulations.
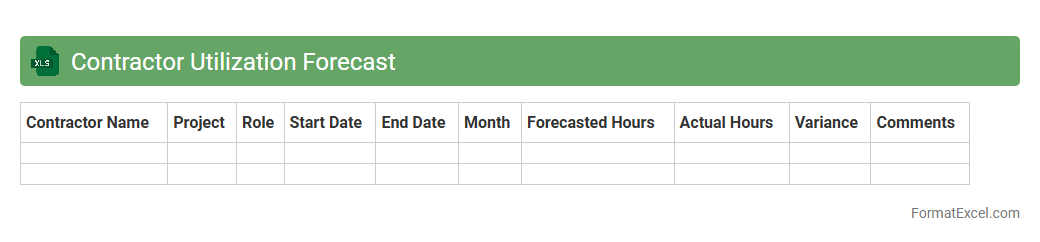
Contractor Utilization Forecast
The
Contractor Utilization Forecast Excel document is a strategic tool designed to project and monitor the allocation of contractor resources over time. By analyzing planned vs. actual contractor hours, it helps organizations optimize workforce management, control labor costs, and ensure projects are adequately staffed. This forecast enhances decision-making by providing clear insights into contractor availability and utilization trends, leading to improved operational efficiency.
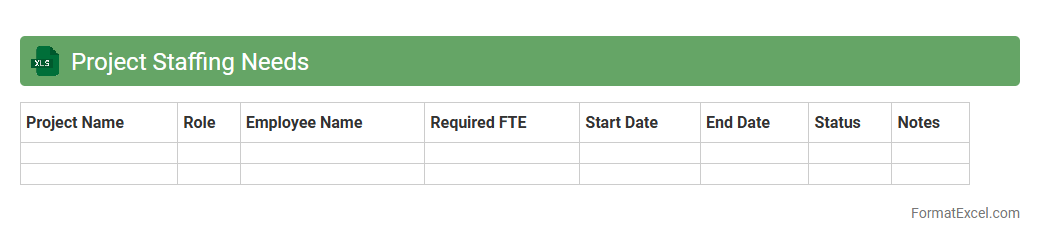
Project Staffing Needs
The
Project Staffing Needs Excel document is a dynamic tool designed to accurately identify and allocate human resources required for specific project phases. It facilitates efficient workforce planning by tracking skill sets, availability, and workload distribution, ensuring optimal team composition aligned with project timelines. Utilizing this document enhances resource management, minimizes bottlenecks, and supports strategic decision-making for successful project execution.
Labor Cost Forecast
The
Labor Cost Forecast Excel document is a financial tool designed to estimate future labor expenses by analyzing variables such as employee hours, wage rates, and overtime projections. It enables businesses to budget accurately, control costs, and optimize workforce planning by providing visibility into anticipated labor expenditures. Utilizing this forecast helps prevent budget overruns and supports strategic decision-making in human resource management.
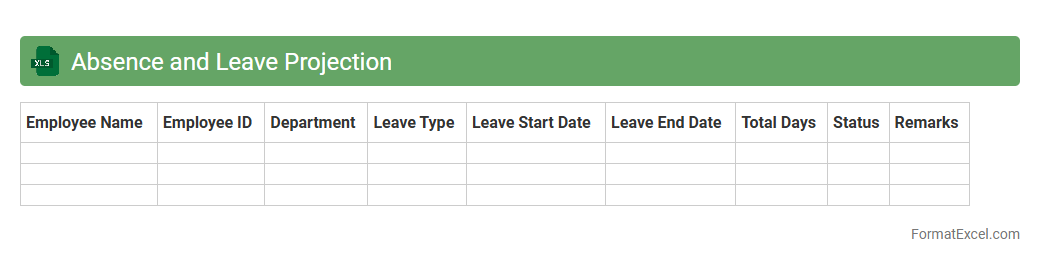
Absence and Leave Projection
An
Absence and Leave Projection Excel document is a specialized tool designed to track, forecast, and manage employee absences and leave schedules efficiently. It helps organizations anticipate staffing gaps, plan workloads, and ensure adequate coverage by analyzing historical leave data and projecting future absences. Utilizing this document improves operational planning and supports effective human resource management.
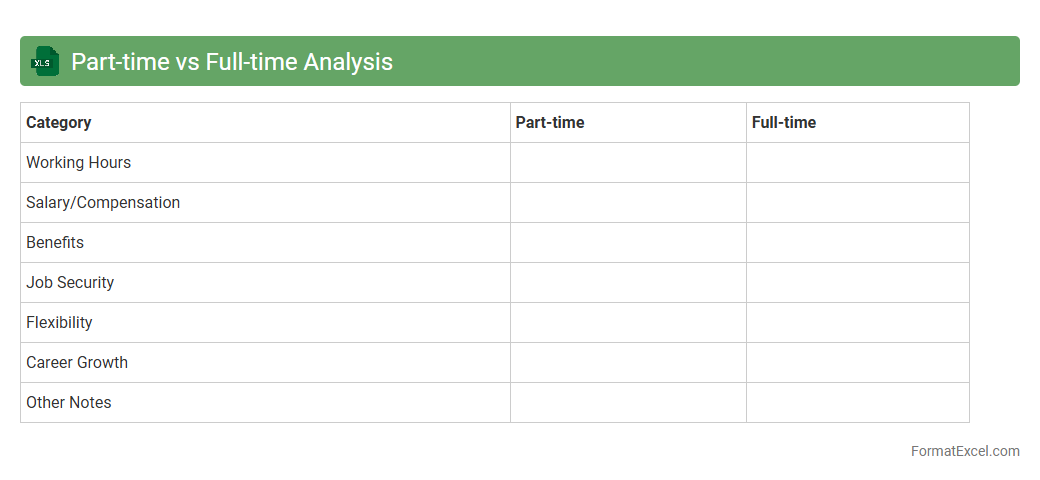
Part-time vs Full-time Analysis
The
Part-time vs Full-time Analysis Excel document is a structured tool designed to compare and evaluate the performance, costs, and productivity of part-time versus full-time employees within an organization. It helps in making data-driven decisions by providing clear insights into labor allocation, cost efficiency, and workforce planning. Utilizing this analysis enables businesses to optimize staffing strategies, control payroll expenses, and improve overall operational effectiveness.
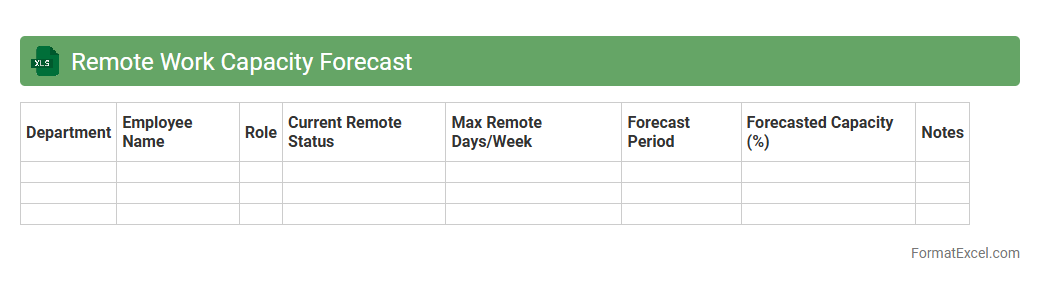
Remote Work Capacity Forecast
The
Remote Work Capacity Forecast Excel document provides a detailed projection of an organization's remote workforce capabilities, including staffing levels, resource allocation, and productivity metrics. It helps businesses anticipate demand fluctuations, optimize employee scheduling, and ensure sufficient support for remote operations. Utilizing this forecast enhances decision-making by enabling accurate capacity planning and improving overall operational efficiency in a remote work environment.
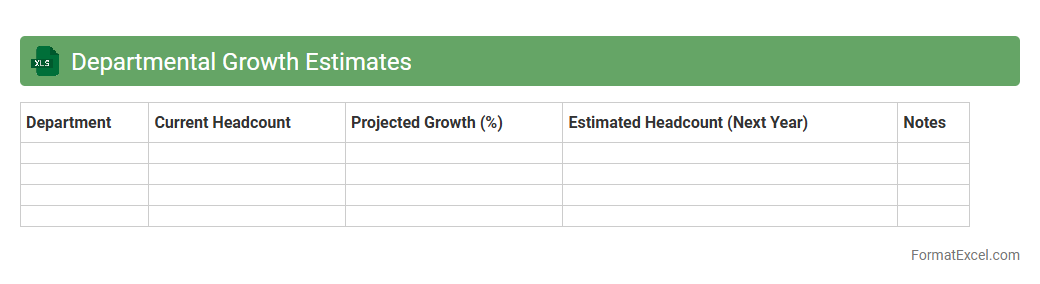
Departmental Growth Estimates
The
Departmental Growth Estimates Excel document is a crucial tool for forecasting and analyzing the growth trends of various departments within an organization. It compiles historical performance data, projected metrics, and key performance indicators to provide a clear picture of expected departmental progress. This document helps management make informed decisions, allocate resources efficiently, and set realistic targets for each department's growth trajectory.
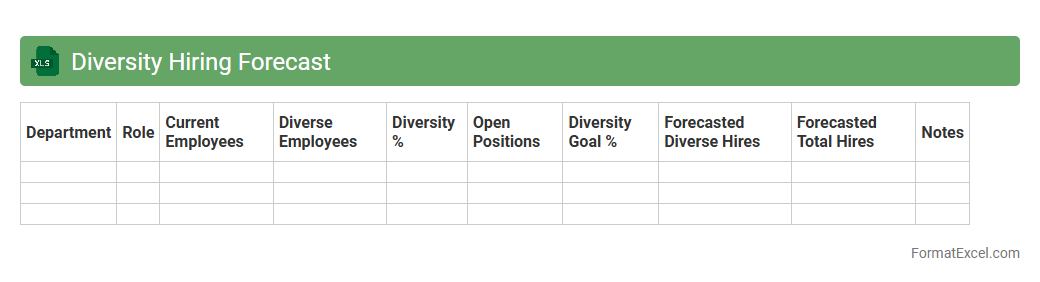
Diversity Hiring Forecast
The
Diversity Hiring Forecast Excel document is a strategic tool designed to analyze and predict hiring trends related to workforce diversity within an organization. It helps HR teams identify gaps in diversity metrics, set measurable recruitment goals, and track progress over time using data-driven insights. This document enhances the ability to create inclusive hiring practices by providing clear visualizations and forecasts that support equitable talent acquisition decisions.
Productivity Impact Forecast
The
Productivity Impact Forecast Excel document is a powerful tool designed to analyze and predict the effects of various factors on workplace productivity. It enables users to input data related to employee performance, operational changes, and market trends, providing a clear forecast of productivity outcomes. This tool is essential for informed decision-making, helping organizations optimize resource allocation and improve overall efficiency.
Promotion Rate Projection
The
Promotion Rate Projection Excel document is a powerful tool designed to forecast employee promotion rates within an organization over a specified period. By analyzing historical promotion data and key performance indicators, it helps HR professionals and managers identify trends and make informed decisions regarding talent development and succession planning. This projection enables better workforce planning, budget allocation, and enhances overall organizational growth strategies.
Introduction to Workforce Forecasting in Excel
Workforce forecasting involves predicting future staffing needs to align with business goals. Using Excel leverages its powerful data analysis and visualization tools to create effective workforce plans. This approach allows for dynamic updates and scenario planning with ease.
Key Components of a Workforce Forecast Format
A typical workforce forecast format includes employee demographics, roles, turnover rates, and hiring plans. It integrates historical data alongside projected business demands to estimate staffing requirements. The data structure must be clear to enable accurate analysis and adjustments.
Benefits of Using Excel for Workforce Forecast
Excel offers flexibility, accessibility, and advanced formulas essential for workforce forecasting. It supports pivot tables, charts, and what-if analysis, making it ideal for visualizing trends. Using Excel's features streamlines workforce planning and enhances decision-making.
Essential Data Sources for Accurate Forecasting
Accurate forecasting requires data from HR records, business growth projections, and market trends. Integrating employee performance metrics and attrition rates improves forecast reliability. The quality of data directly impacts forecast precision and strategic outcomes.
Step-by-Step Guide to Creating a Forecast Template
Start by defining your forecast objectives and gathering relevant data. Next, organize data into structured tables, apply formulas for calculations, and insert charts for visual interpretation. The template design should facilitate easy updates and scenario analysis.
Recommended Excel Functions for Workforce Forecasting
Key Excel functions include SUMIFS, VLOOKUP/XLOOKUP, IF statements, and forecasting tools like TREND and FORECAST. These functions enable dynamic data manipulation and predictive analytics within your template. Mastering these functions enhances forecasting accuracy and flexibility.
Customizing Workforce Forecast Templates
Templates should be adaptable to reflect specific organizational structures and business cycles. Customization includes adding conditional formatting, dropdown menus, and tailored metrics. Personalizing the template ensures relevance and better user engagement.
Best Practices for Data Visualization in Forecasts
Use clear, concise charts and dashboards to summarize complex data effectively. Prioritize bar graphs, line charts, and heat maps to highlight trends and potential gaps. Strong visualization techniques support faster interpretation and informed decision-making.
Common Pitfalls to Avoid in Excel Workforce Forecasts
Avoid relying on incomplete or outdated data, which can skew forecasts significantly. Overcomplicating formulas and ignoring error-checking can lead to misinterpretations. Maintaining data integrity and simplicity is crucial for reliable forecasts.
Downloadable Workforce Forecast Excel Template
Access a ready-to-use workforce forecast Excel template to jumpstart your planning process. This template is pre-built with essential formulas and visualization tools for convenience. Utilize the downloadable resource to save time and improve forecast accuracy.