Sales Analysis Report
A
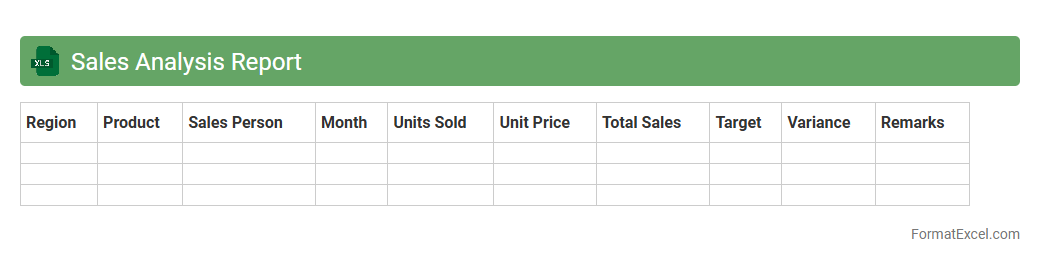
Sales Analysis Report Excel document organizes and visualizes sales data, enabling businesses to track performance metrics such as revenue trends, product sales, and customer behavior. It helps identify best-selling products, seasonal patterns, and areas needing improvement, facilitating data-driven decision-making. This report enhances forecasting accuracy and strategic planning by consolidating complex data into clear, actionable insights.
Inventory Status Report
An
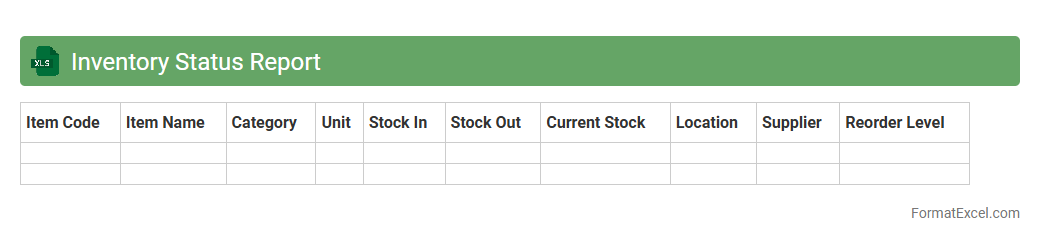
Inventory Status Report Excel document organizes real-time data on stock levels, product availability, and reorder points, enabling efficient inventory management. It helps businesses track quantities, identify slow-moving items, and forecast demand to minimize stockouts or overstock situations. By providing clear insights into inventory health, the report supports informed decision-making and enhances overall supply chain efficiency.
Purchase Summary Report
A
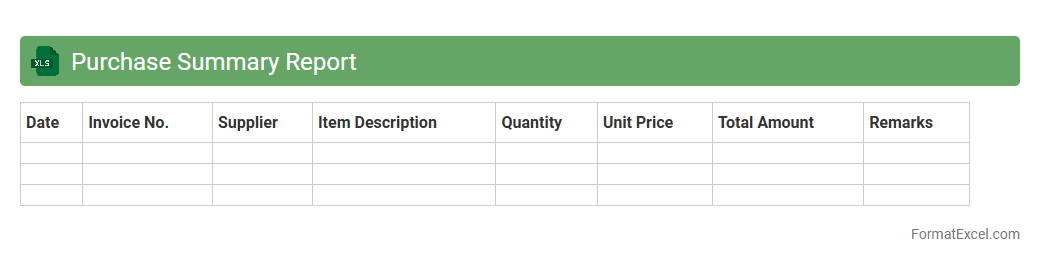
Purchase Summary Report Excel document consolidates all purchasing transactions into a structured format, highlighting key data such as vendor names, purchase dates, quantities, and total costs. It enables businesses to track expenditure patterns, analyze supplier performance, and optimize budgeting decisions. This report is essential for maintaining transparency in financial operations and enhancing procurement efficiency.
Employee Attendance Report
An
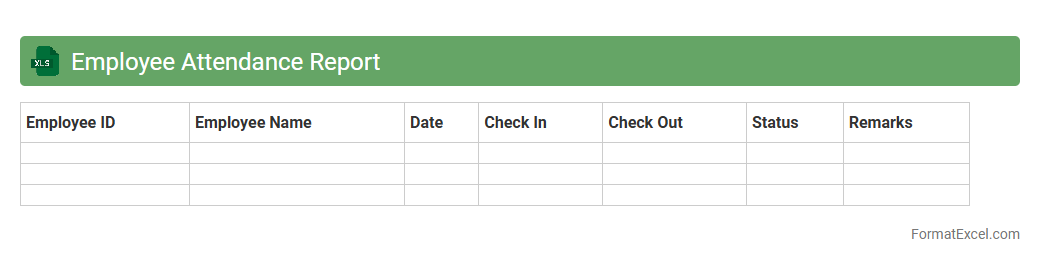
Employee Attendance Report Excel document is a structured spreadsheet used to track and monitor the daily attendance, working hours, and leave records of employees in an organization. It provides clear visibility into employee punctuality, absenteeism, and overtime, enabling HR and management to make informed decisions regarding payroll, performance evaluation, and workforce planning. By maintaining accurate attendance data, businesses can enhance productivity, ensure compliance with labor regulations, and streamline administrative tasks.
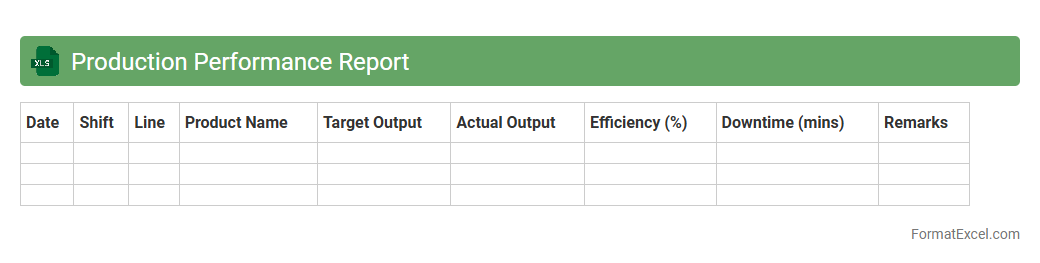
Production Performance Report
The
Production Performance Report Excel document organizes and analyzes manufacturing data to track efficiency, output, and quality metrics. It enables management to identify production bottlenecks, monitor workforce productivity, and optimize resource utilization. This report serves as a critical tool for making data-driven decisions that enhance operational performance and reduce costs.
Customer Feedback Report
A
Customer Feedback Report Excel document is a structured file that collects and organizes customer opinions, ratings, and comments in a clear, analyzable format. It helps businesses identify trends, measure customer satisfaction, and pinpoint areas needing improvement by consolidating quantitative and qualitative feedback. Using this report enables data-driven decision-making to enhance products, services, and overall customer experience.
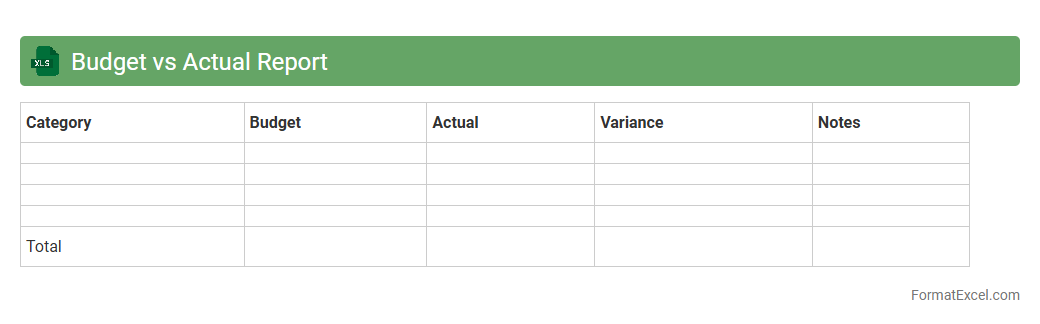
Budget vs Actual Report
A
Budget vs Actual Report Excel document compares planned financial figures against actual spending or revenue to monitor business performance effectively. It helps identify variances, control costs, and improve financial forecasting accuracy by highlighting areas where the budget was exceeded or underspent. This report enables better decision-making, ensuring resources are allocated efficiently to meet organizational goals.
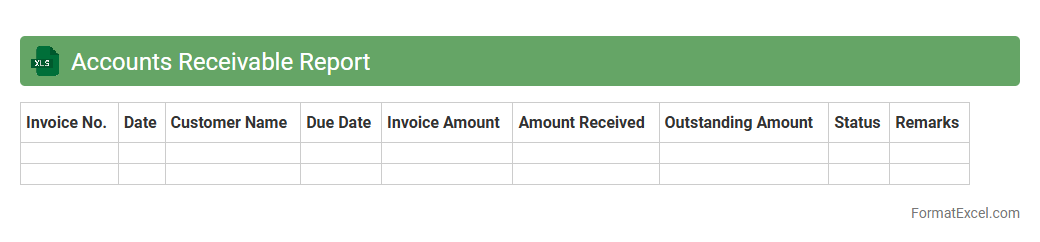
Accounts Receivable Report
An
Accounts Receivable Report Excel document tracks outstanding customer invoices and payments, providing a clear overview of money owed to a business. It helps manage cash flow by identifying overdue accounts and prioritizing collections, ensuring timely revenue recognition. This report also supports financial analysis, forecasting, and maintaining healthy customer credit relationships.
Accounts Payable Report
An
Accounts Payable Report Excel document tracks all outstanding bills and invoices a company owes to its suppliers or vendors. It enables efficient management of payment schedules, cash flow forecasting, and identification of overdue payments to maintain strong supplier relationships. By providing a clear overview of liabilities, this report supports accurate financial reporting and budgeting decisions.
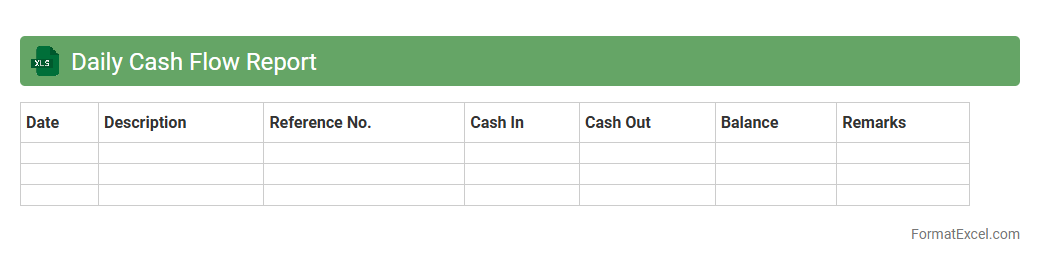
Daily Cash Flow Report
A
Daily Cash Flow Report Excel document tracks the inflow and outflow of cash on a daily basis, providing a clear overview of a business's liquidity status. This report helps monitor cash availability, forecast short-term financial needs, and prevent cash shortages. Utilizing this tool enhances decision-making by ensuring accurate, real-time financial data is accessible for managing operational expenses and investments.
Order Processing Report
An
Order Processing Report Excel document systematically tracks and manages customer orders, including order status, quantities, and delivery timelines. It enhances operational efficiency by providing real-time visibility into order fulfillment, helping identify bottlenecks and ensuring timely shipment. This report aids decision-making by consolidating vital order data into clear, actionable insights for inventory control and customer service.
Expense Tracking Report
An
Expense Tracking Report Excel document systematically records and categorizes all financial expenditures, enabling clear visibility into spending patterns. It helps individuals and businesses monitor budgets, control costs, and identify areas for financial optimization. By providing detailed insights and organized data, this tool supports informed decision-making and improved fiscal management.
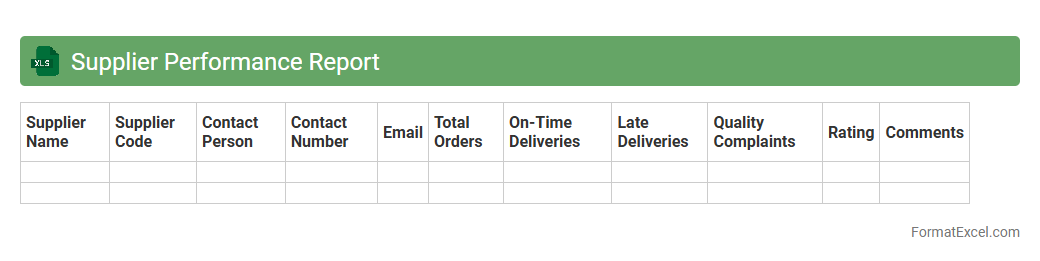
Supplier Performance Report
A
Supplier Performance Report Excel document tracks and evaluates key metrics such as delivery time, quality compliance, and cost efficiency of suppliers. It helps organizations identify reliable vendors, address performance issues, and make data-driven decisions to optimize procurement processes. Using this report enhances supplier relationships and drives continuous improvement in supply chain management.
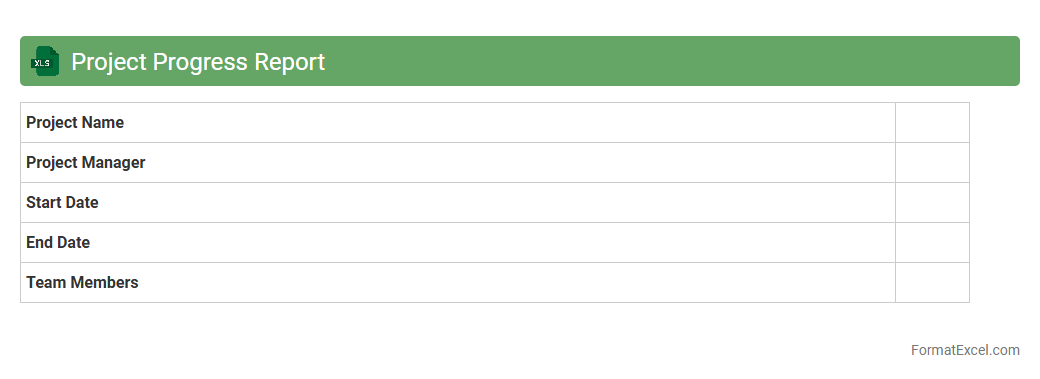
Project Progress Report
A
Project Progress Report Excel document is a structured spreadsheet designed to track and visualize the status, milestones, tasks, and overall progress of a project. It enables project managers and team members to monitor deadlines, resource allocation, and key performance indicators, ensuring timely completion and efficient workflow management. This tool improves communication, accountability, and decision-making by providing clear, real-time insights into project development stages.
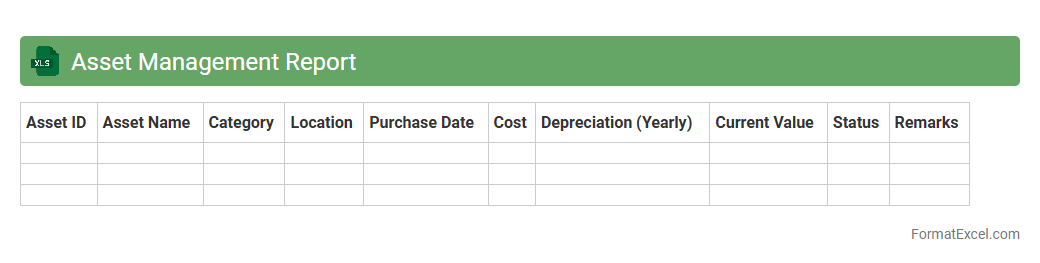
Asset Management Report
An
Asset Management Report Excel document systematically tracks and organizes financial and physical assets, enabling efficient monitoring and management. It provides detailed insights into asset acquisition, depreciation, maintenance schedules, and valuation, which aids in informed decision-making and regulatory compliance. Using this report enhances transparency, optimizes asset utilization, and supports strategic planning to maximize return on investment.
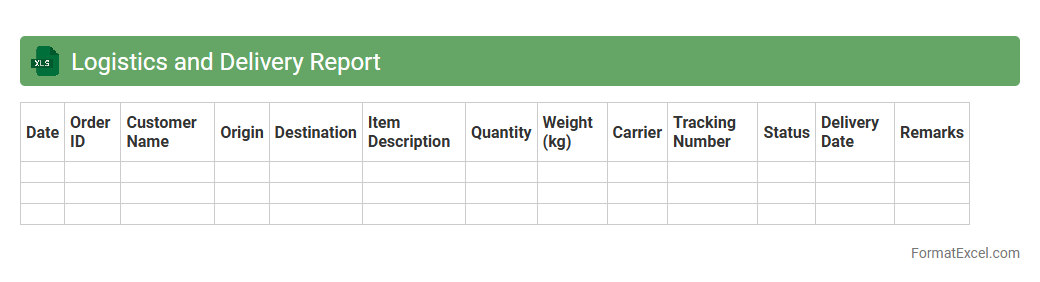
Logistics and Delivery Report
The
Logistics and Delivery Report Excel document is a structured file used to track and manage shipping schedules, inventory levels, delivery statuses, and carrier information. It helps businesses analyze delivery performance, identify bottlenecks, and optimize transportation routes for cost efficiency. By consolidating data in one place, this report supports informed decision-making and enhances supply chain transparency.
Quality Control Report
A
Quality Control Report Excel document is a structured tool used to record, analyze, and monitor product or service quality metrics during production or operational processes. It helps identify defects, track compliance with standards, and ensures consistent quality by providing visual charts and statistical data analysis. This document streamlines decision-making by presenting clear quality performance indicators, enabling timely corrective actions and continuous improvement.
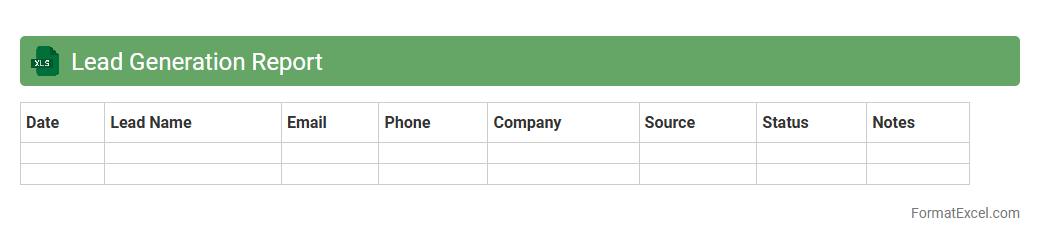
Lead Generation Report
A
Lead Generation Report Excel document systematically organizes potential customer data, tracking sources, contact information, and engagement metrics to evaluate sales prospects. This report helps businesses identify the most effective marketing channels, optimize lead nurturing strategies, and forecast sales performance. By analyzing trends in lead acquisition and conversion rates, companies can increase efficiency in targeting high-quality leads and ultimately boost revenue growth.
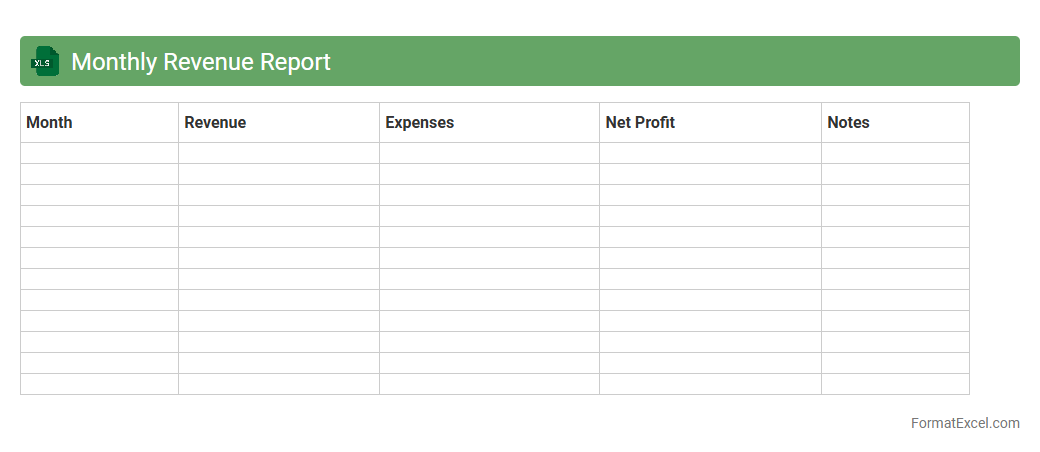
Monthly Revenue Report
A
Monthly Revenue Report Excel document tracks an organization's income over a specific month, detailing sales, returns, and net revenue to provide clear financial visibility. This report helps businesses analyze performance trends, identify growth opportunities, and make informed budgeting decisions. By organizing data systematically, it enables efficient comparison across different periods, ensuring better financial planning and forecasting accuracy.
Cost Analysis Report
A
Cost Analysis Report Excel document systematically organizes and evaluates expenses to identify cost-saving opportunities and improve budgeting accuracy. It enables businesses to track financial performance by categorizing costs, comparing actual vs. projected expenses, and highlighting areas of overspending. This detailed financial insight supports informed decision-making and enhances overall project or operational efficiency.
Branch Performance Report
The
Branch Performance Report Excel document consolidates key metrics such as sales, customer feedback, and operational efficiency across multiple branches in a structured format. This report enables management to quickly identify high-performing locations and areas needing improvement, facilitating data-driven decision-making. By tracking performance trends over time, businesses can optimize resource allocation and implement targeted strategies to enhance overall branch productivity.
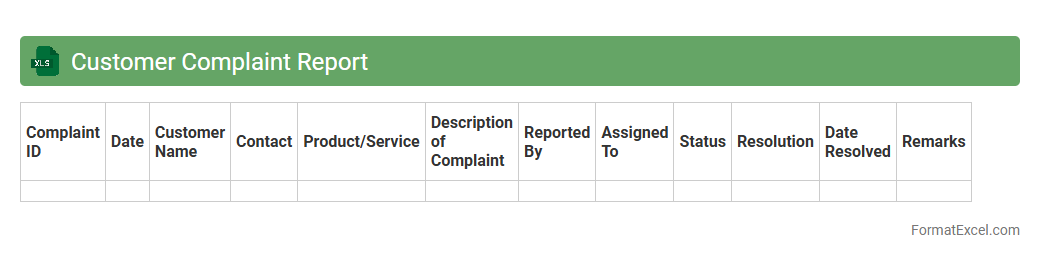
Customer Complaint Report
A
Customer Complaint Report Excel document is a structured tool designed to record, track, and analyze customer grievances efficiently. It helps businesses identify recurring issues, monitor resolution times, and improve overall customer satisfaction by providing clear insights into product or service shortcomings. Utilizing this report enhances decision-making processes and supports continuous quality improvement.
Resource Allocation Report
A
Resource Allocation Report Excel document tracks and visualizes the distribution of resources such as time, personnel, and budget across projects or tasks. It helps identify overallocated or underutilized resources, enabling efficient workload balancing and project planning. By providing clear insights into resource availability and utilization, this report supports informed decision-making and optimized project delivery.
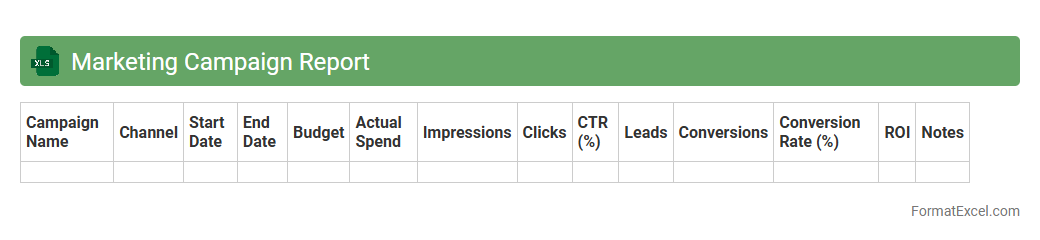
Marketing Campaign Report
A
Marketing Campaign Report Excel document organizes and analyzes data from marketing efforts, including metrics like impressions, click-through rates, conversions, and ROI. It enables marketers to track the performance of multiple campaigns simultaneously, identify trends, and make data-driven decisions to optimize strategies. This report helps increase efficiency by highlighting which channels and tactics generate the best results and where budget adjustments are necessary.
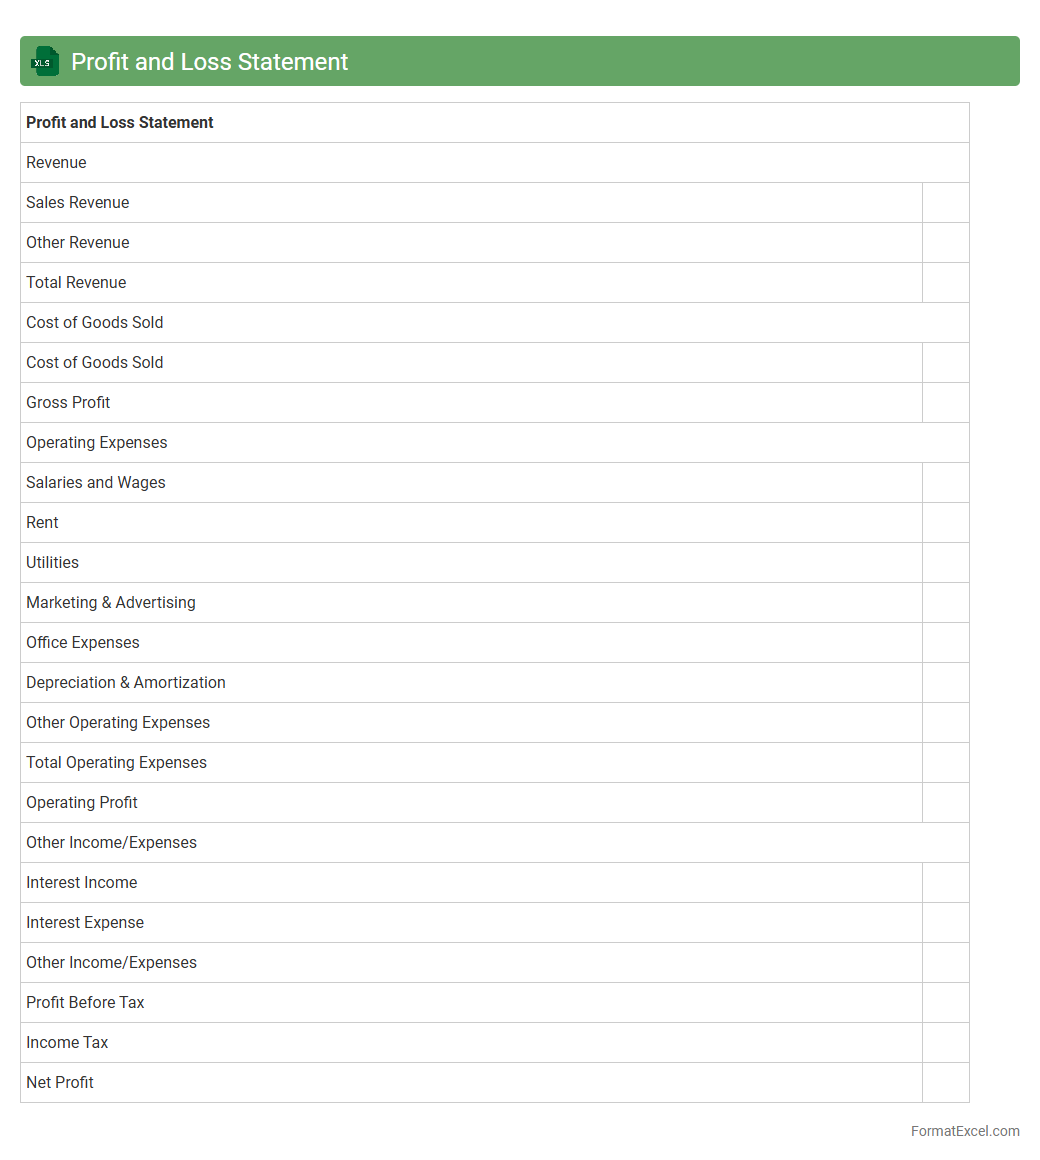
Profit and Loss Statement
A
Profit and Loss Statement Excel document is a financial report that summarizes revenues, costs, and expenses incurred during a specific period, enabling businesses to assess their profitability. It provides a clear overview of income and expenditure patterns, helping users make informed decisions about budgeting, forecasting, and resource allocation. By using this Excel sheet, companies can efficiently track financial performance and identify areas for cost optimization.
Introduction to MIS Report Format in Excel
An MIS report in Excel is a structured document used to summarize business data for effective decision-making. It leverages Excel's versatility to organize, analyze, and present data clearly. Understanding this format is crucial for accurate management information system reporting.
Key Components of an MIS Report
Key components include data tables, charts, summary sections, and performance indicators. Each part plays a vital role in presenting a comprehensive overview of business metrics. Proper layout ensures easy interpretation by stakeholders.
Steps to Create an MIS Report in Excel
Start by gathering relevant data, followed by designing the report layout and entering formulas. Use charts and pivot tables to enhance data visualization and analysis. Finally, review and customize the report to suit business needs.
Essential Excel Functions for MIS Reporting
Functions like SUM, VLOOKUP, IF, and PivotTables are essential for summarizing and analyzing data efficiently. These functions enable dynamic calculations and data manipulation for insightful reporting. Mastery of these tools enhances report accuracy and speed.
Sample MIS Report Template Structure
A typical MIS report template includes headers, data entry sections, summary tables, and visual charts. The structure provides a clear flow from raw data to actionable insights, ensuring organized presentation. Templates help maintain consistency across reporting periods.
Best Practices for Formatting MIS Reports
Use consistent fonts, colors, and alignments to improve readability and professionalism. Highlight key metrics with bold or color coding to emphasize important data. Avoid clutter by using white space and grouping related information effectively.
Common Errors in Excel MIS Reporting
Frequent mistakes include incorrect formulas, inconsistent data entry, and poorly designed layouts. These errors can lead to misleading conclusions and impact business decisions negatively. Ensuring formula integrity and data validation is critical for accuracy.
Tips for Automating MIS Reports in Excel
Automation techniques include using macros, VBA scripts, and dynamic formulas to reduce manual effort. Automation speeds up report generation and minimizes human error. Regularly updating automation scripts enhances report reliability.
Customizing MIS Reports for Different Departments
Tailor MIS reports by including department-specific metrics and visualizations. Customization ensures each department receives relevant information to support their unique objectives. Adaptable reports improve cross-departmental communication and performance tracking.
Downloadable MIS Report Format Examples in Excel
Access free downloadable MIS report templates to jumpstart your reporting process. These examples provide practical formats and formulas for various industries. Utilizing templates saves time and enhances the quality of your reports.