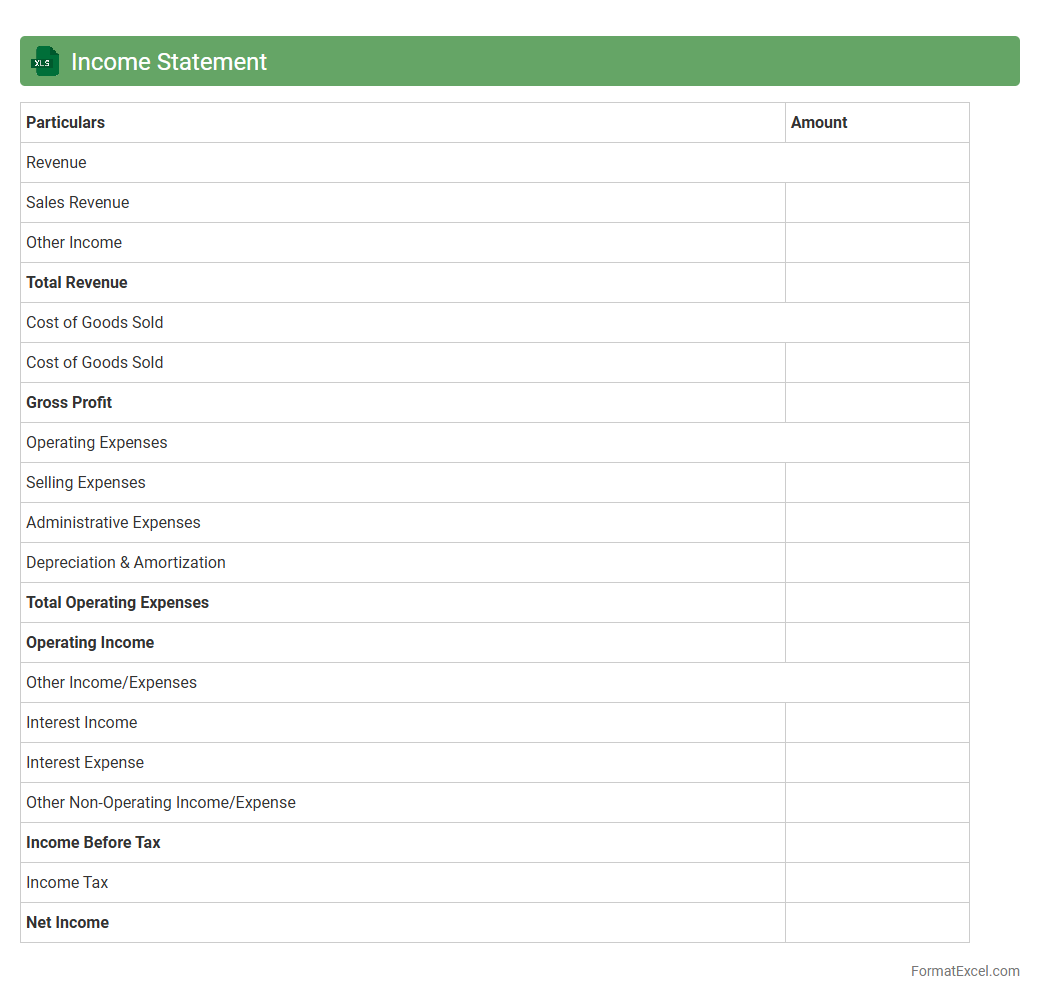
Income Statement
An
Income Statement Excel document is a financial report template used to record and analyze a company's revenues, expenses, and profits over a specific period. It helps businesses track financial performance, assess profitability, and make informed decisions based on accurate data visualization and calculations. Utilizing this tool enhances budgeting accuracy and supports strategic planning by offering clear insights into fiscal health.
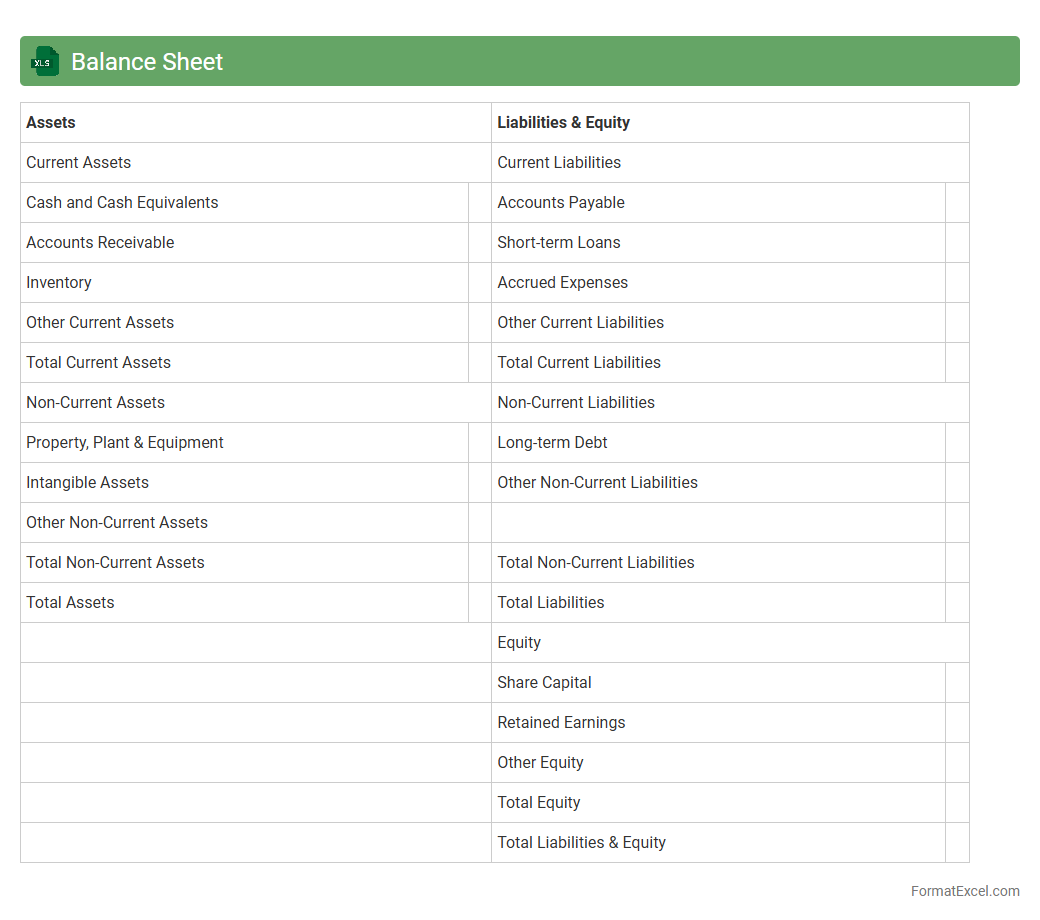
Balance Sheet
A
Balance Sheet Excel document is a structured financial statement that organizes a company's assets, liabilities, and equity in a clear and accessible spreadsheet format. It allows for real-time data entry, automatic calculations, and easy updates, enabling accurate tracking of financial health and ownership stakes. This tool is essential for business owners and accountants to make informed decisions, monitor financial stability, and prepare reports for stakeholders efficiently.
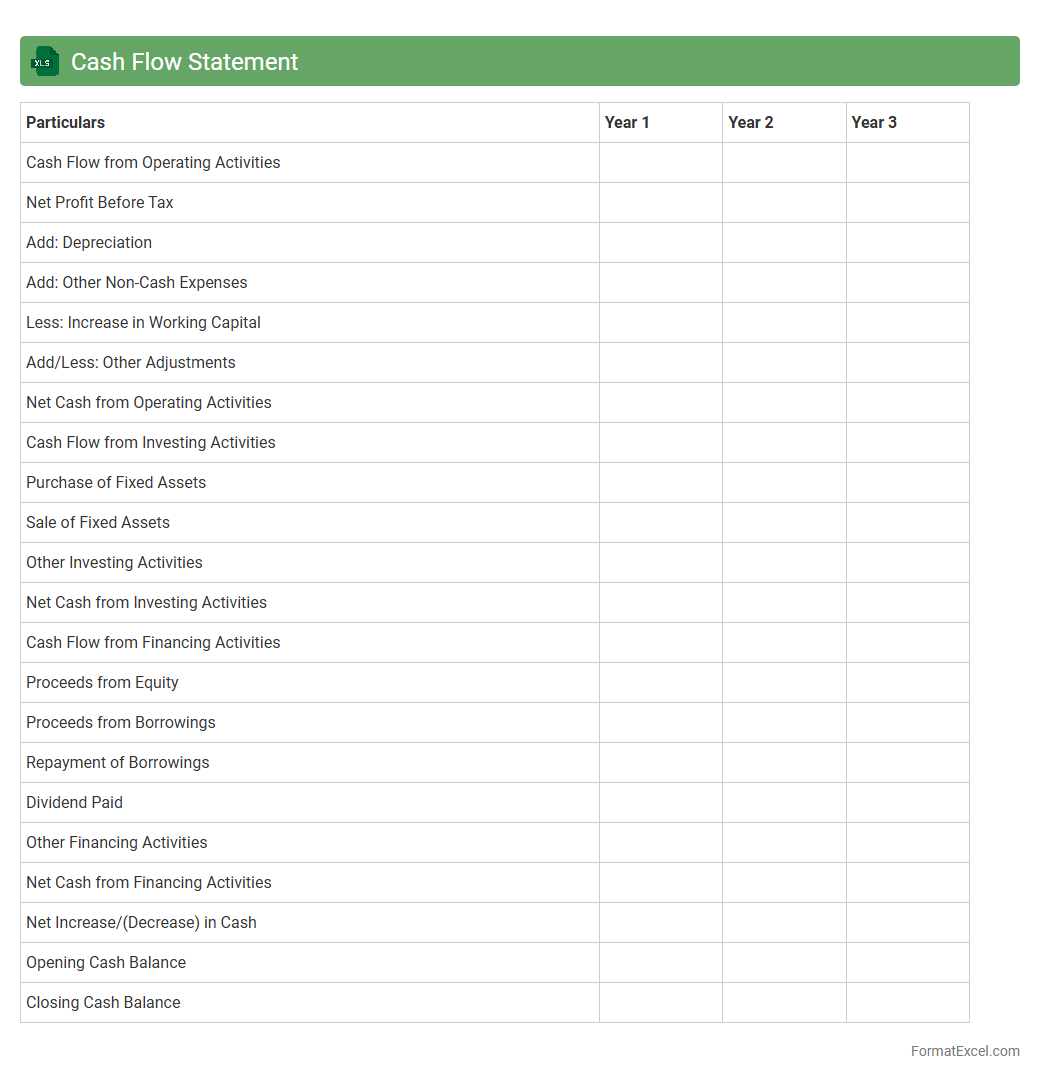
Cash Flow Statement
The
Cash Flow Statement Excel document is a financial tool that records and tracks the inflows and outflows of cash within a business over a specific period. It helps users analyze operational efficiency, manage liquidity, and plan for future financial needs by clearly presenting cash generated from operations, investing, and financing activities. This document is essential for budgeting, forecasting, and making informed decisions that ensure sustainable business growth.
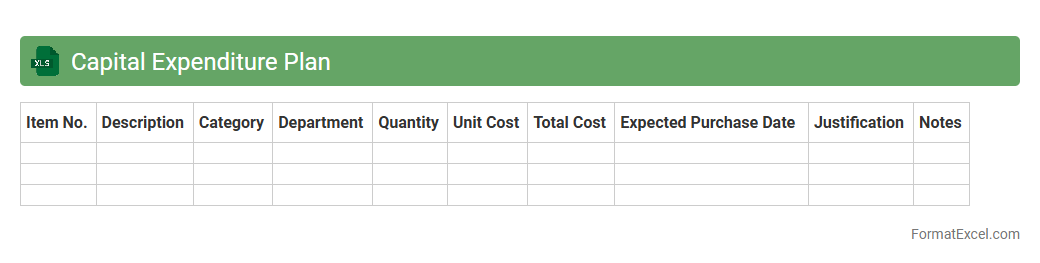
Capital Expenditure Plan
A
Capital Expenditure Plan Excel document is a strategic tool used to outline and manage a company's investments in long-term assets such as property, equipment, and infrastructure. It provides a detailed financial projection, helps track budget allocations, and ensures efficient resource utilization over specified periods. This document is essential for forecasting capital needs, supporting decision-making, and optimizing expenditure to enhance overall business growth and sustainability.
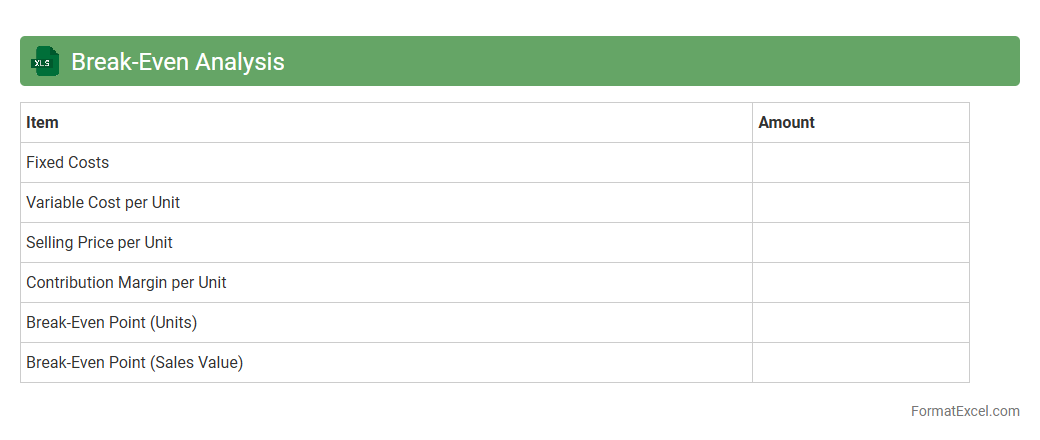
Break-Even Analysis
A
Break-Even Analysis Excel document is a financial tool that helps businesses determine the sales volume at which total revenues equal total costs, indicating no profit or loss. It is useful for identifying the minimum sales target required to avoid losses, aiding in pricing strategies and cost control. This analysis supports decision-making by providing clear insights into fixed costs, variable costs, and contribution margins in an easily customizable spreadsheet format.
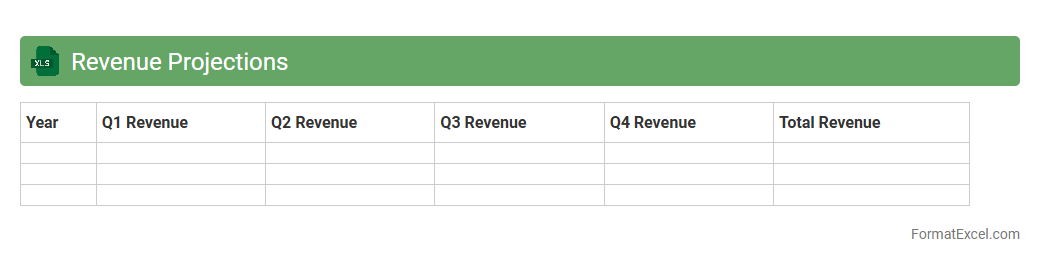
Revenue Projections
A
Revenue Projections Excel document is a financial tool that estimates future income based on historical data, market trends, and sales forecasts. It helps businesses plan budgets, allocate resources efficiently, and set realistic financial goals. By analyzing projected revenue, companies can make informed decisions to optimize growth and profitability.
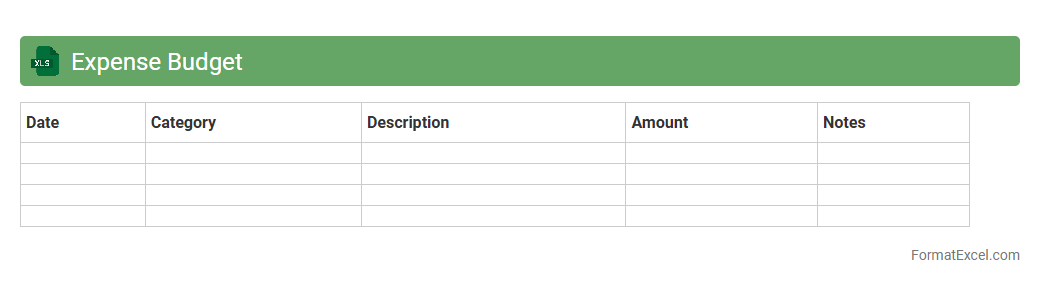
Expense Budget
An
Expense Budget Excel document is a spreadsheet tool designed to track and manage personal or business expenditures efficiently. It enables users to categorize expenses, monitor spending patterns, and compare actual costs against planned budgets for better financial control. This document helps in making informed decisions, reducing unnecessary expenses, and achieving financial goals through systematic budgeting.
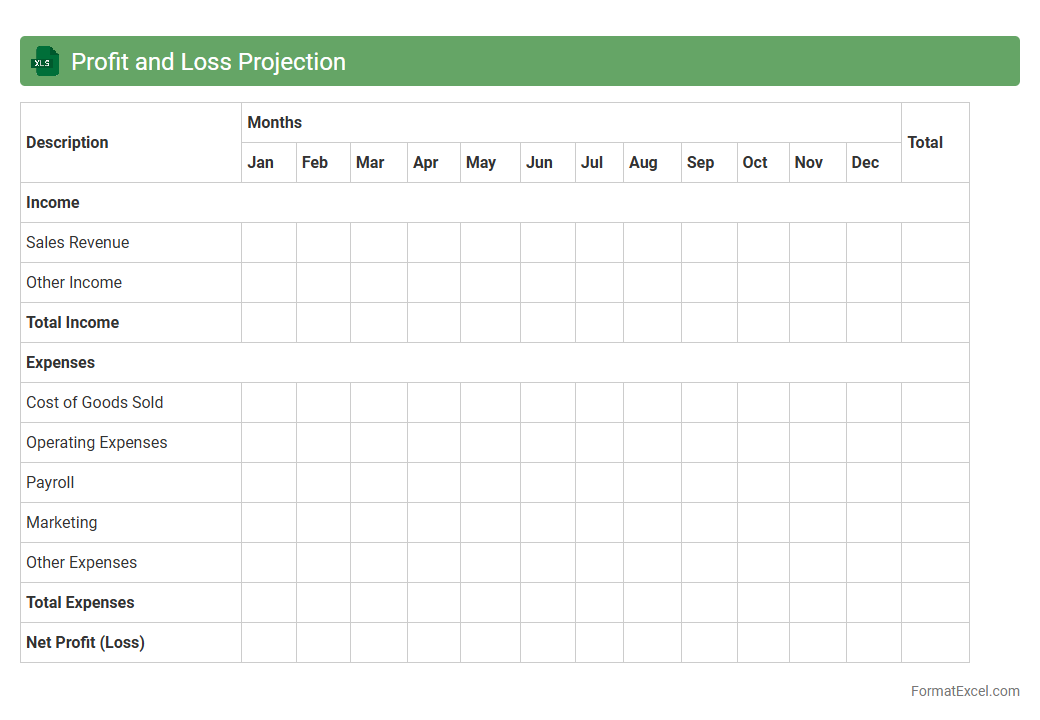
Profit and Loss Projection
A
Profit and Loss Projection Excel document is a financial tool that estimates future revenues, expenses, and net income over a specific period. It helps businesses plan budgets, forecast profitability, and make informed decisions by analyzing potential financial outcomes. Utilizing this projection enhances strategic planning and improves cash flow management by providing clear insights into expected financial performance.
Funding Requirements
A
Funding Requirements Excel document is a detailed financial tool used to outline the capital needed for a project or business venture over a specific period. It helps in breaking down expenses such as equipment, operational costs, and contingencies, providing clear visibility into the amount and timing of funds required. This document is essential for accurate budget planning, ensuring efficient allocation of resources, and attracting investors by demonstrating a well-prepared financial forecast.
Debt Schedule
A
Debt Schedule Excel document is a detailed financial tool that tracks all outstanding debts, including principal amounts, interest rates, payment dates, and maturity timelines. It helps individuals and businesses monitor repayment obligations, manage cash flow effectively, and plan for future debt servicing. Using this schedule ensures accurate forecasting, improved financial decision-making, and streamlined debt management.
Sales Forecast
A
Sales Forecast Excel document is a spreadsheet tool used to predict future sales revenue based on historical data, market trends, and sales patterns. It helps businesses make informed decisions about inventory management, budgeting, and resource allocation by providing accurate, data-driven projections. Using this document improves financial planning, aligns sales targets with market demand, and supports strategic growth initiatives.
Operating Costs Plan
An
Operating Costs Plan Excel document serves as a detailed financial tool to track and manage all expenses associated with running a business or project. It enables organizations to forecast budget requirements, monitor actual spending against planned costs, and identify cost-saving opportunities with precision. Utilizing this document ensures better financial control, improves decision-making, and supports strategic planning efforts by providing clear visibility into operational expenditures.
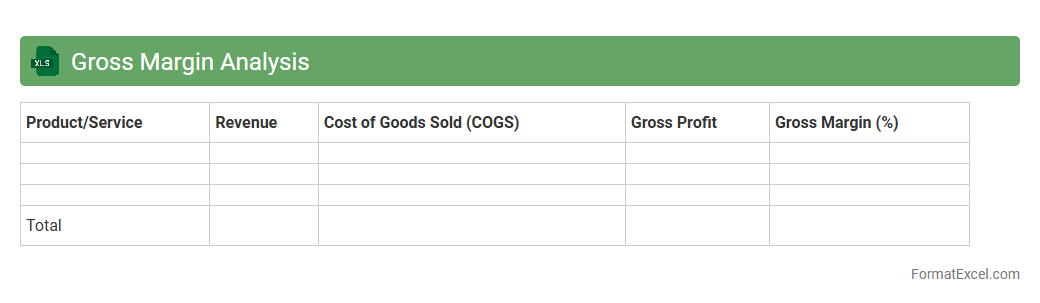
Gross Margin Analysis
Gross Margin Analysis Excel document is a powerful tool used to calculate and evaluate the profitability of products or services by comparing sales revenue against the cost of goods sold (COGS). It allows businesses to identify which items generate the highest
gross margin, enabling informed decisions on pricing, product mix, and cost control strategies. This analysis helps optimize financial performance by highlighting areas that require attention to maximize overall profit margins.
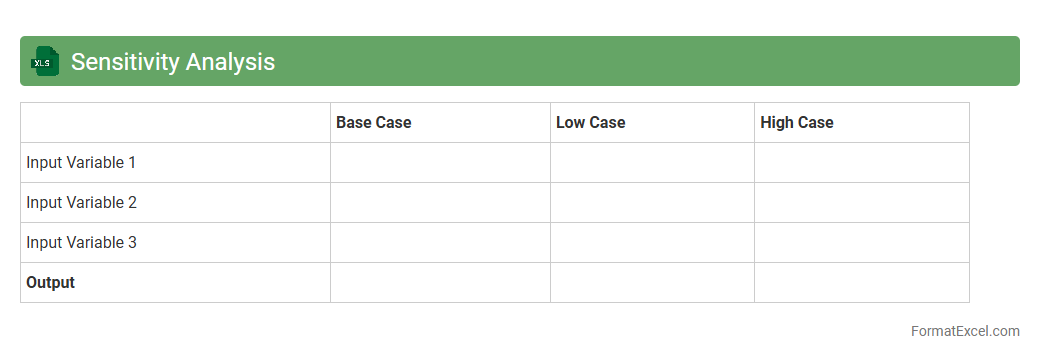
Sensitivity Analysis
Sensitivity Analysis in an Excel document is a powerful tool that evaluates how changes in input variables impact the output of a model or financial forecast. It helps identify which variables have the most significant effect on results, enabling better decision-making and risk management. By using
Sensitivity Analysis, businesses can optimize strategies, forecast outcomes more accurately, and prepare for uncertainties effectively.
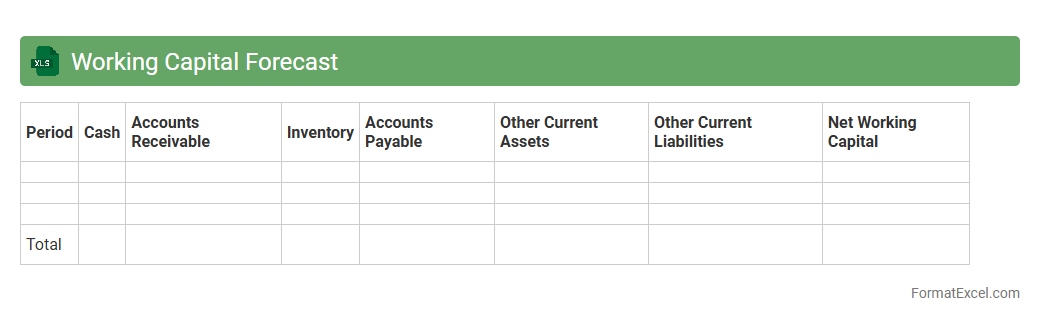
Working Capital Forecast
A
Working Capital Forecast Excel document is a financial tool designed to project future liquidity by estimating cash inflows and outflows related to current assets and liabilities. It helps businesses manage operational efficiency by anticipating funding needs, avoiding cash shortages, and optimizing resource allocation. This document is essential for maintaining smooth day-to-day operations and supporting strategic financial planning.
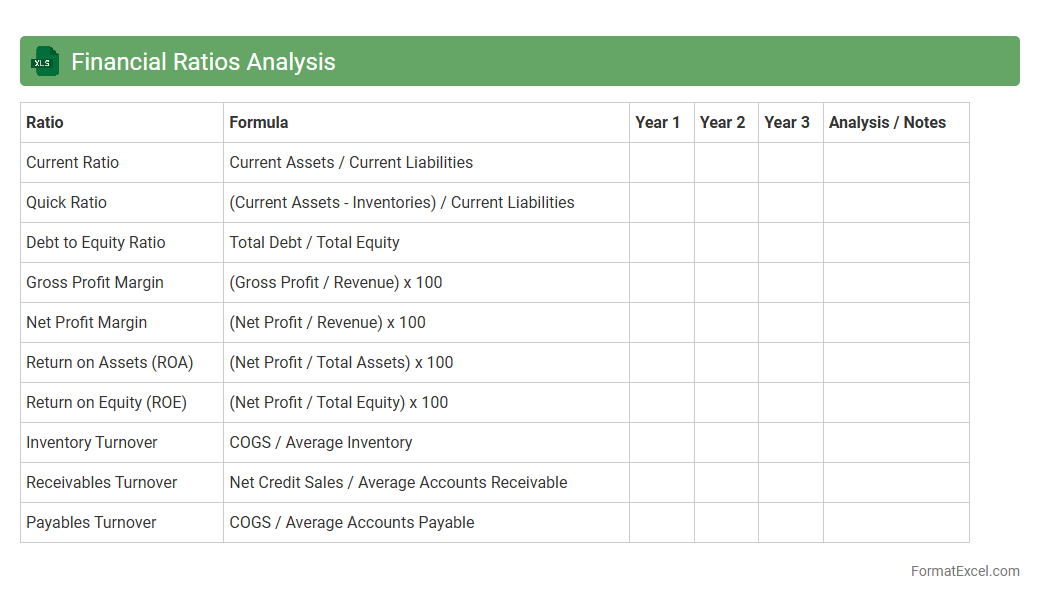
Financial Ratios Analysis
Financial Ratios Analysis Excel document is a powerful tool that organizes key financial metrics such as liquidity ratios, profitability ratios, and solvency ratios to evaluate a company's performance effectively. It enables users to quickly assess financial health, compare industry benchmarks, and make informed investment or management decisions. Utilizing
Financial Ratios Analysis in Excel streamlines complex calculations and enhances accuracy, saving time and improving strategic insights.
Loan Amortization Schedule
A
Loan Amortization Schedule Excel document organizes loan repayment information by detailing each payment's principal and interest portions over time. This schedule helps borrowers visualize the gradual decrease of debt and plan financial commitments effectively. Using this tool enhances budgeting accuracy and supports informed decision-making regarding loan management.
Capital Structure
A
Capital Structure Excel document is a financial tool used to analyze and manage a company's mix of debt, equity, and other financing sources. It helps in visualizing the impact of different financing options on the company's cost of capital and overall financial health. This document is essential for decision-making in optimizing capital allocation and improving financial strategy.
Return on Investment Analysis
Return on Investment Analysis in Excel is a powerful tool that helps evaluate the profitability of investments by calculating the ratio of net profit to the initial cost. This
ROI Analysis Excel document allows users to input various financial data, perform detailed calculations, and visualize results easily, facilitating informed decision-making. It is useful for businesses and individuals to compare different investment opportunities, optimize resource allocation, and maximize financial returns.
Funding Sources
The
Funding Sources Excel document is a comprehensive spreadsheet that organizes various financial resources available for projects, grants, or organizational needs. It typically includes data such as funding agency names, application deadlines, eligibility criteria, and funding amounts, which helps users streamline the search and application process. This tool is essential for efficiently managing and identifying potential funding opportunities to support project development and financial planning.
Use of Funds
The
Use of Funds Excel document is a detailed financial tool that tracks and allocates capital across various business activities or projects, providing clear visibility into spending patterns. It helps organizations ensure funds are used efficiently by categorizing expenses, monitoring budget adherence, and forecasting cash flow needs. This document is essential for maintaining financial accountability, supporting decision-making, and enhancing transparency with stakeholders.
Startup Costs
A
Startup Costs Excel document is a detailed financial tool used to estimate and track the initial expenses necessary to launch a new business. It helps entrepreneurs organize costs such as equipment, inventory, marketing, and legal fees in a structured format, promoting better budget management and financial planning. Utilizing this document supports informed decision-making and increases the likelihood of securing funding by presenting clear and comprehensive startup expenditure data.
Cost of Goods Sold Forecast
The
Cost of Goods Sold (COGS) Forecast Excel document is a financial tool designed to estimate future production expenses by analyzing material costs, labor, and overhead. It allows businesses to project expenses accurately, aiding in budget planning and profitability analysis. Using this forecast, companies can optimize inventory management and make informed decisions to control costs effectively.
Scenario Analysis
A
Scenario Analysis Excel document enables users to model different financial or business situations by altering key variables and assumptions within a structured spreadsheet. It helps forecast outcomes, compare potential risks and opportunities, and supports data-driven decision-making by providing clear visualizations and sensitivity results. Businesses and analysts use this tool to anticipate impacts, optimize strategies, and improve planning accuracy in uncertain environments.
Financial Assumptions
A
Financial Assumptions Excel document is a structured spreadsheet used to input and organize key financial variables such as revenue growth rates, cost projections, interest rates, and inflation estimates that form the foundation for financial models and forecasts. It enables users to analyze different scenarios by adjusting assumptions, helping businesses make informed decisions based on potential financial outcomes. This document enhances accuracy in budgeting, planning, and investment analysis by providing a clear, flexible framework for tracking and updating critical financial data.
Introduction to Financial Plan Formats
A financial plan format is a structured template that helps organize financial data efficiently. Using Excel for this purpose leverages its powerful calculation and data visualization features. A well-designed financial plan format ensures clarity and easier financial decision-making.
Importance of Financial Planning in Excel
Excel simplifies the financial planning process by allowing dynamic data input and automated calculations. It helps businesses and individuals track income, expenses, and investments in real time. Utilizing Excel enhances the accuracy of your financial planning efforts.
Key Components of an Excel Financial Plan
A comprehensive Excel financial plan includes sections for revenue, expenses, cash flow, and financial projections. Each component must be carefully detailed for effective budget management. Understanding these key elements is essential for creating a robust financial plan.
Step-by-Step Guide to Creating a Financial Plan in Excel
Begin by outlining your financial goals and gathering relevant data. Next, input income and expense figures, apply formulas, and visualize data using charts. Following a structured step-by-step guide streamlines the creation process.
Essential Excel Functions for Financial Planning
Functions like SUM, IF, PMT, and VLOOKUP are vital for automating calculations and analyzing data. Mastering these functions can improve the efficiency and accuracy of your financial analysis. These Excel functions help transform raw data into valuable insights.
Sample Financial Plan Template Layout
A typical template includes sections for revenue, expenses, profit/loss, and cash flow statements. The layout should be user-friendly and adaptable to various financial scenarios. Using a clear template layout enhances usability and decision support.
Revenue and Expense Tracking in Excel
Regularly updating revenue and expense entries in Excel allows accurate financial monitoring. Implementing categorical tracking assists in identifying spending trends. Effective revenue and expense tracking is crucial for financial control.
Forecasting and Budgeting Techniques with Excel
Excel enables advanced forecasting using historical data and trend analysis tools. Budgeting features allow setting financial limits and monitoring actual versus planned figures. Applying these forecasting and budgeting techniques boosts financial foresight.
Tips for Customizing Your Financial Plan Format
Adapt Excel templates by modifying categories, colors, and formulas to suit your needs. Adding conditional formatting enhances visual cues for financial health. Customization ensures the financial plan format meets your specific requirements.
Downloadable Excel Financial Plan Templates
Many free and premium Excel templates are available for quick financial plan setup. These templates come pre-filled with formulas and layouts designed for efficiency. Using downloadable financial plan templates saves time and improves accuracy.