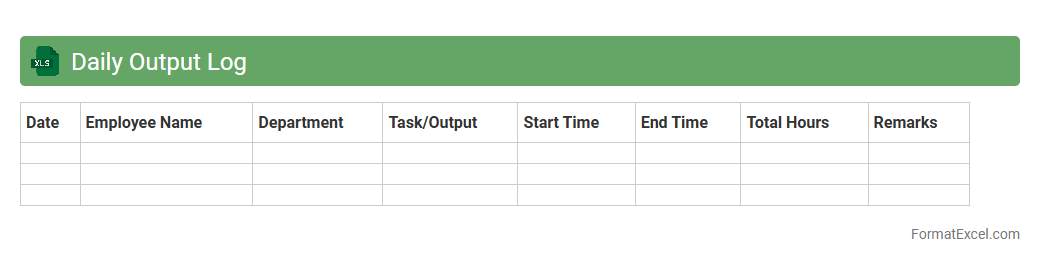
Daily Output Log
A
Daily Output Log Excel document is a structured spreadsheet used to record and track daily production or work output in detail. It helps monitor performance metrics, identify productivity trends, and ensure accuracy in reporting by providing clear, organized data entries. This log enhances operational efficiency by enabling timely analysis and informed decision-making based on real-time output information.
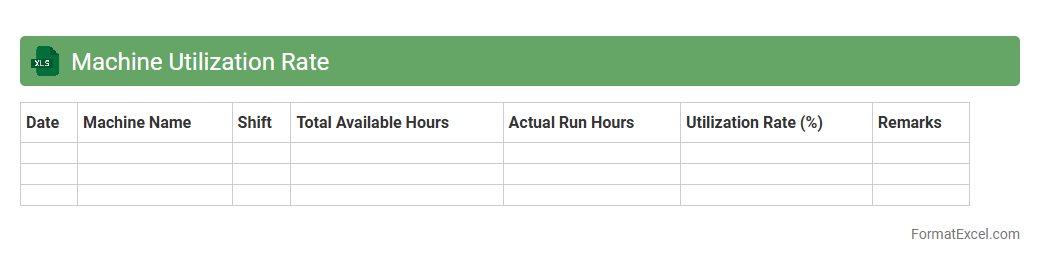
Machine Utilization Rate
The
Machine Utilization Rate Excel document tracks the percentage of time machinery operates compared to available time, providing critical data to optimize productivity. This tool helps identify underused equipment, streamline maintenance schedules, and enhance operational efficiency. By analyzing utilization rates, businesses can reduce downtime and improve resource allocation for higher profitability.
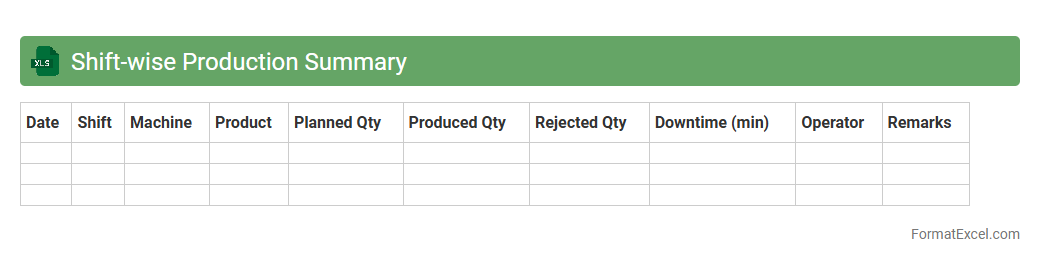
Shift-wise Production Summary
The
Shift-wise Production Summary Excel document is a detailed record that captures production metrics categorized by individual work shifts, allowing for precise analysis of output variations throughout the day. This document helps identify shift-specific performance trends, optimize workforce allocation, and improve operational efficiency by providing clear insights into productivity levels. Using this data-driven approach, managers can make informed decisions to enhance overall manufacturing processes and reduce downtime.
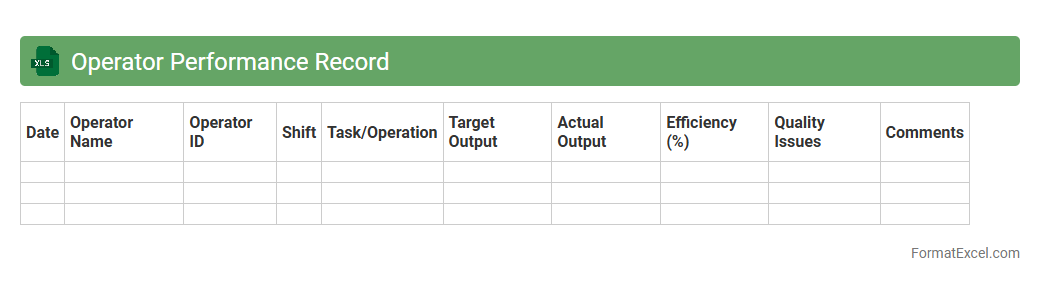
Operator Performance Record
The
Operator Performance Record Excel document is a structured file used to systematically track and analyze the efficiency and productivity of operators in various industries. It helps in monitoring key performance indicators such as task completion time, error rates, and adherence to safety protocols, enabling data-driven decisions for workforce management. This document enhances operational transparency, facilitates targeted training programs, and supports continuous improvement initiatives by providing clear insights into individual and team performance metrics.
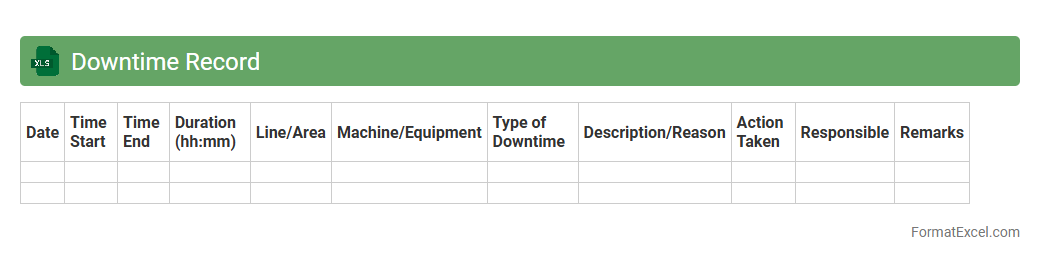
Downtime Record
A
Downtime Record Excel document is a structured spreadsheet used to log periods when machinery, systems, or processes are not operational. It helps track the duration, causes, and frequency of downtime, providing valuable data for analyzing operational inefficiencies. This record enables businesses to identify trends, improve maintenance schedules, and enhance overall productivity by minimizing unplanned interruptions.
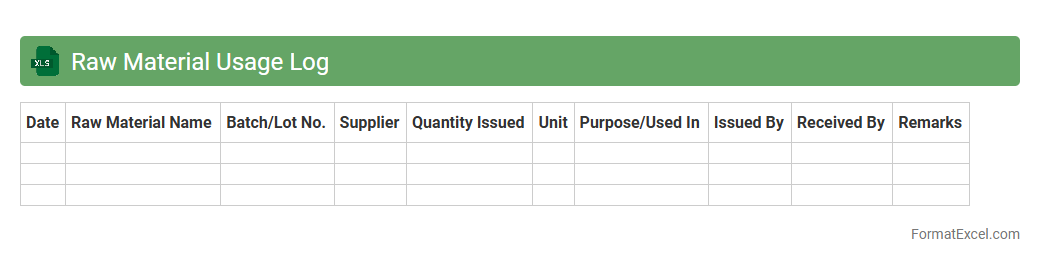
Raw Material Usage Log
A
Raw Material Usage Log Excel document is a detailed record that tracks the consumption of raw materials in manufacturing or production processes. It helps monitor inventory levels, identify usage patterns, and reduce waste by providing accurate data on material consumption rates. This log is essential for cost control, production planning, and ensuring timely procurement of materials to maintain smooth operational workflows.
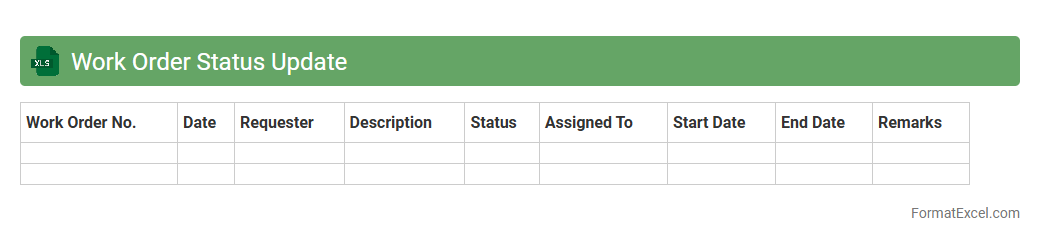
Work Order Status Update
The
Work Order Status Update Excel document tracks the progress and current state of various work orders, providing real-time visibility into task completion, pending actions, and deadlines. It helps project managers and teams maintain organized records, prioritize workloads, and streamline communication by offering clear status details such as "In Progress," "Completed," or "On Hold." This tool enhances operational efficiency by reducing delays, improving accountability, and facilitating data-driven decision-making across departments.
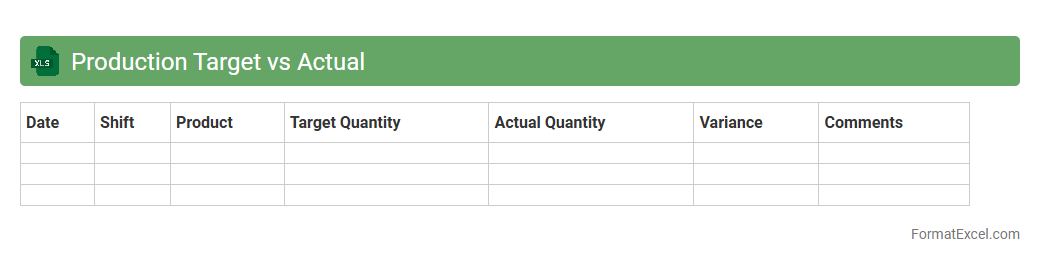
Production Target vs Actual
The
Production Target vs Actual Excel document is a tool used to compare planned production goals against real output data, enabling precise tracking of manufacturing performance. It helps identify variances, streamline operations, and improve resource allocation by highlighting gaps between targets and actual results. This document supports data-driven decision-making to enhance efficiency and meet production deadlines effectively.
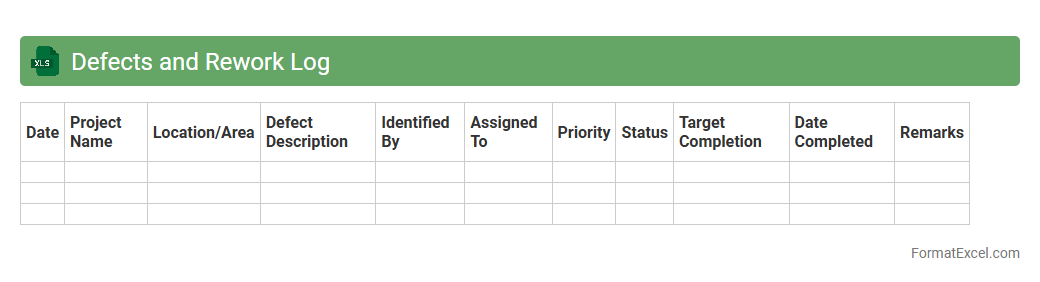
Defects and Rework Log
A
Defects and Rework Log Excel document systematically tracks product or process defects and the corresponding rework actions taken to address them. It enables teams to identify recurring issues, monitor repair progress, and analyze defect trends for quality improvement initiatives. Utilizing this log enhances accountability, reduces errors, and supports data-driven decision-making for operational efficiency.
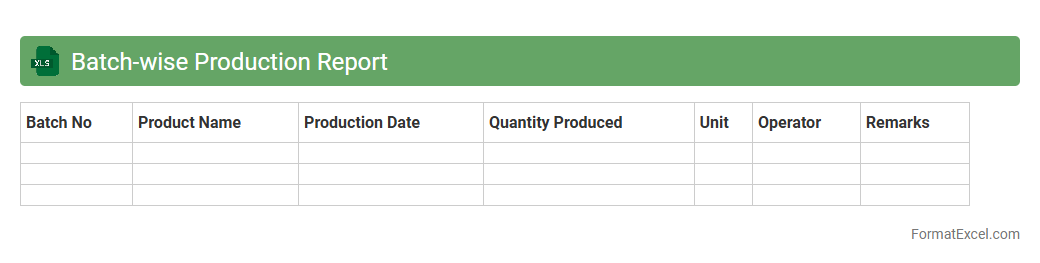
Batch-wise Production Report
A
Batch-wise Production Report Excel document systematically records production data for each batch, including quantities, defects, production time, and resource usage. This report enables precise tracking of manufacturing efficiency, quality control, and inventory management by providing detailed insights into the performance of individual production batches. Utilizing this data helps optimize production processes, reduce waste, and ensure consistent product quality across all batches.
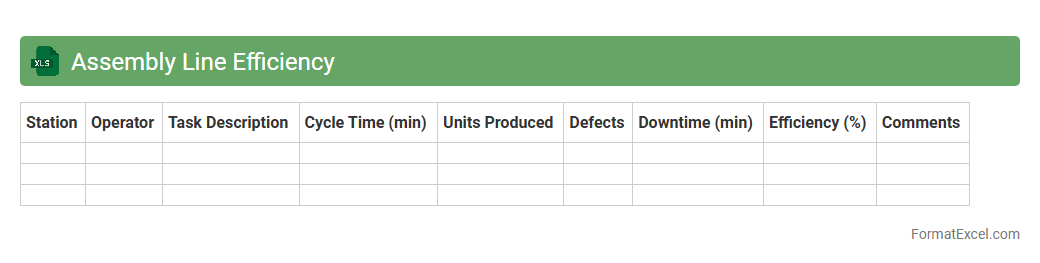
Assembly Line Efficiency
The
Assembly Line Efficiency Excel document is a tool designed to measure and analyze the productivity of manufacturing assembly lines by tracking output against time and resources used. It helps identify bottlenecks, optimize labor allocation, and reduce production costs through detailed data visualization and performance metrics. This document is invaluable for operations managers seeking to enhance workflow efficiency and increase overall manufacturing effectiveness.
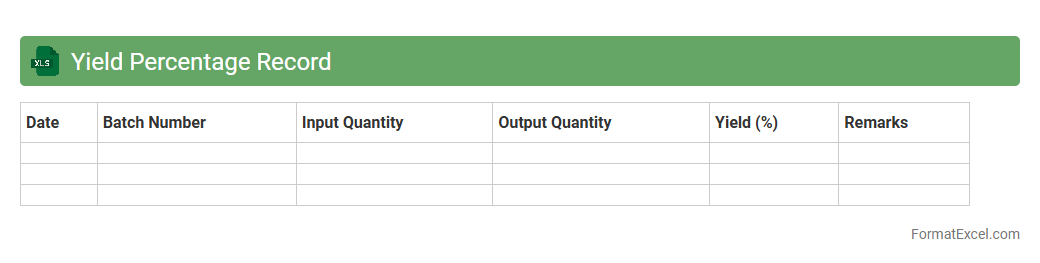
Yield Percentage Record
The
Yield Percentage Record Excel document tracks the efficiency and quality of production processes by recording the ratio of acceptable output to total input. This data helps identify areas of waste, improve manufacturing consistency, and optimize resource utilization. Businesses use this record to enhance productivity, reduce costs, and maintain high product standards.
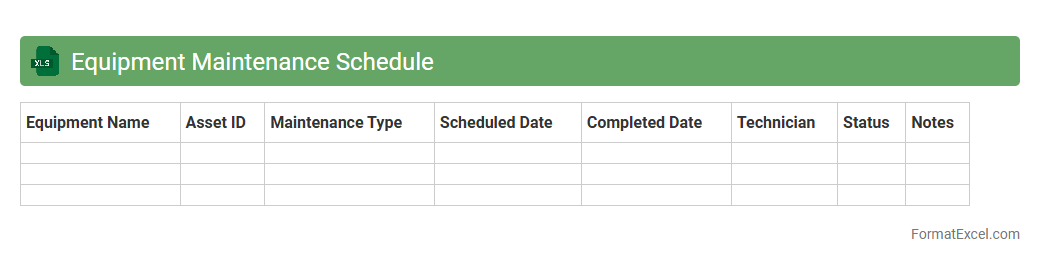
Equipment Maintenance Schedule
An
Equipment Maintenance Schedule Excel document is a structured spreadsheet designed to track and organize routine maintenance tasks for various machinery and equipment. It helps ensure timely inspections, repairs, and servicing by providing clear timelines, task details, and responsible personnel, which reduces downtime and extends equipment lifespan. The document enhances operational efficiency, minimizes unexpected breakdowns, and supports compliance with safety regulations.
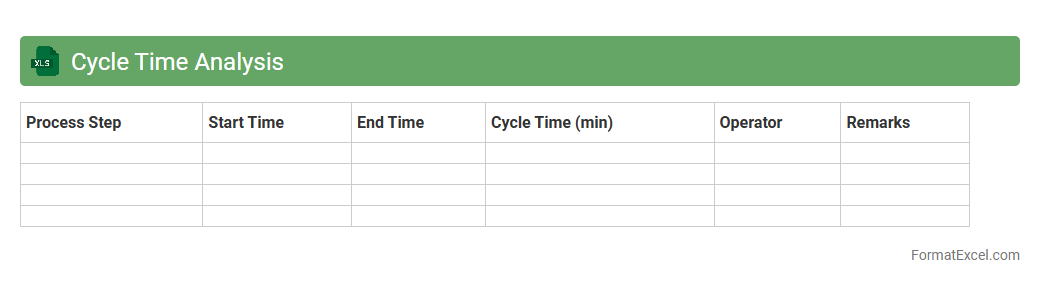
Cycle Time Analysis
Cycle Time Analysis Excel document is a powerful tool designed to measure and evaluate the duration required to complete a specific process or task within a workflow. By capturing detailed time data, it enables businesses to identify inefficiencies, monitor process performance, and implement improvements to reduce delays. Utilizing
cycle time analysis helps optimize operations, enhance productivity, and achieve better project management outcomes.
Scrap Material Tracking
A
Scrap Material Tracking excel document is a tool designed to monitor and manage waste materials generated during manufacturing or production processes. It helps businesses accurately record quantities, types, and sources of scrap, enabling better inventory control and cost reduction. By analyzing this data, companies can identify inefficiencies, minimize material loss, and improve overall operational productivity.
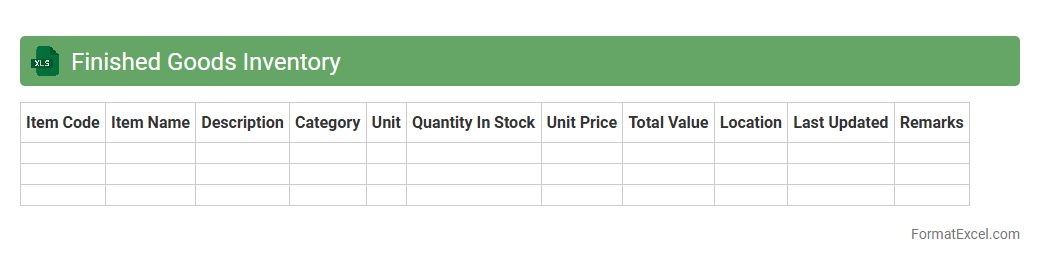
Finished Goods Inventory
A
Finished Goods Inventory Excel document is a spreadsheet used to track and manage the quantity, value, and status of completed products ready for sale. It helps businesses monitor stock levels in real-time, forecast demand, and optimize inventory turnover to reduce carrying costs. This tool also improves accuracy in financial reporting and streamlines supply chain operations by providing clear visibility into available finished goods.
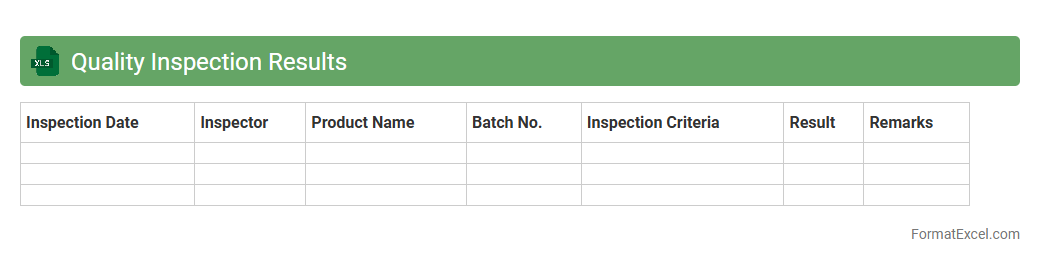
Quality Inspection Results
A
Quality Inspection Results Excel document is a structured file used to record, analyze, and track the outcomes of product or process inspections. It facilitates the identification of defects, compliance with standards, and areas needing improvement by organizing detailed inspection data in a clear and accessible format. This document enhances decision-making by providing actionable insights, improving product quality, and ensuring consistent manufacturing or service delivery processes.
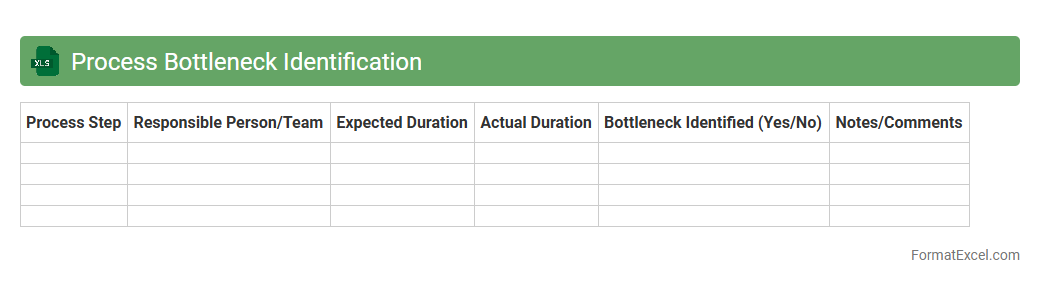
Process Bottleneck Identification
The
Process Bottleneck Identification Excel document is a specialized tool designed to analyze workflows and pinpoint stages where delays or inefficiencies occur, limiting overall process performance. By using data visualization and calculation features within Excel, it allows users to track cycle times, workloads, and resource allocation to highlight bottlenecks accurately. This identification enables businesses to prioritize improvements, optimize operations, and increase productivity by focusing on critical constraints.
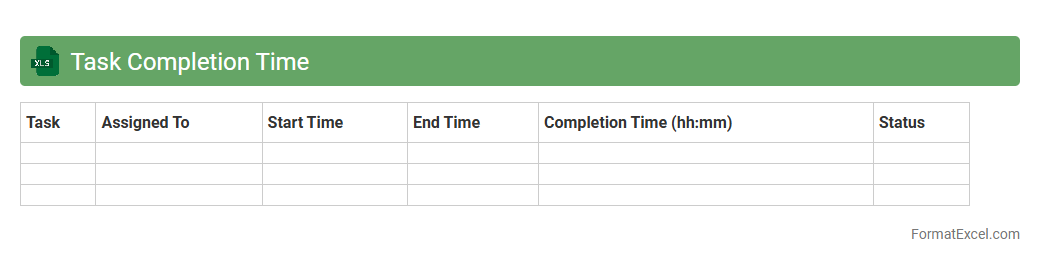
Task Completion Time
A
Task Completion Time Excel document tracks the duration taken to finish specific tasks, enabling efficient time management and productivity analysis. It helps identify bottlenecks and streamline workflows by providing clear insights into task durations and performance metrics. Using this document allows teams and individuals to optimize scheduling, improve resource allocation, and meet deadlines consistently.
Order Fulfillment Tracker
An
Order Fulfillment Tracker Excel document is a tool designed to monitor and manage the status of customer orders from placement to delivery. It helps businesses track inventory levels, shipment progress, and order processing times, ensuring timely and accurate fulfillment. This organized tracking system improves operational efficiency, reduces errors, and enhances customer satisfaction by providing real-time visibility into the order lifecycle.
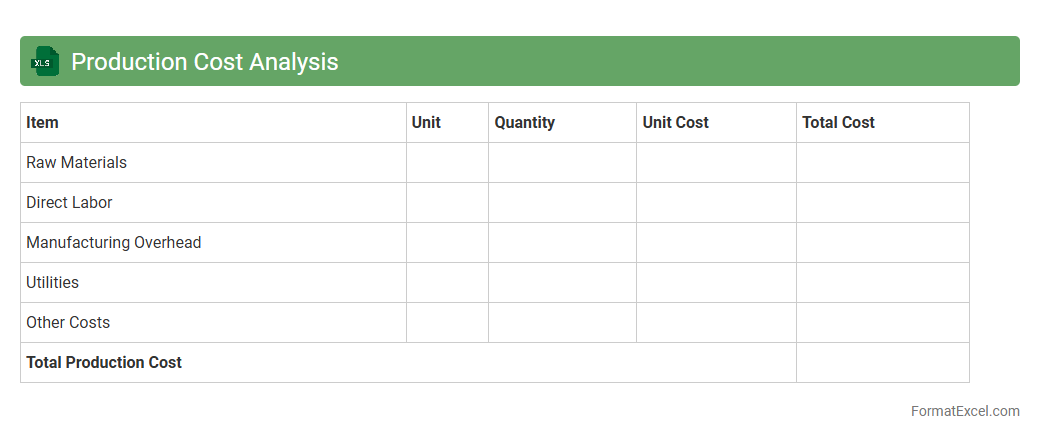
Production Cost Analysis
The
Production Cost Analysis Excel document systematically organizes and evaluates all expenses involved in manufacturing products, including raw materials, labor, and overhead costs. This detailed breakdown helps businesses identify cost-saving opportunities, optimize resource allocation, and improve budgeting accuracy. Using this Excel tool enhances decision-making by providing clear insights into cost structures and profitability metrics.
Resource Allocation Tracker
A
Resource Allocation Tracker Excel document is a tool designed to monitor and manage the distribution of resources such as personnel, time, and budget across various projects or tasks. It provides real-time visibility into resource availability, utilization rates, and potential overbooking, enabling more efficient project planning and decision-making. This tracker helps organizations optimize resource use, reduce bottlenecks, and ensure projects are completed on time and within budget.
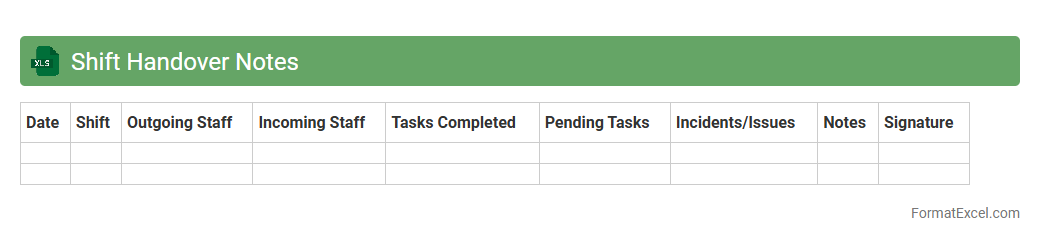
Shift Handover Notes
Shift Handover Notes Excel document is a structured tool designed to record and communicate critical information between outgoing and incoming shift teams, ensuring seamless operational continuity. It captures key details such as task status, incidents, pending actions, and important updates, promoting accountability and reducing errors. Using this
shift handover template enhances team collaboration, minimizes miscommunication, and boosts overall workplace efficiency.
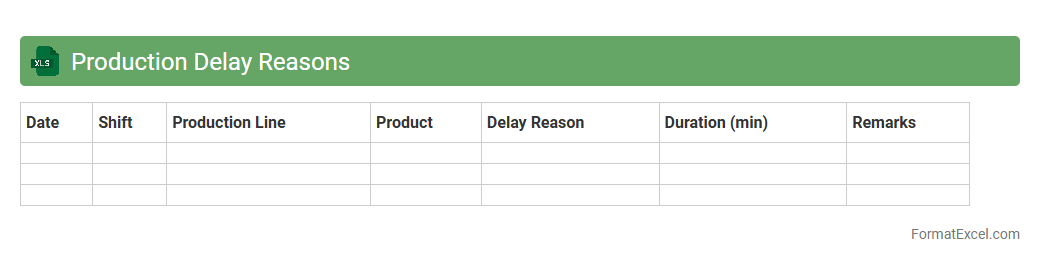
Production Delay Reasons
The
Production Delay Reasons Excel document is a detailed record that categorizes and tracks the various causes of delays in manufacturing or production processes. It helps identify key bottlenecks such as equipment failure, material shortages, or labor issues, enabling data-driven decision-making to improve overall efficiency. This document serves as a crucial tool for analyzing patterns, optimizing workflows, and minimizing downtime across production lines.
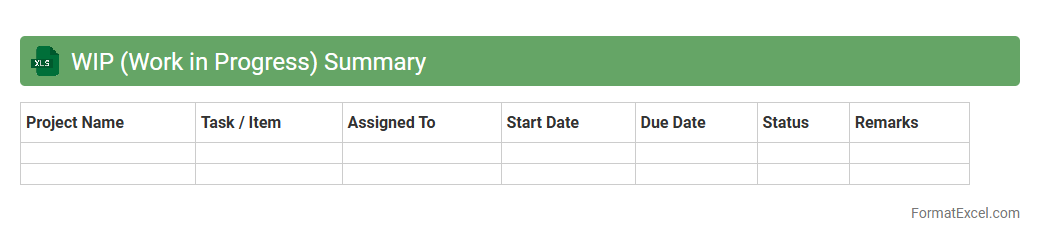
WIP (Work in Progress) Summary
A
WIP (Work in Progress) Summary Excel document provides a detailed overview of ongoing projects, tasks, or production processes, tracking their current status and progress. It enables efficient monitoring of deadlines, resource allocation, and bottlenecks, facilitating better project management and timely decision-making. This summary helps teams maintain transparency and prioritize work to ensure continuous workflow and successful completion of deliverables.
Introduction to Production Tracker Format in Excel
A Production Tracker format in Excel is designed to monitor and manage production processes efficiently. It enables teams to keep track of daily output, resource usage, and deadlines. Excel's flexibility makes it a popular tool for organizing production data in real-time.
Key Features of an Effective Production Tracker
Essential features include clear status updates, real-time progress tracking, and resource allocation. An effective production tracker offers easy data entry and customizable fields to suit various workflows. Automation capabilities and alerts help streamline operations and reduce errors.
Benefits of Using Excel for Production Tracking
Excel provides a versatile and accessible platform for managing production data without requiring advanced technical skills. It supports data visualization, formula-driven calculations, and easy sharing across teams. Using Excel saves costs compared to specialized software solutions.
Essential Columns in a Production Tracker Sheet
Typical columns include Date, Product ID, Quantity Produced, Status, and Responsible Person. Including a Deadline or Due Date column helps track timely completion of tasks. Additional columns for defect rates or machine hours enhance production analysis.
Step-by-Step Guide to Creating a Production Tracker in Excel
Begin by setting up headers corresponding to production metrics like Date and Quantity. Use Excel's table feature to maintain organized and filterable data. Finally, apply conditional formatting to highlight delays and bottlenecks automatically.
Sample Templates for Production Tracker Formats
Pre-built templates offer structured layouts tailored for manufacturing, assembly, or packaging industries. These templates save time by providing ready-to-use sheets with standard metrics and formulas. Many are customizable to fit unique business requirements.
Customizing Your Production Tracker for Different Industries
Adjust column headers and data inputs based on industry-specific processes such as batch tracking for food or component tracking in electronics. Custom fields like machine utilization rates or operator shifts enhance relevance. Incorporate sector standards to increase the tracker's practical value.
Automating Calculations and Summaries with Excel Formulas
Use built-in Excel functions like SUM, AVERAGE, and IF to perform real-time data analysis. PivotTables are powerful tools for summarizing production volumes by date or product. Automation reduces manual errors and speeds up reporting.
Best Practices for Maintaining Production Tracking Data
Regularly update entries to ensure data accuracy and reliability. Use consistent data formats and validate inputs to avoid discrepancies. Back up data and protect sheets with passwords to maintain data integrity and confidentiality.
Tips for Visualizing Production Data with Excel Charts
Leverage bar charts, line graphs, and pie charts to display production trends and performance metrics clearly. Interactive dashboards combining multiple visuals improve decision-making efficiency. Using dynamic charts can highlight critical issues like delays or capacity limits instantly.