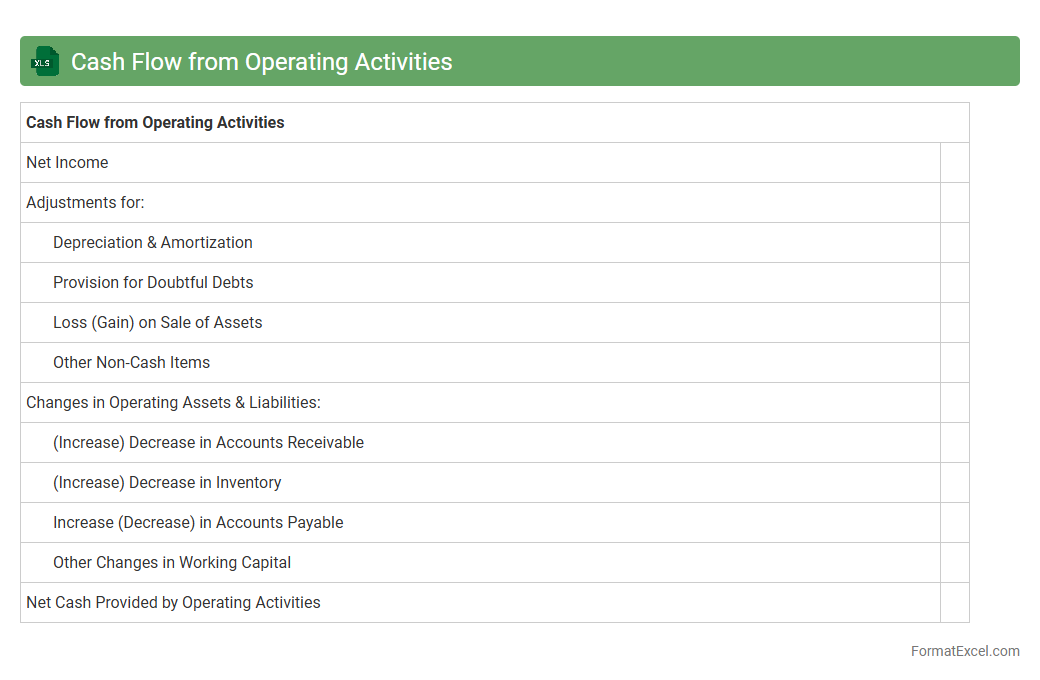
Cash Flow from Operating Activities
Cash Flow from Operating Activities Excel document tracks the cash generated or used by a company's core business operations, providing a clear view of liquidity and operational efficiency. It helps businesses analyze cash inflows and outflows from daily activities, enabling better decision-making for budgeting, forecasting, and financial planning. Using
Cash Flow from Operating Activities data supports identifying cash generation trends and managing working capital effectively.
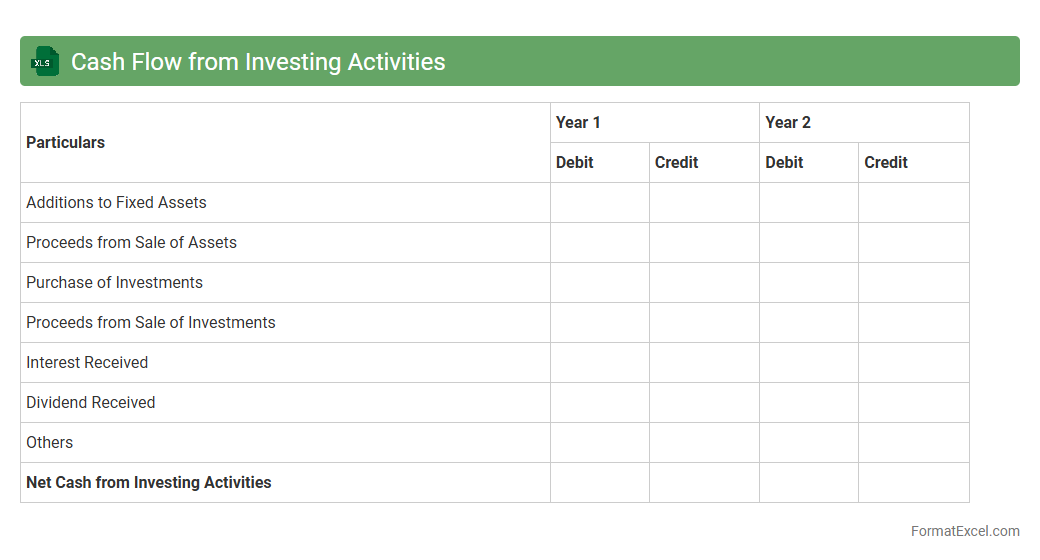
Cash Flow from Investing Activities
The
Cash Flow from Investing Activities Excel document tracks cash inflows and outflows related to the purchase and sale of long-term assets, such as property, equipment, and investments. It helps businesses analyze how investment decisions impact overall liquidity and financial health by clearly showing expenditures and returns on capital assets. This document is essential for forecasting future investment needs and making informed strategic decisions.
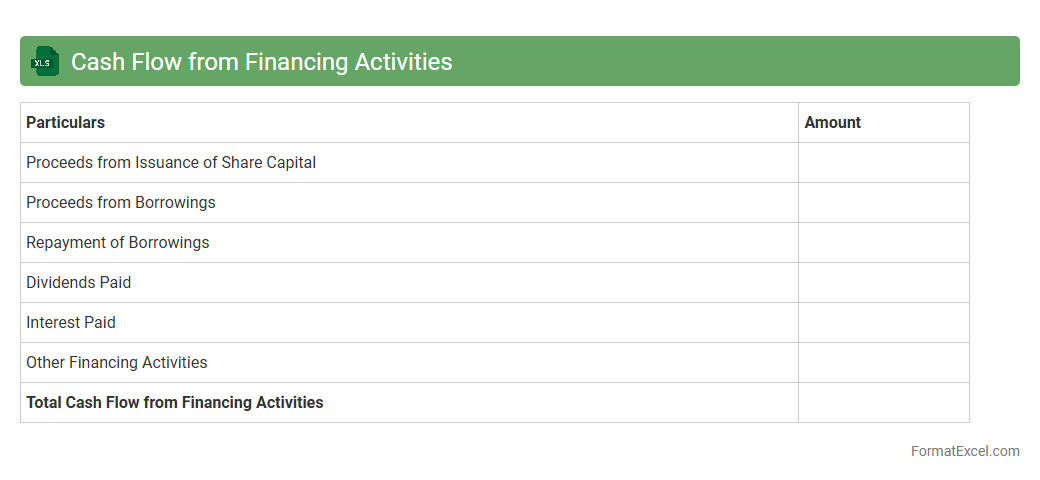
Cash Flow from Financing Activities
The
Cash Flow from Financing Activities Excel document tracks the inflows and outflows of cash related to borrowing, repaying debt, issuing shares, and paying dividends. It helps businesses analyze how their financing decisions impact overall cash position and financial health over a specific period. By providing clear visibility into capital structure changes, this document supports strategic planning and informed investment decisions.
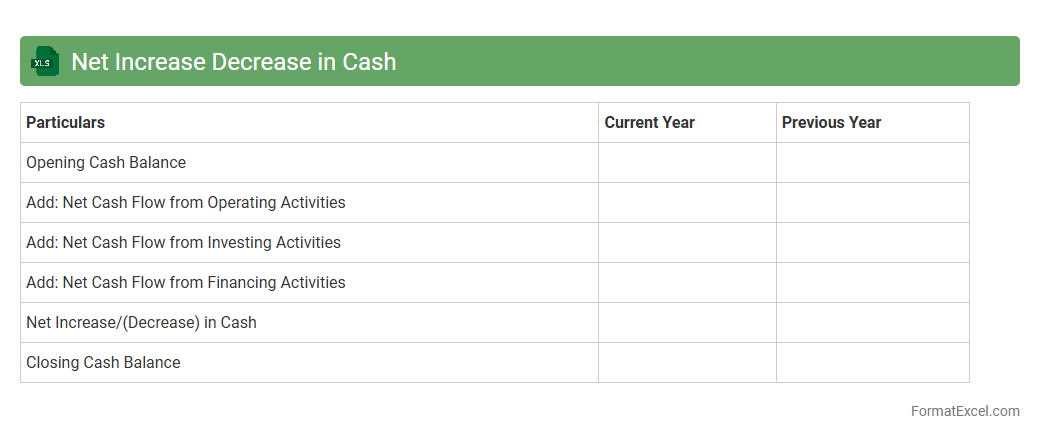
Net Increase Decrease in Cash
Net Increase Decrease in Cash in an Excel document represents the overall change in cash flow during a specific period, calculated by summing cash inflows and outflows from operating, investing, and financing activities. This metric provides a clear snapshot of a company's liquidity and financial health, enabling accurate cash flow management and forecasting. Using
Net Increase Decrease in Cash helps businesses make informed decisions regarding budgeting, investments, and ensuring sufficient cash reserves.
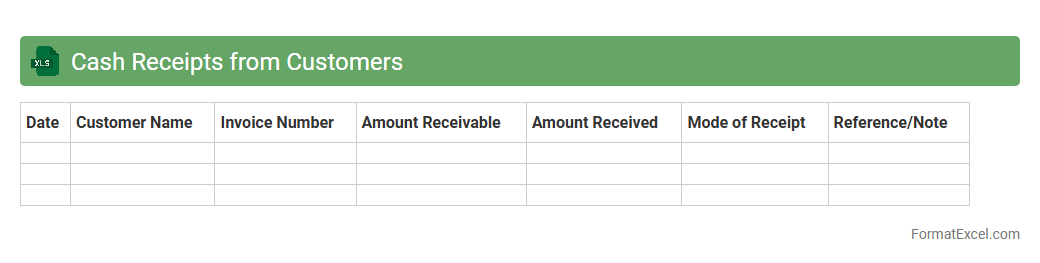
Cash Receipts from Customers
The
Cash Receipts from Customers Excel document is a financial tool that records all incoming payments from customers, tracking sales revenue and cash flow efficiently. It enables businesses to monitor daily cash inflows, reconcile accounts, and ensure accurate bookkeeping for better financial management. This document is essential for improving cash flow forecasting and maintaining up-to-date records to support accounting audits and financial reporting.
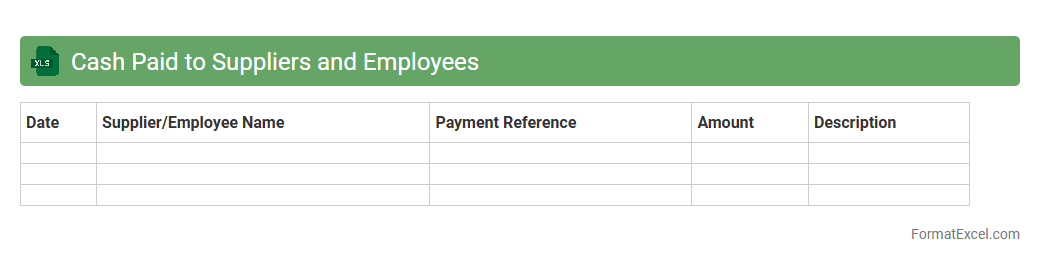
Cash Paid to Suppliers and Employees
Cash Paid to Suppliers and Employees Excel document is a financial tool used to track and record payments made to suppliers and employees, ensuring accurate cash flow management. This document helps businesses monitor expenses related to operational costs and payroll, providing clear visibility into outgoing cash transactions. Utilizing a
Cash Paid to Suppliers and Employees Excel sheet improves budgeting accuracy and supports strategic financial planning by enabling detailed analysis of payment patterns.
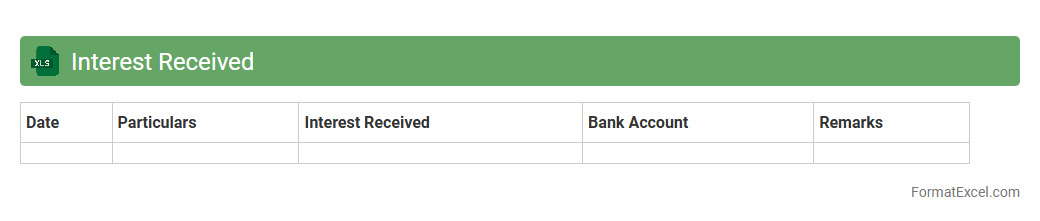
Interest Received
An
Interest Received Excel document is a financial record that tracks the interest income earned from various investments or savings accounts over a specific period. It helps in organizing, calculating, and analyzing interest payments for accurate financial reporting and tax purposes. This document is useful for individuals and businesses to monitor cash flow, optimize investment strategies, and ensure compliance with tax regulations.
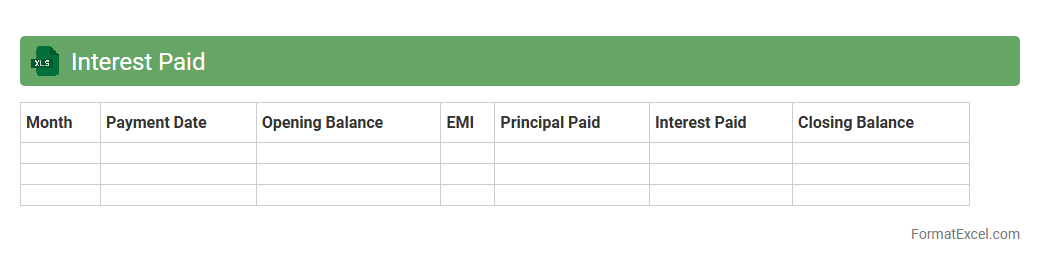
Interest Paid
An
Interest Paid Excel document is a spreadsheet tool designed to track and calculate the interest payments made on loans or credit over a specified period. It helps users monitor their financial obligations by providing detailed insights into principal versus interest amounts, enabling better budgeting and financial planning. Utilizing this document enhances transparency and assists in optimizing repayment strategies to minimize interest costs effectively.
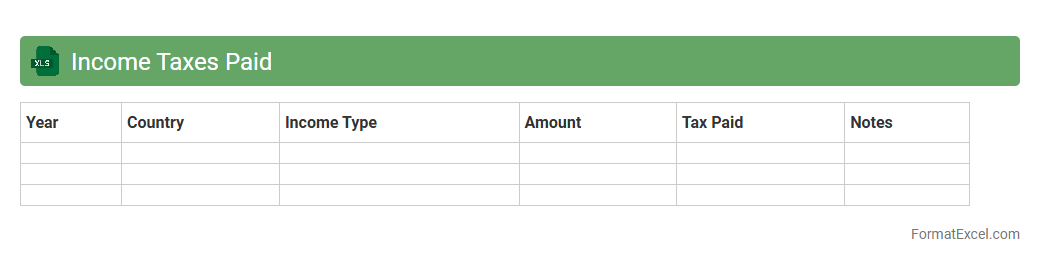
Income Taxes Paid
An
Income Taxes Paid Excel document is a financial tool that tracks and organizes the amount of income tax an individual or business has paid over a specific period. This document helps in monitoring tax payments, ensuring compliance with tax regulations, and simplifying the process of filing tax returns or conducting financial audits. By maintaining accurate records in Excel, users can easily analyze tax liabilities, spot discrepancies, and plan for future tax obligations effectively.
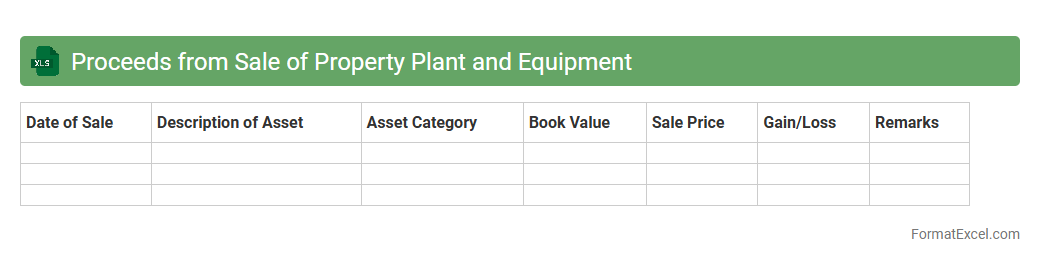
Proceeds from Sale of Property Plant and Equipment
The
Proceeds from Sale of Property Plant and Equipment Excel document tracks the revenue generated from disposing of fixed assets, providing a clear record of cash inflows related to asset sales. This document is essential for accurate financial reporting and helps in analyzing the impact of asset sales on a company's cash flow and overall financial health. By organizing data efficiently, it assists accountants and managers in decision-making and planning future capital expenditures.
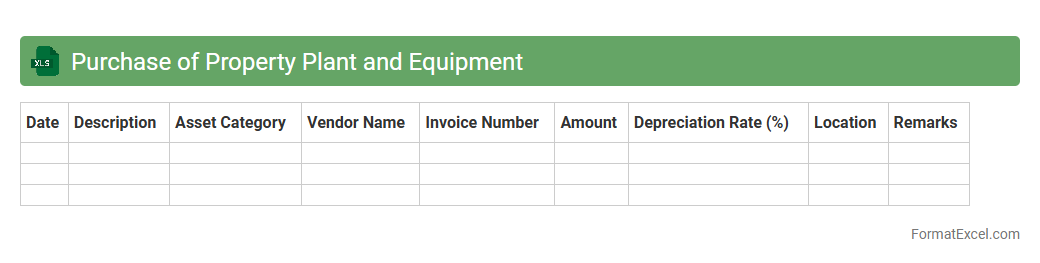
Purchase of Property Plant and Equipment
The
Purchase of Property Plant and Equipment Excel document is a detailed financial tool used to track and manage the acquisition costs, depreciation schedules, and asset values of physical assets in a business. It helps organizations maintain accurate records of their capital expenditures, ensuring proper budgeting and compliance with accounting standards. By providing clear visibility into asset management, this document supports informed decision-making for investments and financial reporting.
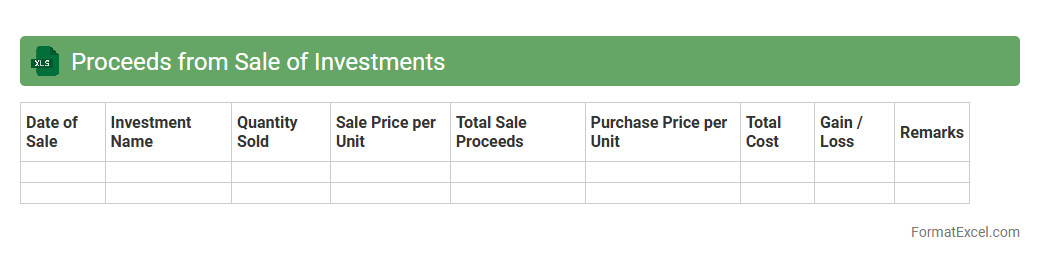
Proceeds from Sale of Investments
The
Proceeds from Sale of Investments Excel document is a financial tool designed to track and calculate the total amount received from selling various investments, such as stocks, bonds, or mutual funds. It helps users organize transaction details, including sale dates, quantities, prices, and capital gains or losses, providing clarity on investment performance and tax implications. This document is essential for accurate financial reporting, portfolio management, and strategic decision-making regarding asset allocation.
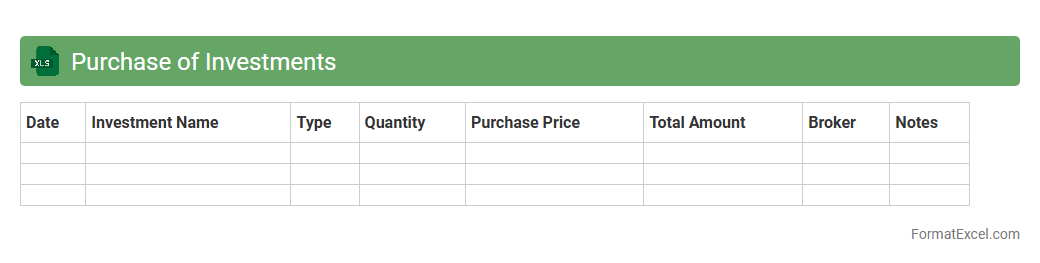
Purchase of Investments
A
Purchase of Investments Excel document is a detailed financial record that tracks the acquisition of various investment assets such as stocks, bonds, and mutual funds. It helps investors monitor purchase dates, quantities, prices, and total costs, enabling accurate portfolio management and performance analysis. Using this document improves decision-making by providing clear insights into investment costs and timing.
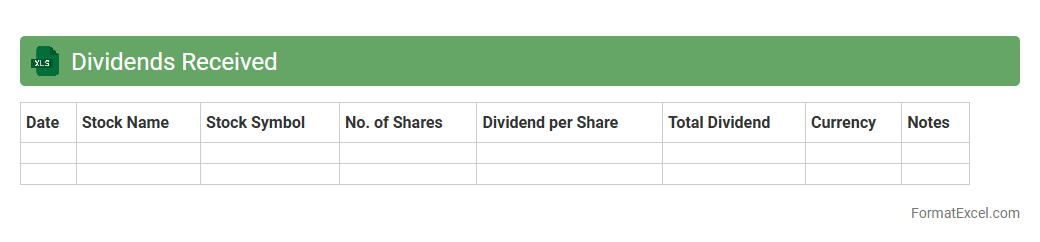
Dividends Received
The
Dividends Received Excel document is a financial tool designed to systematically track and record dividend income from various investments. It helps investors and accountants monitor dividend payments, calculate total returns, and analyze portfolio performance over time. By organizing dividend data in one place, this document simplifies tax reporting and improves decision-making for income-focused investment strategies.
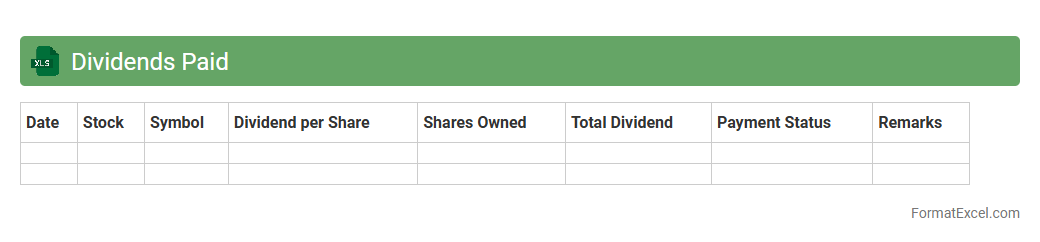
Dividends Paid
The
Dividends Paid Excel document is a financial tool that tracks and records dividend payments made by a company to its shareholders over specific periods. It helps investors and analysts monitor income streams, assess the consistency of dividend payments, and evaluate the company's profitability and financial health. This document is essential for making informed investment decisions and managing personal or institutional dividend income portfolios efficiently.
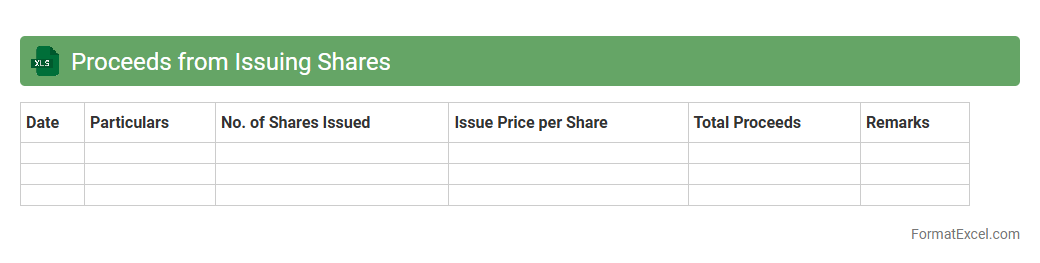
Proceeds from Issuing Shares
The
Proceeds from Issuing Shares Excel document tracks the capital raised by a company through the sale of its shares, detailing the total funds received from shareholders during an issuance. It is useful for financial analysis, helping stakeholders monitor equity financing activities and assess the impact on the company's capital structure. This document supports informed decision-making by providing clear visibility into the sources of equity funding and the resultant cash inflows.
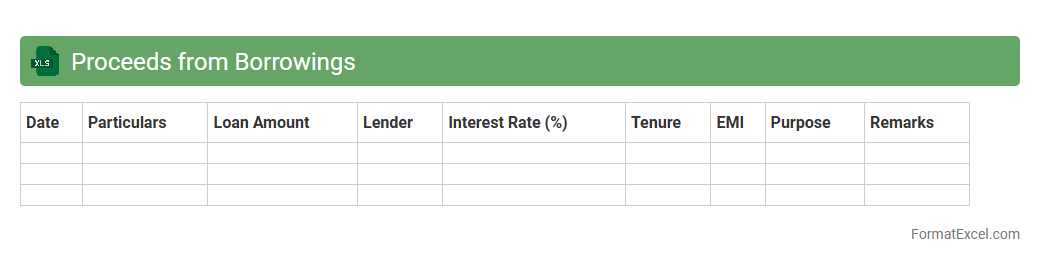
Proceeds from Borrowings
The
Proceeds from Borrowings Excel document tracks funds obtained through loans or credit facilities, detailing amounts borrowed, interest rates, repayment schedules, and outstanding balances. This document is essential for financial planning and cash flow management, allowing businesses to monitor debt levels, forecast expenses, and ensure timely payments. Using this tool helps maintain accurate debt records, supports budgeting decisions, and improves transparency in financial reporting.
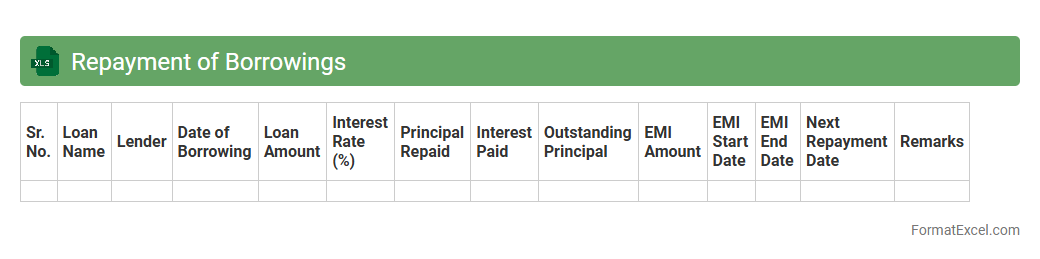
Repayment of Borrowings
A
Repayment of Borrowings Excel document is a financial tool used to track and manage loan repayments over a specified period. It allows users to schedule payments, monitor outstanding balances, and calculate interest obligations accurately. This document is essential for budgeting, ensuring timely payments, and maintaining a clear overview of debt reduction.
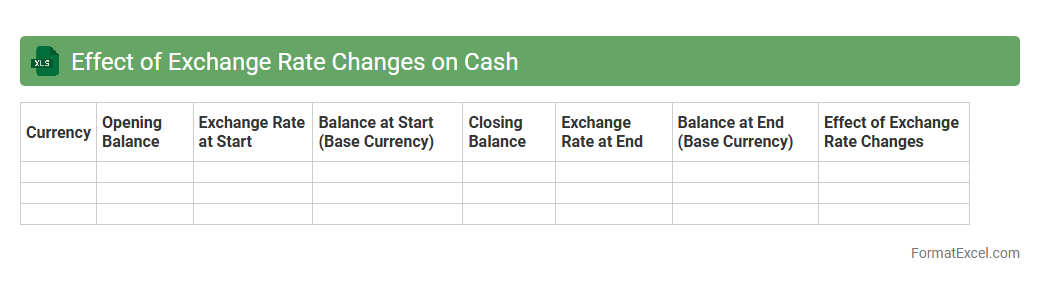
Effect of Exchange Rate Changes on Cash
The
Effect of Exchange Rate Changes on Cash Excel document analyzes how fluctuations in foreign currency exchange rates impact the cash balances of multinational companies. It helps businesses monitor and manage currency risk by providing clear insights into potential gains or losses caused by exchange rate movements. This tool assists in making informed financial decisions and improving cash flow forecasting across different currency environments.
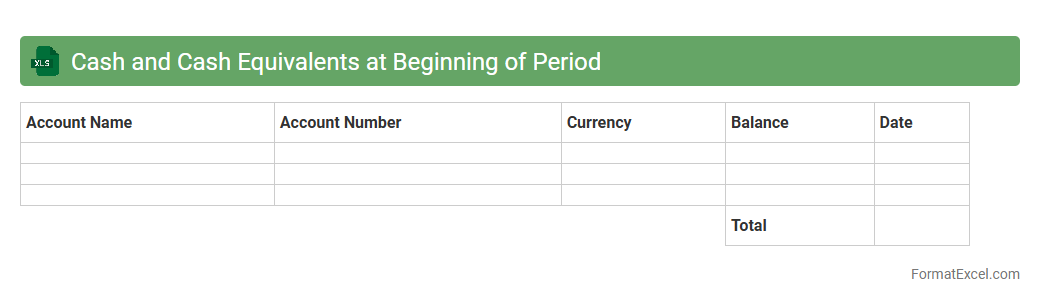
Cash and Cash Equivalents at Beginning of Period
Cash and Cash Equivalents at Beginning of Period in an Excel document represents the total amount of liquid assets available at the start of a financial period, including cash on hand and short-term investments that can be quickly converted to cash. This data is crucial for analyzing a company's liquidity position and cash flow management, enabling businesses to plan expenses, investments, and financing activities effectively. Using this information, financial analysts can track operational efficiency and ensure sufficient funds are available for upcoming obligations.
Cash and Cash Equivalents at End of Period
The
Cash and Cash Equivalents at End of Period Excel document summarizes a company's liquid assets available at the close of a financial period, including currency, bank accounts, and short-term investments. This data is crucial for assessing liquidity, ensuring enough funds to cover immediate liabilities, and supporting effective cash flow management. It enables financial analysts and business managers to make informed decisions regarding operational expenses, investment opportunities, and financial stability.
Depreciation and Amortization
A
Depreciation and Amortization Excel document is a financial tool designed to calculate and track the reduction in value of tangible and intangible assets over time. It helps businesses accurately allocate asset costs to expense accounts, ensuring compliance with accounting standards and improving financial reporting. Using this document enhances budgeting, forecasting, and tax planning by providing clear insights into asset value depreciation and amortization schedules.
Impairment Losses
An
Impairment Losses Excel document is a financial tool designed to track and calculate reductions in the value of assets, ensuring accurate representation of a company's financial health. It helps businesses identify when the carrying amount of an asset exceeds its recoverable amount, facilitating precise financial reporting and compliance with accounting standards. This document is essential for making informed decisions about asset management and maintaining transparency in financial statements.
Adjustments for Non-Cash Items
The
Adjustments for Non-Cash Items Excel document is a financial tool used to reconcile net income by adding back non-cash expenses such as depreciation, amortization, and stock-based compensation. It helps in preparing accurate cash flow statements by ensuring that reported earnings reflect actual cash movements rather than accounting entries. This document is essential for analysts and accountants to assess a company's liquidity and operational efficiency without the distortion of non-cash charges.
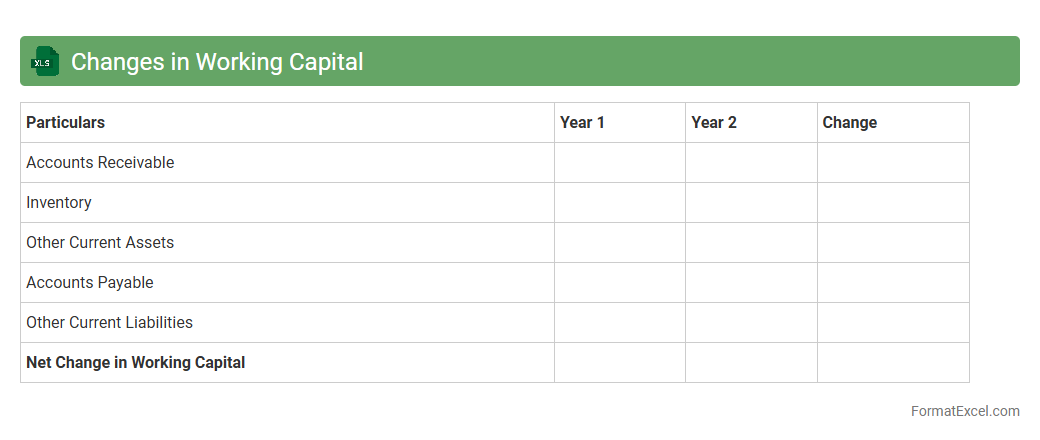
Changes in Working Capital
The
Changes in Working Capital Excel document tracks the variations in current assets and current liabilities, providing insights into a company's short-term financial health. It helps users monitor cash flow impacts from operational activities by analyzing components like accounts receivable, inventory, and accounts payable. Businesses leverage this tool to optimize liquidity management and improve decision-making for financing and investing.
Introduction to Cash Flow Statement Format
The cash flow statement format in Excel is designed to systematically track the inflow and outflow of cash during a specific period. It helps businesses monitor liquidity by categorizing cash activities into operating, investing, and financing sections. Excel provides a flexible platform to create and customize these statements for varied financial analysis needs.
Importance of Cash Flow Statements
Cash flow statements are essential for understanding a company's financial health beyond just profitability. They reveal how well a business generates cash to fund operations, pay debts, and invest in growth. Investors and creditors often rely on these statements to assess a company's ability to meet its financial obligations.
Key Components of a Cash Flow Statement
The three key components of a cash flow statement include operating activities, investing activities, and financing activities. Operating activities capture cash related to core business functions, while investing activities track asset purchases and sales. Financing activities reflect cash flow from borrowing and equity transactions.
Structure of a Cash Flow Statement in Excel
A cash flow statement in Excel usually follows a structured layout with each activity section clearly separated. Rows list specific cash flows, and columns represent time periods or categories. Using Excel's cell referencing and formulas enhances accuracy and allows automatic updates when data changes.
Step-by-Step Guide to Creating a Cash Flow Statement in Excel
Begin by listing all cash inflows and outflows under the three main sections. Input data into organized Excel rows and apply formulas to sum totals and calculate net cash flow. Finally, format the worksheet for clarity and add charts if needed to visualize cash movement.
Essential Excel Functions for Cash Flow Analysis
Key Excel functions such as SUMIF, VLOOKUP, and IFERROR facilitate efficient cash flow analysis. SUMIF helps aggregate specific cash data by criteria, while VLOOKUP aids in retrieving relevant financial details. Error handling with IFERROR ensures clean and reliable reports.
Sample Cash Flow Statement Template in Excel
A sample template typically includes predefined sections for operating, investing, and financing activities with formula-driven totals. It allows users to simply input values and observe automatic calculations of net cash flow. Such templates save time and minimize errors during preparation.
Common Mistakes in Cash Flow Statement Preparation
Common errors include mixing non-cash items with actual cash flows, omitting important transactions, and misclassifying activities. Ensuring proper categorization and double-checking figures can prevent inaccuracies. Attention to detail is crucial for reliable financial insight.
Tips for Effective Cash Flow Statement Presentation
Use clear headings, consistent formatting, and highlight key figures like net cash flow. Incorporating charts or graphs increases the visual appeal and enhances comprehension. Maintaining simplicity while ensuring completeness will improve stakeholder communication.
Downloadable Cash Flow Statement Excel Templates
Several online platforms offer free or premium cash flow statement Excel templates that can be customized for different business needs. These templates often include built-in formulas and formatting for immediate use. Downloading pre-designed templates speeds up the financial reporting process significantly.