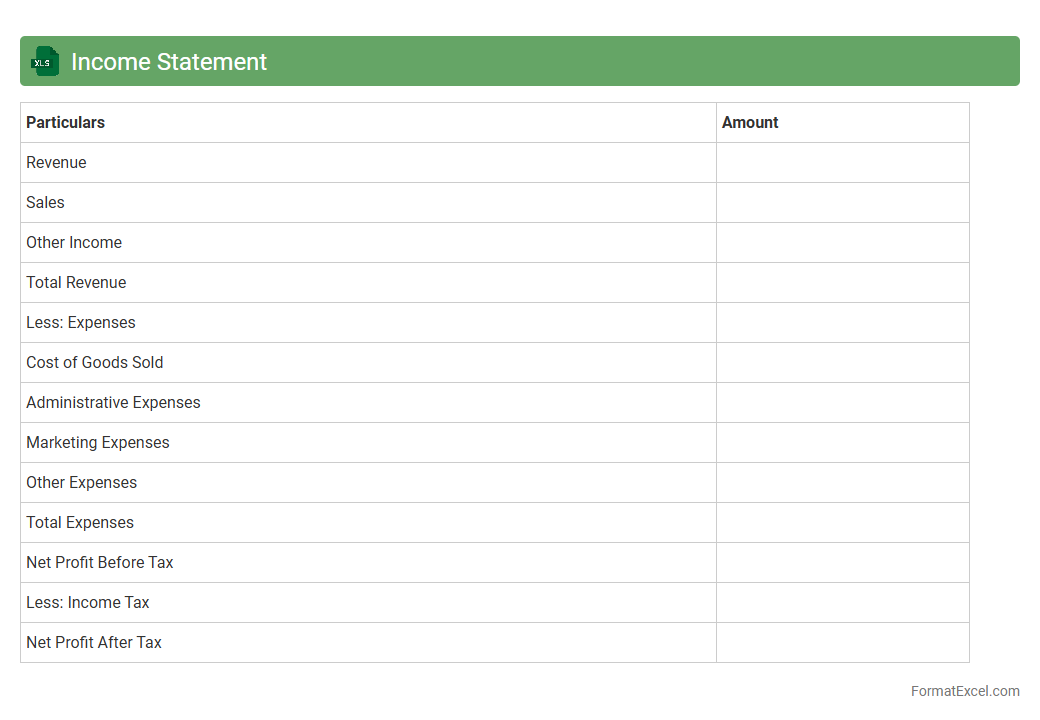
Income Statement
An
Income Statement Excel document is a financial tool that records and summarizes a company's revenues, expenses, and profits over a specific period. It enables businesses to analyze their financial performance, identify trends, and make informed decisions about budgeting and investment. The structured format of Excel enhances accuracy, facilitates customization, and allows for easy data manipulation and visualization.
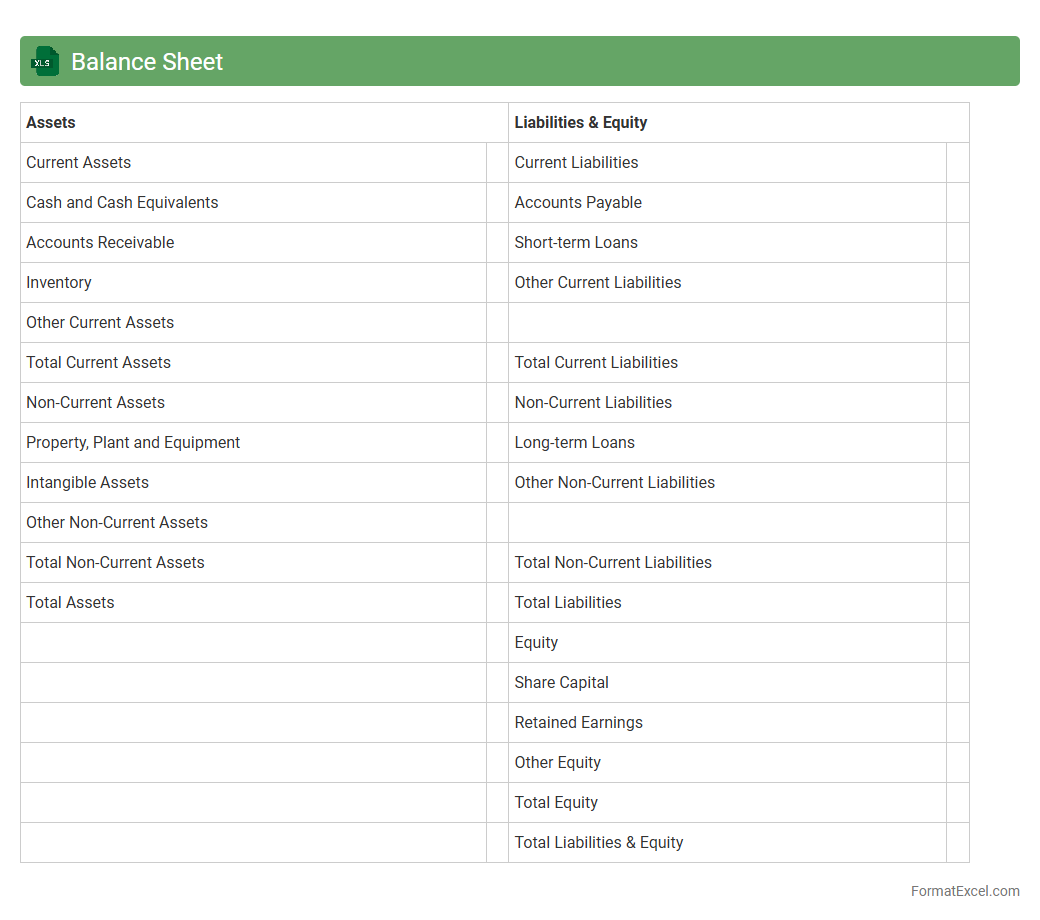
Balance Sheet
A
Balance Sheet Excel document is a digital financial statement that organizes an organization's assets, liabilities, and equity in a structured spreadsheet format. It is essential for tracking financial health, enabling users to quickly analyze current resources and obligations for better decision-making. This tool simplifies financial reporting, supports auditing processes, and helps forecast future financial performance effectively.
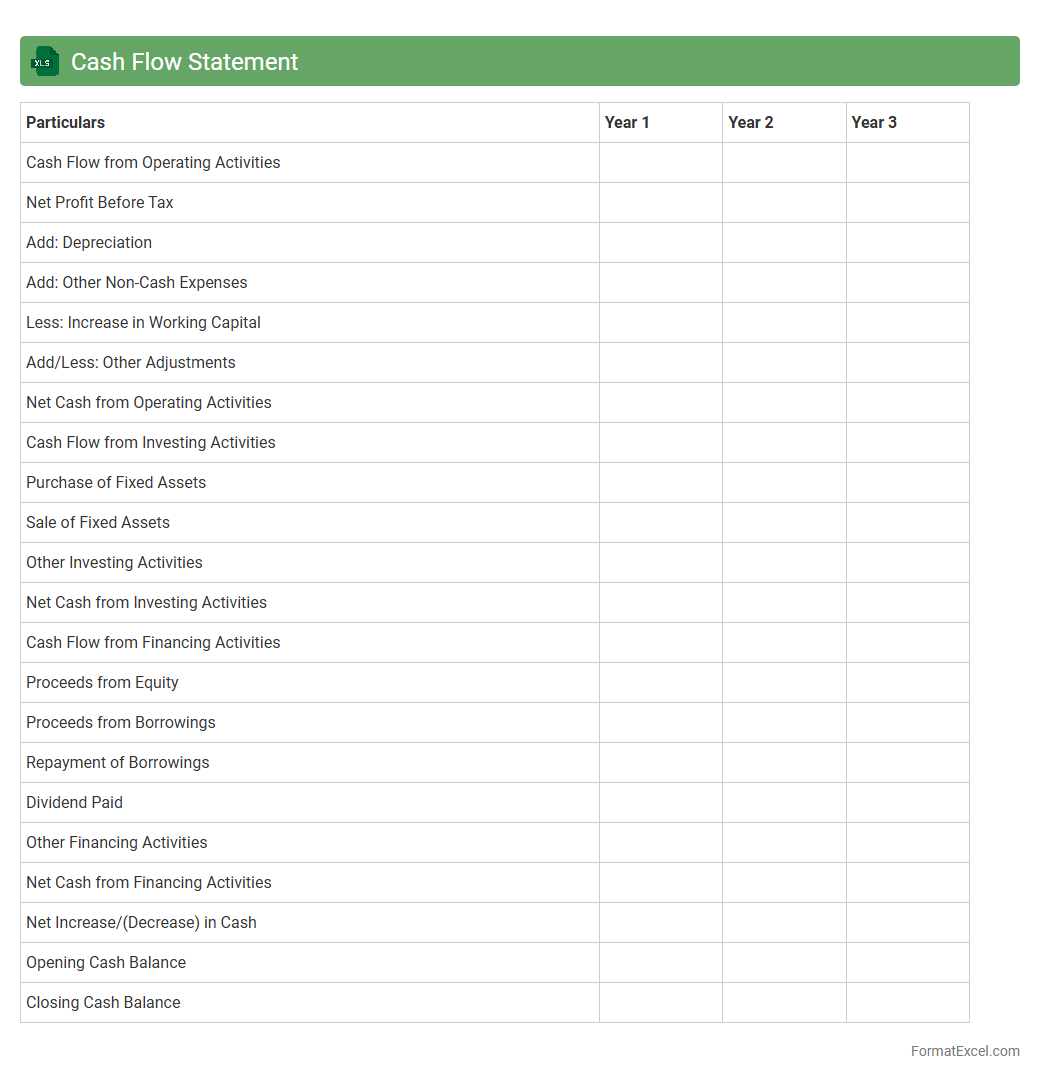
Cash Flow Statement
A
Cash Flow Statement Excel document is a financial tool that tracks the inflows and outflows of cash within a business over a specific period. It helps users monitor liquidity, manage expenses, and plan for future financial needs by providing a clear view of operating, investing, and financing activities. This document enables better decision-making by highlighting cash availability and ensuring the company meets its short-term obligations efficiently.
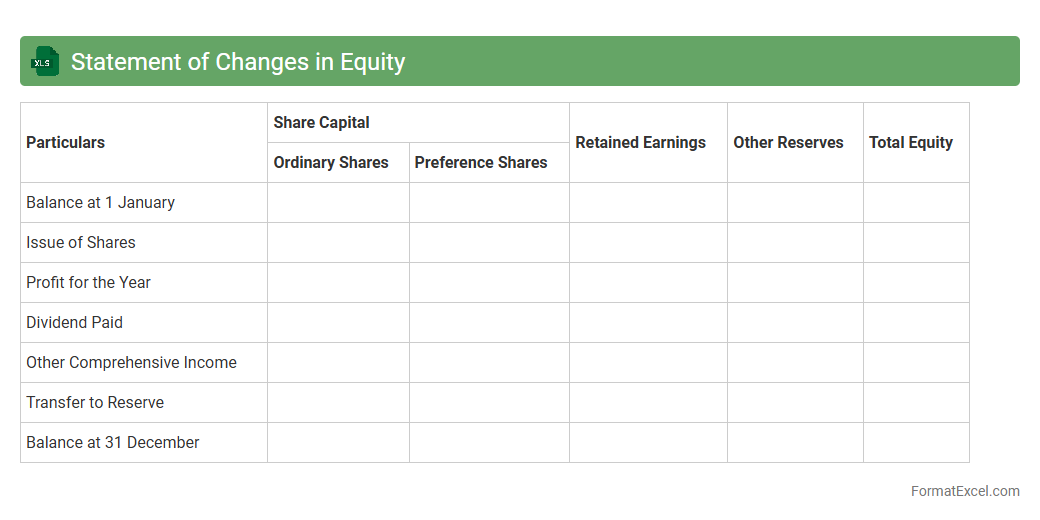
Statement of Changes in Equity
A
Statement of Changes in Equity Excel document tracks the movement in owners' equity over a specific period, detailing components like retained earnings, share capital, and other reserves. It provides a clear view of how profits, dividends, and other transactions impact the equity balance, aiding stakeholders in assessing financial health and ownership changes. This document is invaluable for investors, analysts, and management to monitor equity fluctuations and make informed decisions.
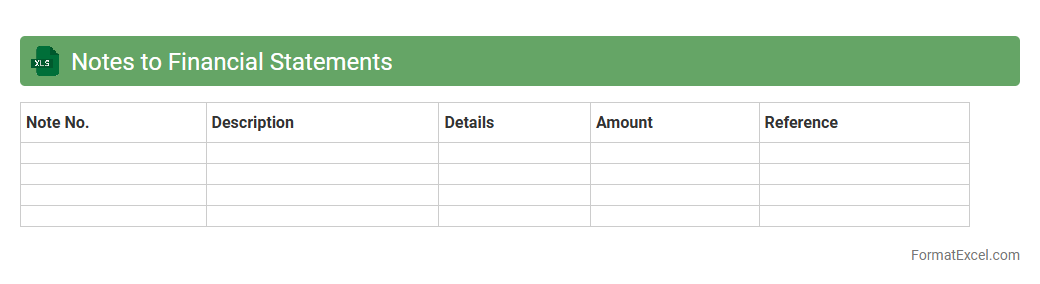
Notes to Financial Statements
The
Notes to Financial Statements Excel document provides detailed explanations and supplementary information related to the figures presented in the main financial statements. It enhances transparency by clarifying accounting policies, significant assumptions, and potential risks, aiding stakeholders in making informed decisions. This document is essential for analysts, investors, and regulators seeking comprehensive insights beyond basic financial data.
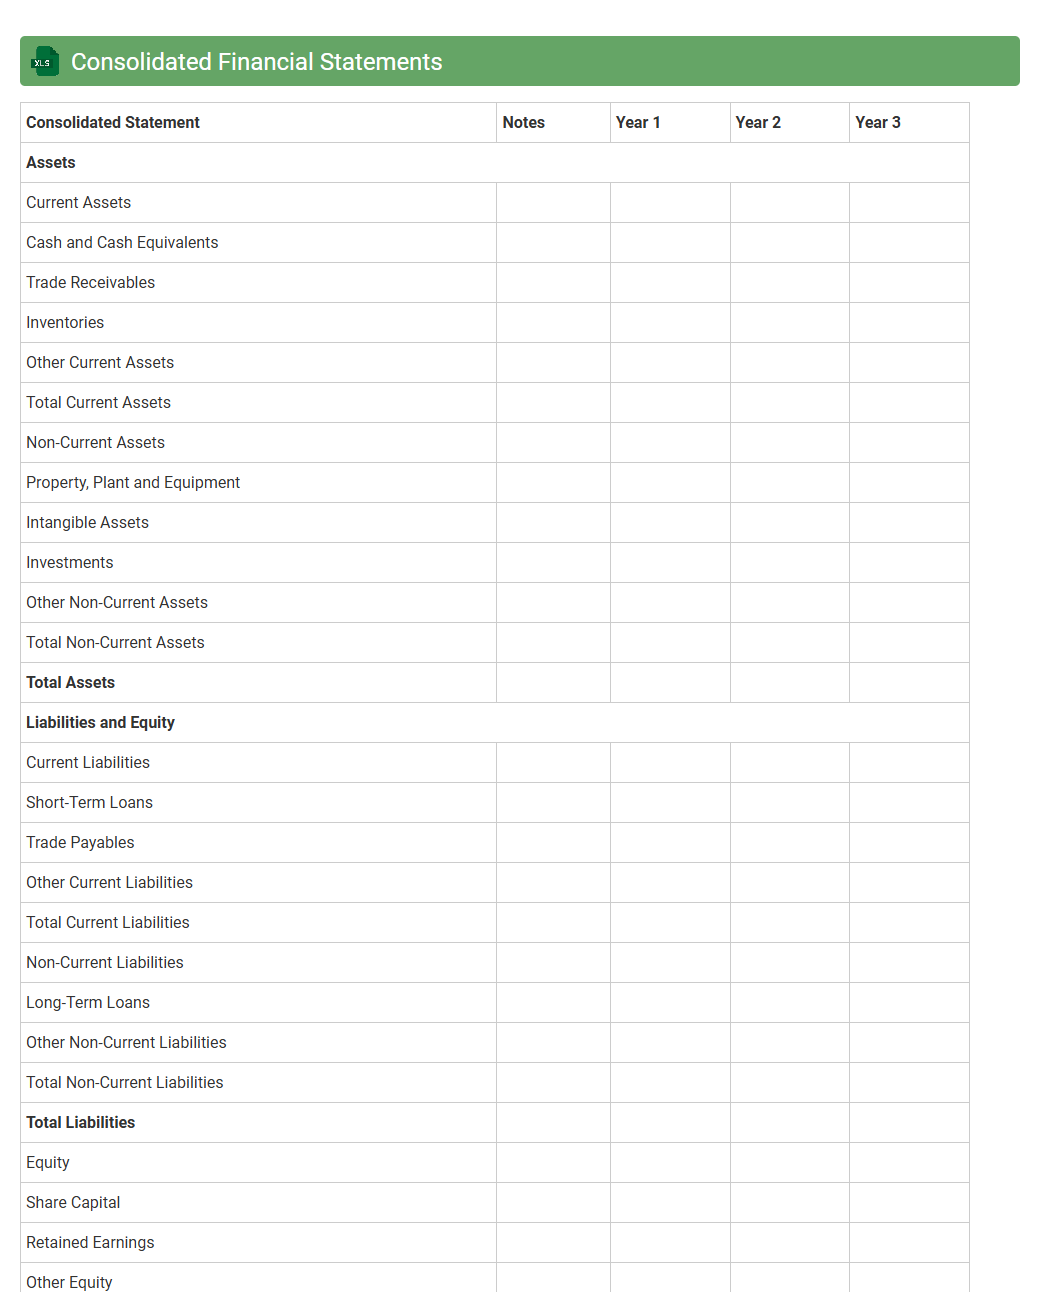
Consolidated Financial Statements
A
Consolidated Financial Statements Excel document compiles the financial data of a parent company and its subsidiaries into a single, unified report, providing a comprehensive overview of overall financial performance. This document streamlines financial analysis by enabling easier comparison, error detection, and data manipulation through Excel's powerful functions and formulas. It is essential for investors, management, and auditors who require clear insights into the company's consolidated financial health for strategic decision-making.
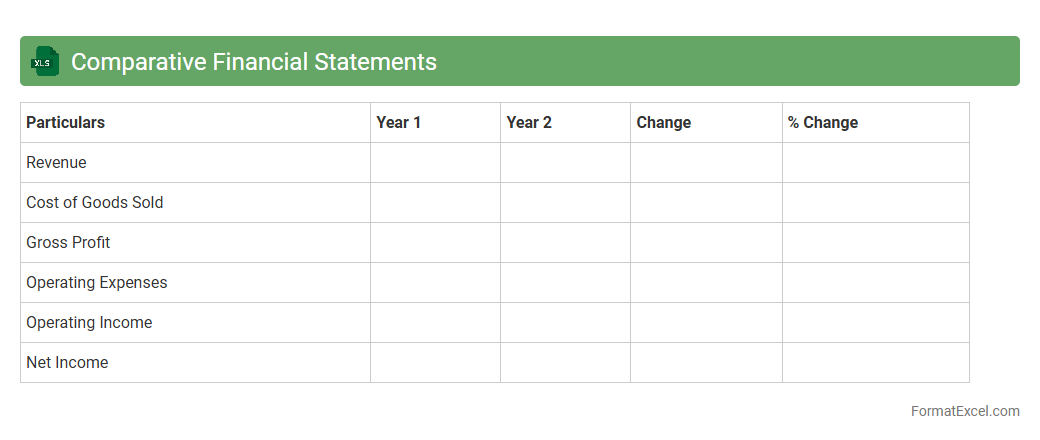
Comparative Financial Statements
A
Comparative Financial Statements Excel document systematically displays financial data from multiple periods side by side, enabling clear trend analysis and performance evaluation. This tool helps businesses identify growth patterns, fluctuations in revenue, expenses, and profitability, facilitating informed decision-making and strategic planning. Utilizing such documents improves financial transparency and supports benchmarking against industry standards or competitors.
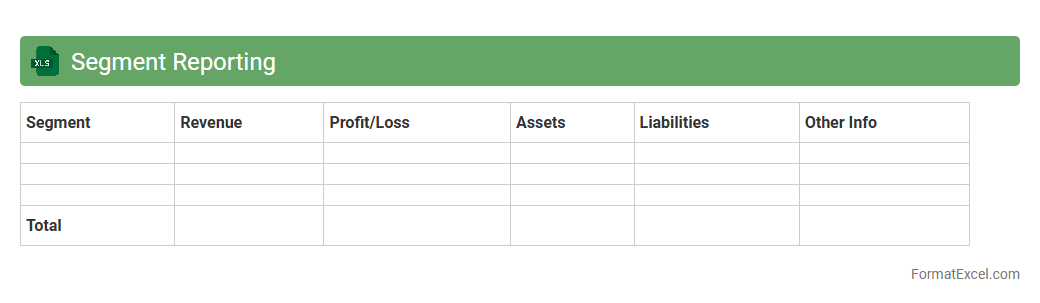
Segment Reporting
Segment Reporting Excel documents provide a structured format to analyze financial data across different business segments, enabling clear visibility into each segment's revenue, expenses, and profitability. These spreadsheets facilitate detailed comparison and performance tracking, supporting data-driven decision-making and strategic planning. Using a
Segment Reporting Excel document enhances transparency and helps identify growth opportunities within specific segments efficiently.
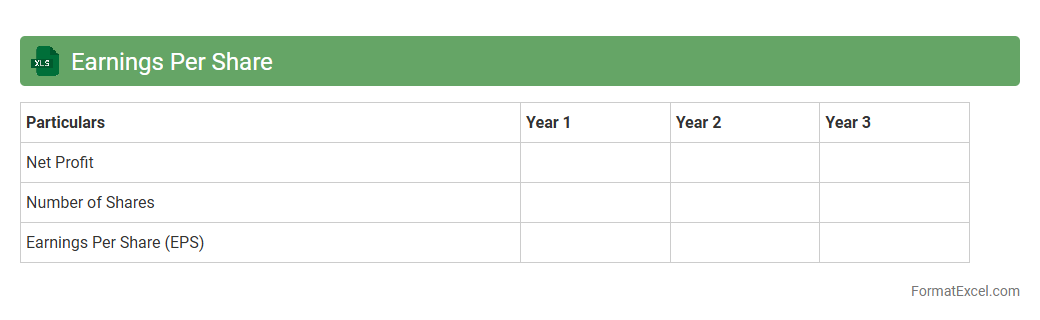
Earnings Per Share
An
Earnings Per Share (EPS) Excel document is a financial tool used to calculate and analyze a company's profitability on a per-share basis by dividing net income by the number of outstanding shares. This document is useful for investors and analysts to assess a company's financial health, compare performance across different periods, and make informed investment decisions. EPS Excel sheets often include detailed formulas and historical data visualization, enhancing precision and efficiency in financial analysis.
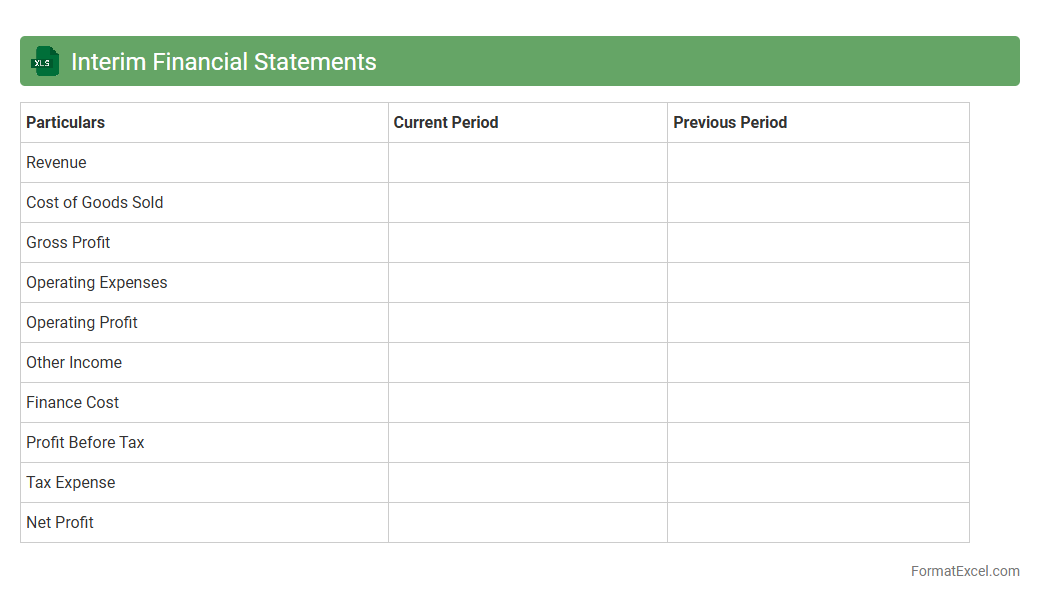
Interim Financial Statements
Interim Financial Statements excel document provides a structured and easily accessible format for summarizing a company's financial performance over a specific period within a fiscal year. It helps businesses track key metrics such as revenue, expenses, and net income, enabling informed decision-making and timely financial analysis. Using an
Interim Financial Statements excel sheet enhances accuracy and efficiency in monitoring ongoing financial health and supports compliance with reporting requirements.
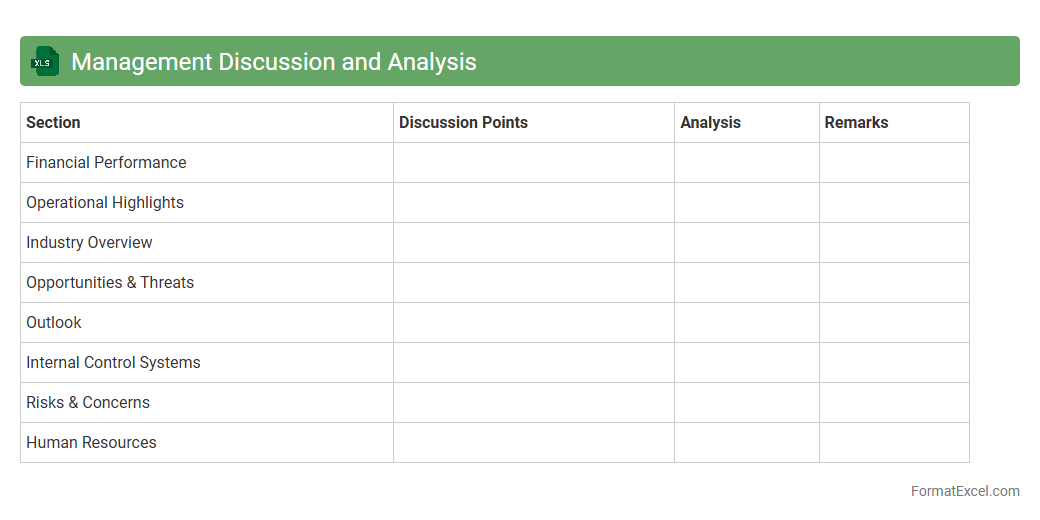
Management Discussion and Analysis
The
Management Discussion and Analysis (MD&A) excel document is a structured tool that organizes financial data, key performance indicators, and narrative explanations to provide a comprehensive overview of a company's operational results and financial condition. It helps stakeholders analyze trends, assess risks, and understand the management's strategic decisions in a clear, accessible format. By enabling detailed data analysis and visual representation, this document facilitates informed decision-making and enhances transparency in financial reporting.
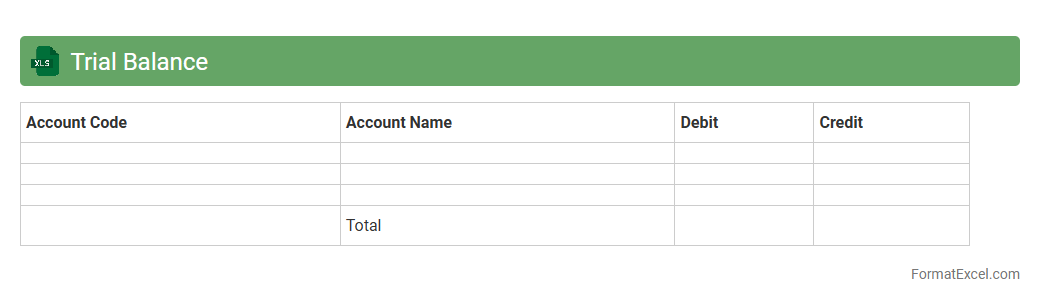
Trial Balance
A
Trial Balance Excel document is a financial report that lists all ledger account balances to ensure total debits equal total credits, confirming the accuracy of bookkeeping. It simplifies error detection by organizing account balances in a clear, structured format, making it easier to spot discrepancies. This document is essential for preparing financial statements and maintaining reliable accounting records.
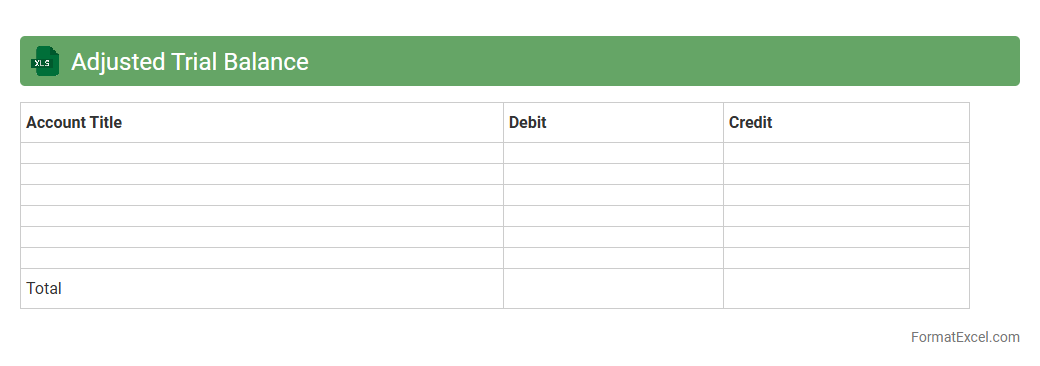
Adjusted Trial Balance
An
Adjusted Trial Balance Excel document is a financial statement that lists all account balances after adjusting entries have been made, ensuring that debits equal credits. It serves as a crucial tool for accurately preparing financial statements, identifying discrepancies, and verifying the accuracy of journal entries. This document streamlines the accounting process, improves error detection, and enhances financial reporting efficiency.
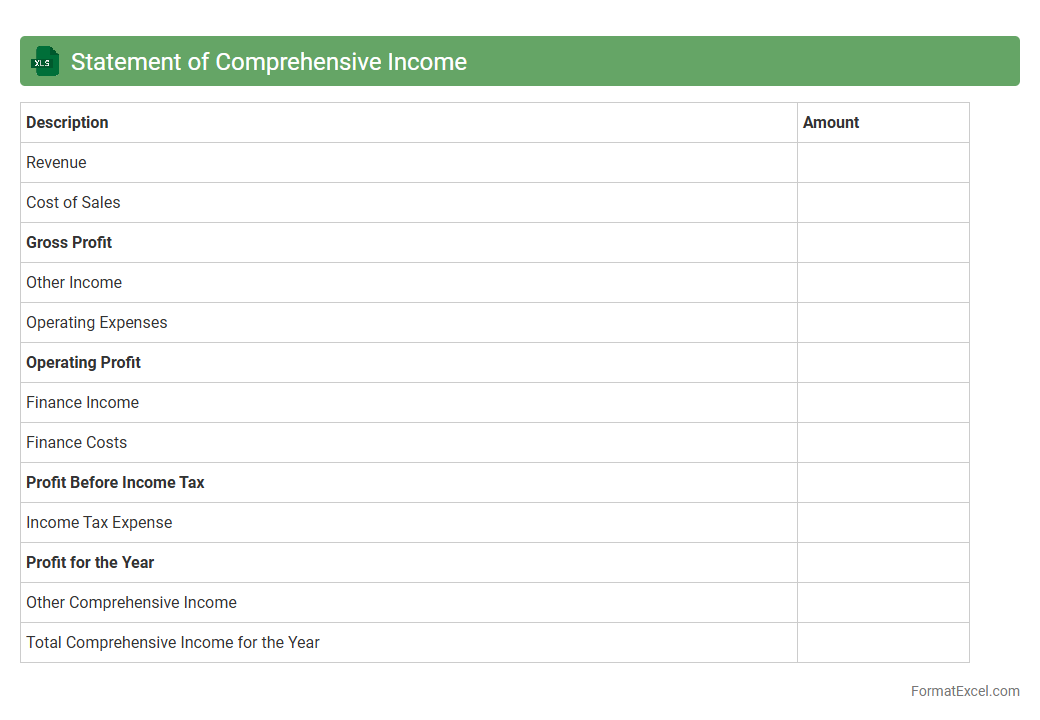
Statement of Comprehensive Income
A
Statement of Comprehensive Income Excel document systematically records all revenues, expenses, gains, and losses to provide a complete overview of a company's financial performance over a specific period. It helps users analyze net income alongside other comprehensive income items like foreign currency translation adjustments and unrealized gains on investments. This document is essential for stakeholders to evaluate the overall profitability and financial health beyond traditional net income, facilitating informed business decisions and financial planning.
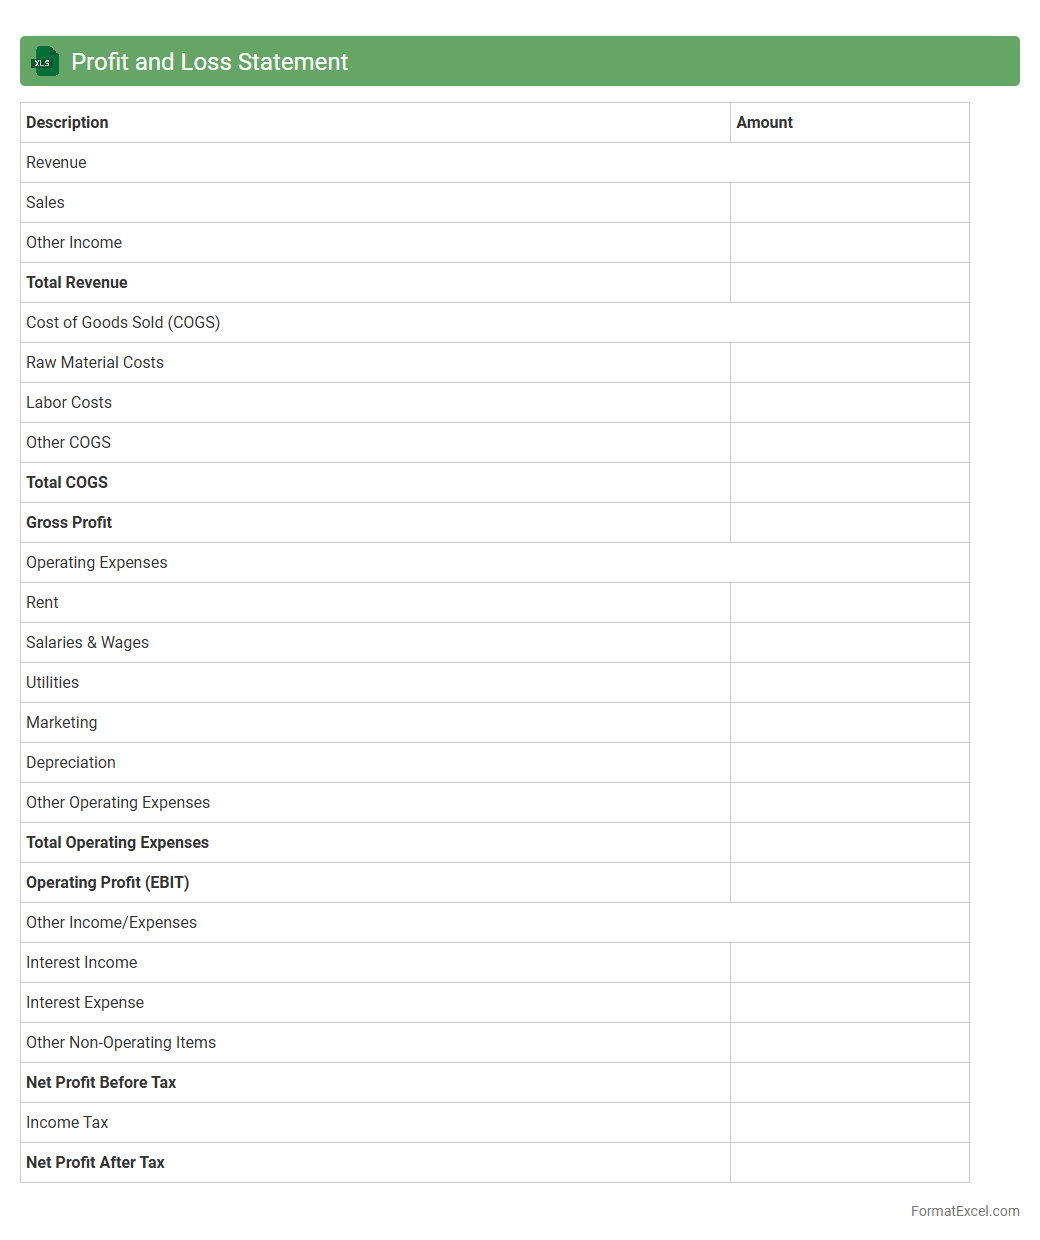
Profit and Loss Statement
A
Profit and Loss Statement Excel document is a financial tool used to record and analyze a company's revenues, costs, and expenses over a specific period. It provides a clear overview of net profit or loss, helping businesses track financial performance and make informed decisions. Utilizing this Excel document streamlines data organization, enables easy customization, and enhances reporting accuracy for improved financial management.
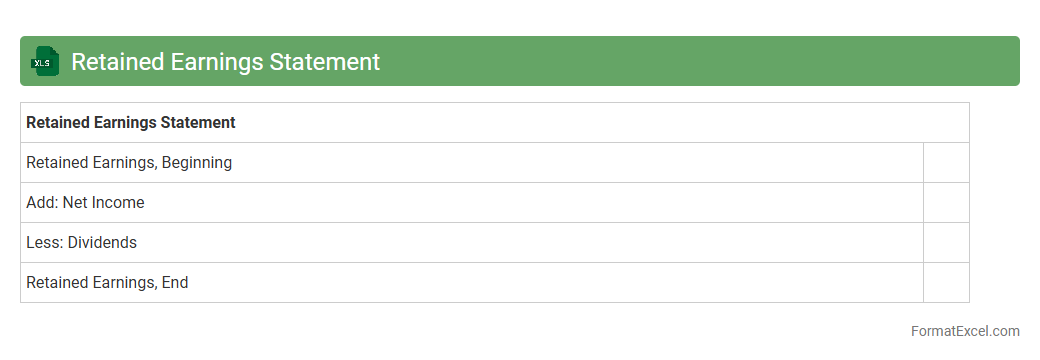
Retained Earnings Statement
A
Retained Earnings Statement Excel document is a financial tool used to track the changes in retained earnings over a specific period. It details net income, dividends paid, and other adjustments, providing a clear picture of accumulated profits reinvested into the company. This document is essential for investors and management to assess business growth and financial stability accurately.
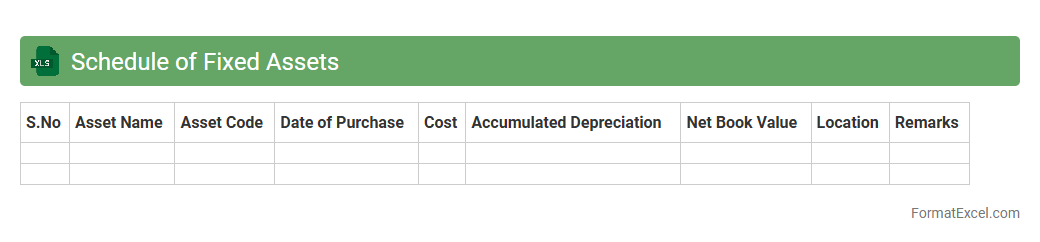
Schedule of Fixed Assets
A
Schedule of Fixed Assets Excel document is a detailed record that tracks all tangible long-term assets owned by a business, including purchase dates, costs, depreciation, and book values. This tool helps organizations maintain accurate financial records, facilitate asset management, and ensure compliance with accounting standards. By providing clear visibility into asset lifecycle and value, it supports informed decision-making related to budgeting, tax reporting, and capital investment planning.
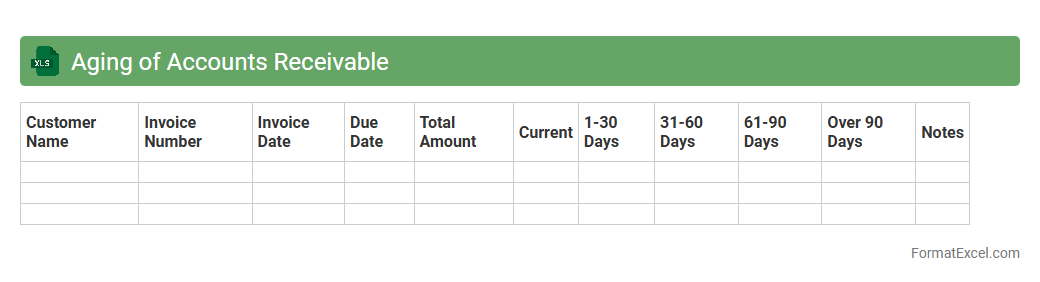
Aging of Accounts Receivable
The
Aging of Accounts Receivable Excel document categorizes outstanding customer invoices based on the length of time they have been unpaid, typically ranging from current to over 90 days past due. This tool helps businesses monitor cash flow, identify delinquent accounts, and prioritize collection efforts to improve financial stability. By regularly updating this document, companies can reduce bad debts and enhance credit management decisions.
Inventory Valuation Report
The
Inventory Valuation Report Excel document provides a detailed analysis of the value of inventory items based on current stock levels, purchase costs, and market prices. This report helps businesses track asset worth, manage stock efficiently, and make informed financial decisions by highlighting inventory costs and potential obsolescence. It is essential for maintaining accurate accounting records and optimizing working capital through better inventory control.
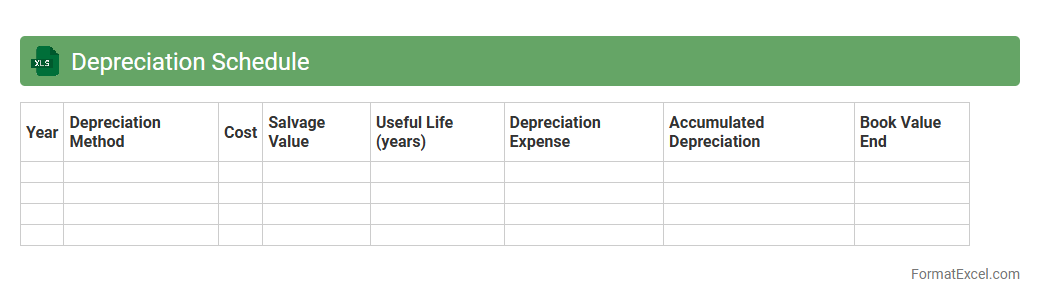
Depreciation Schedule
A
Depreciation Schedule Excel document systematically tracks the reduction in value of assets over time, helping businesses accurately calculate asset depreciation for financial reporting and tax purposes. It organizes key data such as asset purchase dates, cost, useful life, and accumulated depreciation in a clear, automated format, ensuring compliance with accounting standards. Using this tool improves budgeting, asset management, and financial forecasting by providing precise depreciation insights.
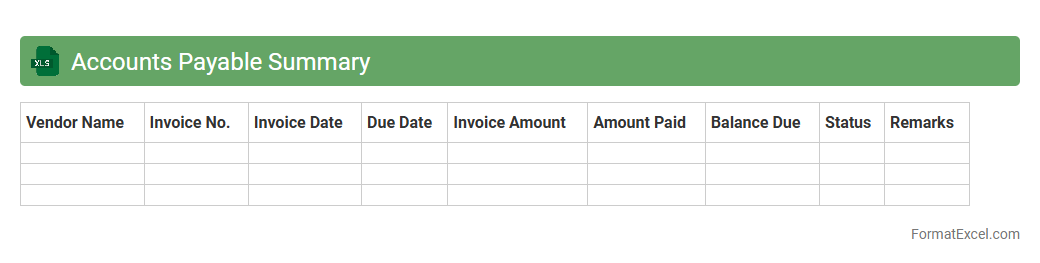
Accounts Payable Summary
The
Accounts Payable Summary Excel document consolidates all outstanding bills and payment obligations a company owes to its suppliers and vendors. It provides a clear overview of due dates, payment statuses, and total amounts payable, enabling efficient cash flow management and timely settlements. This summary helps businesses maintain accurate financial records, avoid late payment penalties, and improve vendor relationships by tracking liabilities effectively.
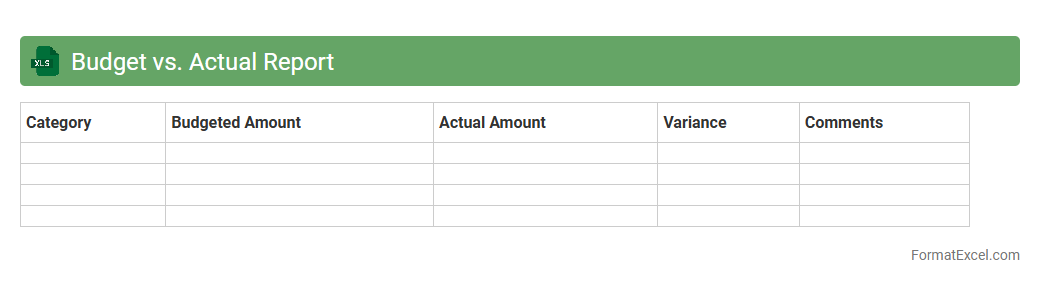
Budget vs. Actual Report
A
Budget vs. Actual Report Excel document compares planned financial targets against actual performance, highlighting variances in income, expenses, and overall budget adherence. This report enables businesses to track spending accuracy, identify areas of overspending or savings, and make informed decisions for resource allocation. Using this tool improves financial accountability and supports strategic planning by providing clear, data-driven insights into fiscal outcomes.
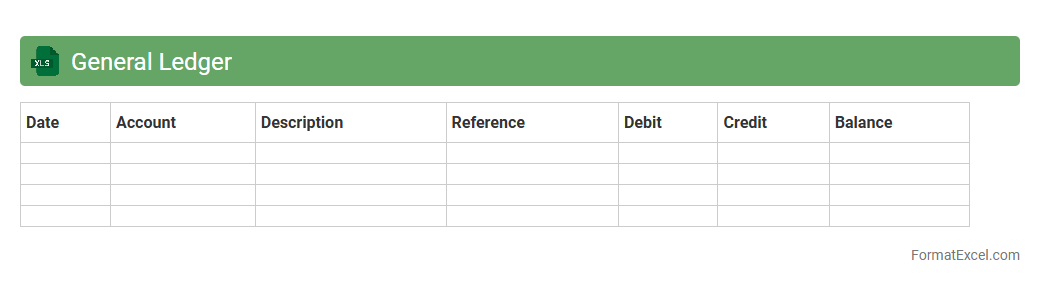
General Ledger
A
General Ledger Excel document is a digital spreadsheet used to record and organize all financial transactions of a business, encompassing accounts such as assets, liabilities, equity, revenues, and expenses. It helps maintain accurate financial records, supports reconciliation processes, and provides a clear overview of financial performance through easy-to-analyze data. Its customizable structure enables efficient tracking, reporting, and auditing, making it an essential tool for accountants and finance professionals.
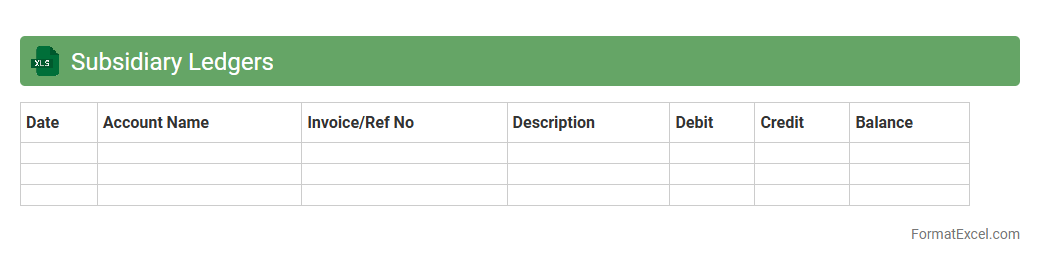
Subsidiary Ledgers
A
Subsidiary Ledgers Excel document is a detailed record-keeping tool that organizes individual accounts supporting the general ledger, such as accounts payable or accounts receivable. It enhances accuracy by tracking transactions at a granular level, making reconciliation and auditing processes more efficient. This system improves financial management by providing clear visibility into specific account activities without cluttering the main ledger.
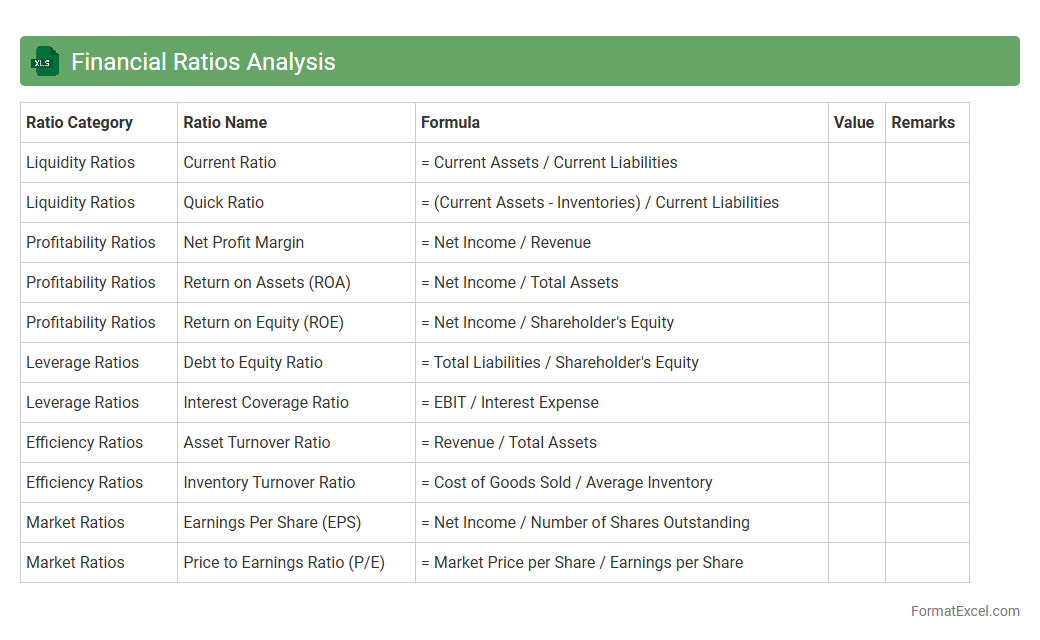
Financial Ratios Analysis
Financial Ratios Analysis excel document is a powerful tool designed for calculating and interpreting key financial ratios such as liquidity, profitability, efficiency, and solvency, enabling detailed evaluation of a company's financial performance. It helps stakeholders make informed decisions by providing clear insights into a firm's operational health and financial stability.
Financial ratios are essential for benchmarking, trend analysis, and comparing companies within the same industry, facilitating strategic planning and investment evaluations.
Introduction to Financial Statement Formats
Financial statement formats define the structured presentation of financial data, facilitating clear communication of an entity's financial position. Understanding these formats is crucial for accurate reporting and compliance. The structured layout ensures all relevant financial information is systematically conveyed.
Importance of Excel in Financial Reporting
Excel is a powerful tool used extensively for financial reporting due to its flexibility and advanced calculation features. It enables the efficient organization and analysis of financial data. Mastery of Excel functionalities enhances the accuracy and speed of financial statement preparation.
Key Components of Financial Statements
Essential components include the balance sheet, income statement, and cash flow statement, which together provide a comprehensive financial overview. Each component serves a distinct role in illustrating financial health. Familiarity with these fundamental components is vital for creating effective financial reports.
Standard Excel Templates for Financial Statements
Standard Excel templates offer pre-designed formats that simplify financial statement creation. These templates ensure consistency and reduce the likelihood of errors. Using a standardized template helps maintain professional and compliant financial reports.
Step-by-Step Guide to Creating Financial Statements in Excel
Creating financial statements in Excel involves setting up worksheets, entering data, and linking calculations appropriately. Following a step-by-step process guarantees accuracy and completeness. The methodical approach is key to successful financial statement generation.
Formatting Tips for Clarity and Consistency
Consistent formatting such as using bold headings, proper alignment, and color coding improves readability and professionalism. Clear formatting helps users understand financial data quickly. Implementing uniform formatting standards enhances communication of financial information.
Automating Calculations with Excel Formulas
Excel formulas automate complex calculations, saving time and reducing human error. Common formulas include SUM, IF, and VLOOKUP to dynamically update data. Utilizing automation through formulas increases efficiency in financial reporting.
Best Practices for Data Validation and Error Checking
Data validation techniques in Excel prevent incorrect data entry, while error checking identifies anomalies early. Employing drop-down lists and formula auditing tools ensures data integrity. Following best validation practices safeguards the accuracy of financial statements.
Common Mistakes to Avoid in Excel Financial Statements
Typical errors include incorrect formula references, inconsistent formatting, and omission of key data. Avoiding these mistakes prevents misleading reports and audit issues. Awareness of common pitfalls is essential for reliable financial documentation.
Downloadable Sample Financial Statement Formats in Excel
Access to downloadable sample formats enables users to learn from practical examples and adapt templates to their needs. These samples provide a foundation for efficient financial statement preparation. Utilizing sample Excel formats accelerates proficiency in financial reporting.