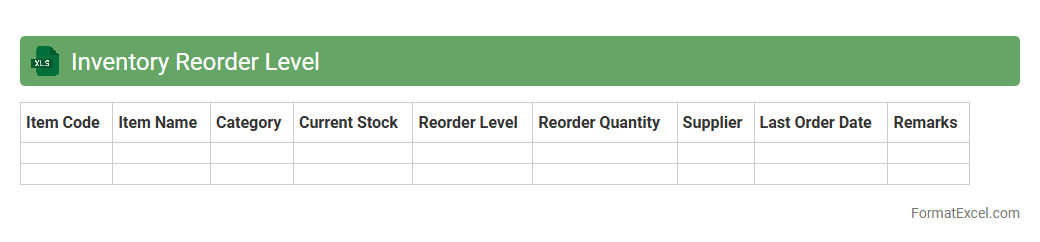
Inventory Reorder Level
An
Inventory Reorder Level Excel document is a practical tool used to monitor stock levels and determine the optimal point to reorder products before they run out. It helps businesses maintain sufficient inventory by automating calculations based on past sales data, lead times, and safety stock, thus preventing stockouts and overstock situations. This document enhances supply chain efficiency and supports informed decision-making for inventory management.
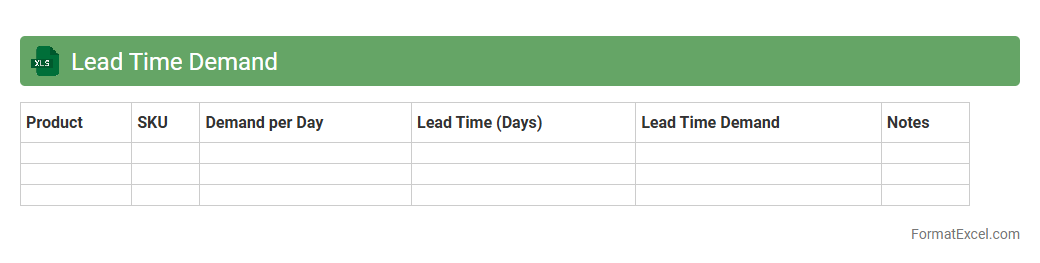
Lead Time Demand
The
Lead Time Demand Excel document is a tool designed to calculate the expected demand during the lead time for inventory replenishment. It helps businesses forecast the quantity of stock needed to avoid shortages or overstocking, enhancing supply chain efficiency. Utilizing accurate lead time demand data ensures optimal inventory levels and improves customer satisfaction by reducing delays.
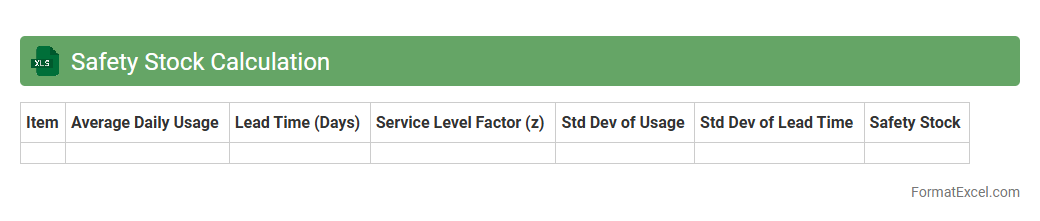
Safety Stock Calculation
Safety Stock Calculation Excel document is a tool designed to help businesses maintain optimal inventory levels by calculating the extra stock needed to prevent stockouts during demand fluctuations or supply delays. It uses historical data such as lead time, demand variability, and service level targets to provide an accurate
safety stock quantity. This document is useful for improving inventory management, reducing holding costs, and enhancing customer satisfaction through reliable product availability.
Demand Forecast Accuracy
The
Demand Forecast Accuracy Excel document is a tool used to measure the precision of sales predictions compared to actual sales data, enabling businesses to evaluate the effectiveness of their forecasting models. It helps identify discrepancies between forecasted and real demand, allowing companies to adjust inventory levels, reduce stockouts, and optimize supply chain operations. By improving forecast accuracy, organizations can enhance decision-making, minimize costs, and increase customer satisfaction.
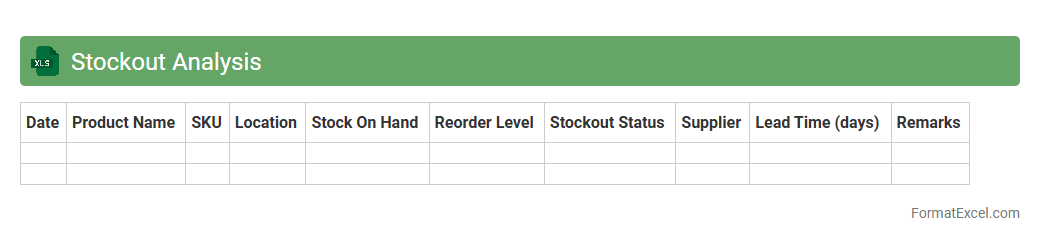
Stockout Analysis
A
Stockout Analysis Excel document systematically tracks instances when inventory is insufficient to meet demand, helping identify patterns and root causes of stock shortages. By analyzing sales data, reorder points, and lead times, it enables businesses to optimize inventory levels, reduce lost sales, and improve customer satisfaction. This tool aids supply chain managers in making data-driven decisions to prevent stockouts and enhance overall operational efficiency.
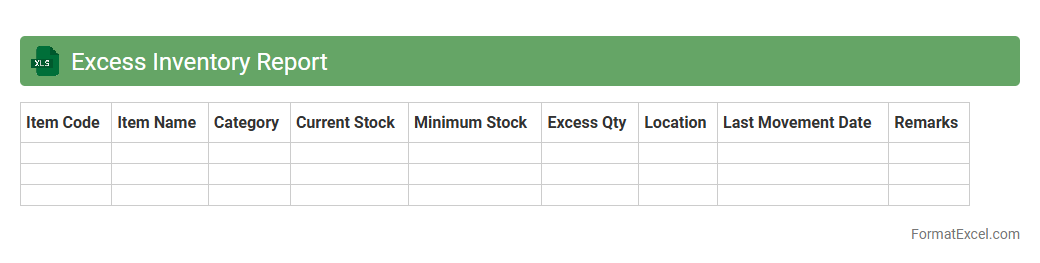
Excess Inventory Report
The
Excess Inventory Report in Excel is a detailed document that tracks surplus stock beyond current demand, helping businesses identify slow-moving or obsolete items. It enables efficient inventory management by highlighting areas to reduce holding costs and optimize warehouse space. This report supports better decision-making, improving cash flow and overall supply chain performance.
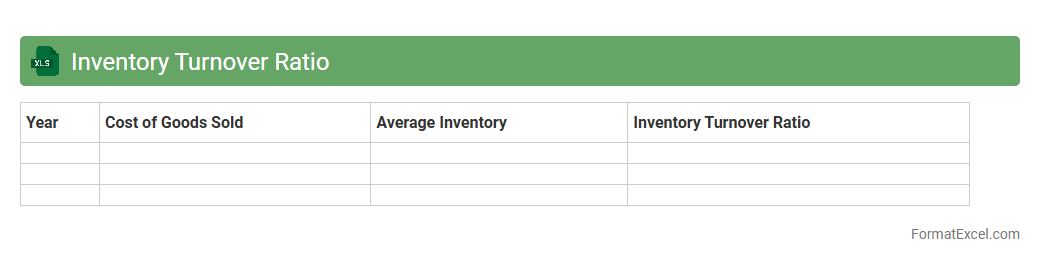
Inventory Turnover Ratio
The
Inventory Turnover Ratio Excel document is a specialized spreadsheet designed to calculate and analyze the efficiency of inventory management by measuring how often inventory is sold and replaced over a specific period. This tool enables businesses to track sales performance, optimize stock levels, reduce holding costs, and identify trends in product demand. By providing clear visualizations and automated calculations, it helps enhance decision-making for supply chain and financial management teams.
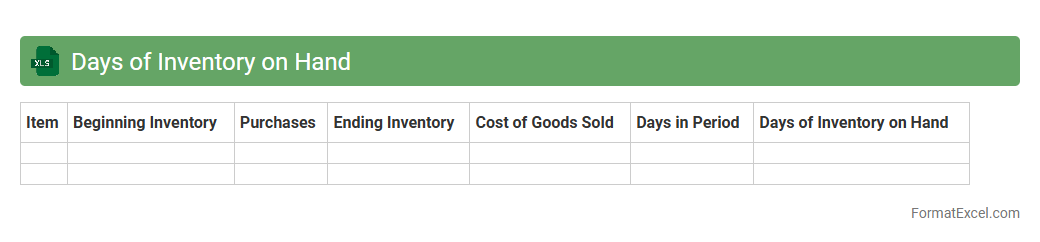
Days of Inventory on Hand
The
Days of Inventory on Hand (DOH) Excel document calculates the average number of days a company holds inventory before selling it, providing critical insights into inventory turnover and cash flow management. This tool helps businesses identify excess stock, optimize purchasing decisions, and improve supply chain efficiency by minimizing holding costs. Monitoring DOH supports better demand forecasting and enhances overall operational performance by aligning inventory levels with sales velocity.
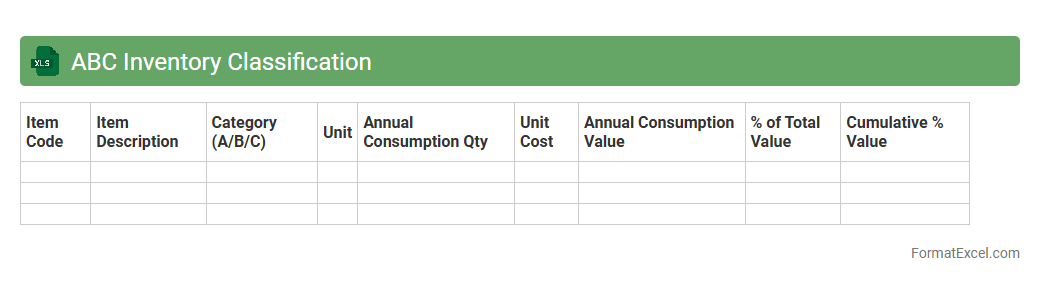
ABC Inventory Classification
ABC Inventory Classification Excel document is a powerful tool that categorizes inventory items based on their value and consumption rate, enabling businesses to prioritize management efforts effectively. This classification divides items into three groups: A items, which are the most valuable and require tight control; B items, with moderate value and control; and C items, which are low-value and need minimal attention. Using this
ABC Inventory Classification method helps optimize inventory turnover, reduce carrying costs, and improve overall supply chain efficiency.
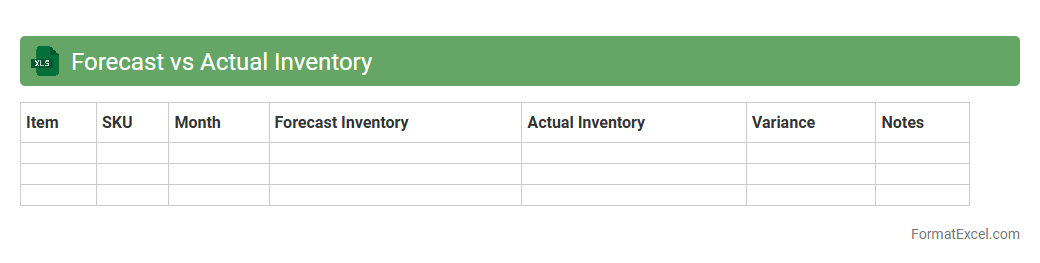
Forecast vs Actual Inventory
The
Forecast vs Actual Inventory Excel document compares predicted stock levels with real-time inventory data, enabling accurate tracking of supply chain performance. This tool helps identify discrepancies, optimize inventory management, reduce stockouts, and improve demand planning. Businesses rely on this comparison to enhance operational efficiency and make data-driven decisions for inventory control.
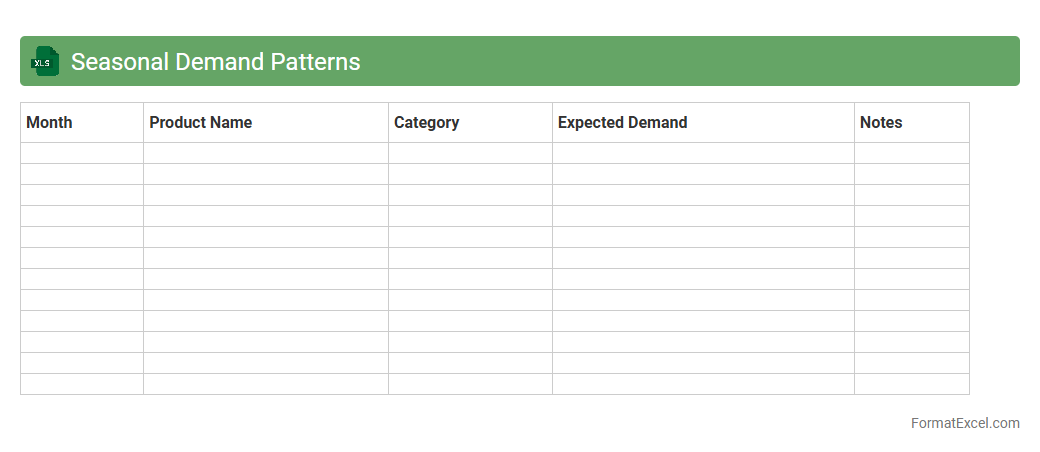
Seasonal Demand Patterns
The
Seasonal Demand Patterns Excel document is a powerful analytical tool that tracks and visualizes fluctuations in consumer demand across different time periods, typically categorized by seasons or months. It enables businesses to forecast inventory needs, optimize supply chains, and align marketing strategies with peak sales periods, reducing overstock and stockouts. Utilizing this document leads to more informed decision-making and improved operational efficiency by anticipating market dynamics accurately.
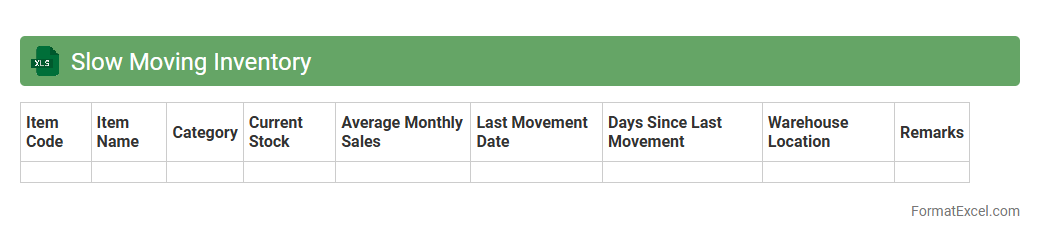
Slow Moving Inventory
A
Slow Moving Inventory Excel document is a detailed spreadsheet used to track products that have low sales velocity over a specific period. It helps businesses identify stagnant stock, optimize inventory management, and reduce carrying costs by highlighting which items need to be discounted, reordered less frequently, or removed. This tool improves cash flow and operational efficiency by allowing data-driven decisions for inventory control.
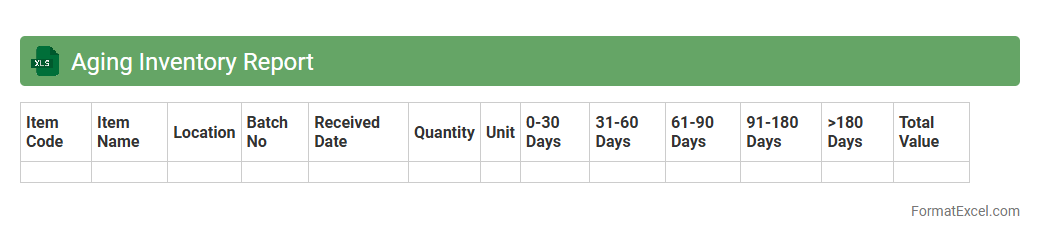
Aging Inventory Report
The
Aging Inventory Report Excel document categorizes and tracks outstanding inventory based on the length of time items have been in stock, typically segmented into periods such as 0-30, 31-60, and over 90 days. This report helps businesses identify slow-moving or obsolete inventory, enabling better stock management and reducing carrying costs. By providing detailed insights into inventory turnover, it supports informed decision-making for purchasing, sales strategies, and cash flow optimization.
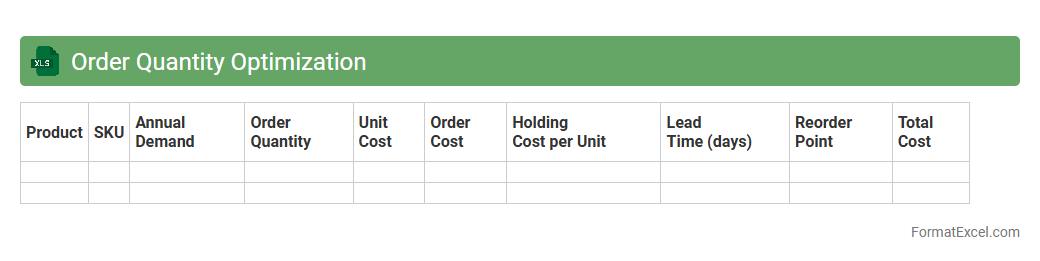
Order Quantity Optimization
Order Quantity Optimization excel document is a powerful tool designed to help businesses determine the ideal order size that minimizes costs related to inventory, purchasing, and stockouts. By analyzing key variables such as demand forecast, holding costs, and lead times, it enables precise control over stock levels, reducing waste and improving cash flow management. Utilizing this
Order Quantity Optimization document supports informed decision-making and enhances supply chain efficiency.
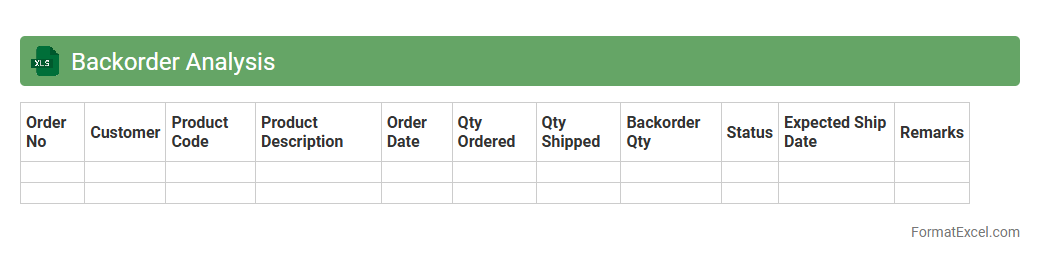
Backorder Analysis
A
Backorder Analysis Excel document tracks and evaluates products that are out of stock but still ordered by customers, helping businesses identify demand patterns and supply chain inefficiencies. By analyzing backorder data, companies can improve inventory management, forecast demand more accurately, and reduce lost sales. This tool supports better decision-making by highlighting critical products causing delays and enabling targeted interventions to optimize stock availability.
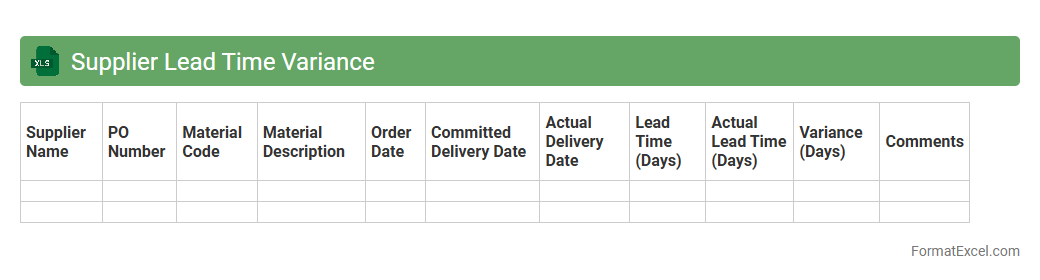
Supplier Lead Time Variance
The
Supplier Lead Time Variance Excel document tracks the differences between the promised and actual delivery times from suppliers, helping businesses monitor supply chain performance. By analyzing this variance, companies can identify delays, improve procurement planning, and enhance inventory management. This tool supports data-driven decisions to reduce risks associated with late deliveries, ensuring smoother production schedules and customer satisfaction.
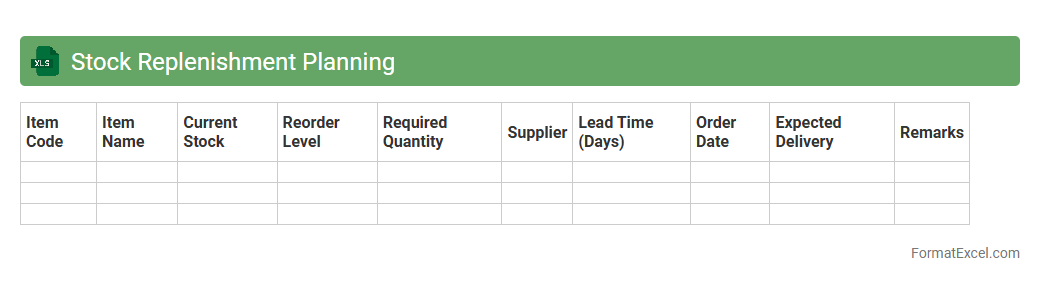
Stock Replenishment Planning
A
Stock Replenishment Planning Excel document is a tool designed to track inventory levels, forecast demand, and schedule timely restocking to avoid stockouts and overstock situations. It leverages historical sales data and lead times to optimize order quantities, ensuring supply chain efficiency and reducing carrying costs. Businesses use this document to enhance inventory accuracy, improve cash flow, and maintain consistent product availability for customers.
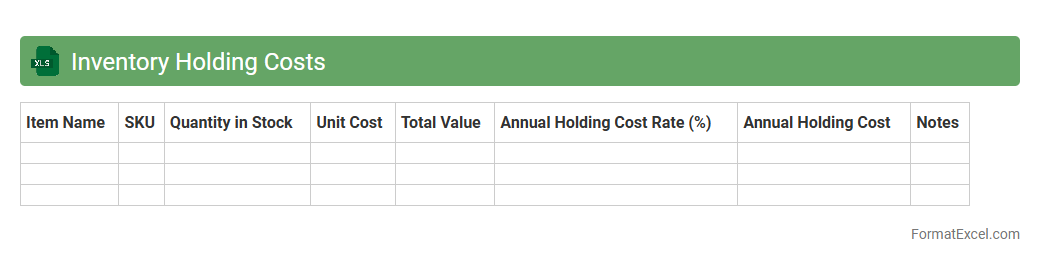
Inventory Holding Costs
An
Inventory Holding Costs Excel document systematically tracks expenses related to storing and maintaining inventory, including warehousing, insurance, depreciation, and obsolescence costs. It helps businesses analyze and optimize stock levels by providing clear visibility into carrying costs, enabling informed decisions about procurement and inventory turnover. This tool supports efficient cash flow management and reduces excess inventory, ultimately improving overall operational profitability.
Forecast Error Tracking
Forecast Error Tracking Excel documents measure and analyze the difference between predicted and actual outcomes, allowing businesses to monitor accuracy in sales, inventory, or financial forecasts. By identifying patterns and sources of errors, these tools help improve future predictions and optimize decision-making processes. Utilizing this method reduces risks, enhances resource allocation, and drives more reliable strategic planning.
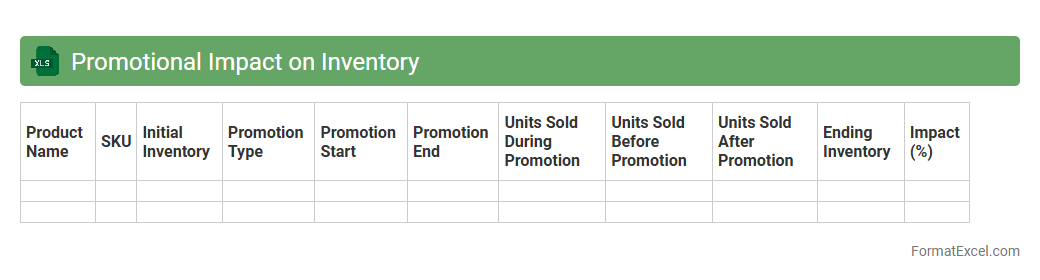
Promotional Impact on Inventory
The
Promotional Impact on Inventory Excel document quantifies the effects of marketing promotions on stock levels by analyzing sales data before, during, and after promotional campaigns. It helps businesses forecast inventory needs, minimize stockouts or overstock situations, and optimize supply chain efficiency. Utilizing this tool enables better decision-making regarding promotional planning and inventory management, leading to increased customer satisfaction and reduced operational costs.
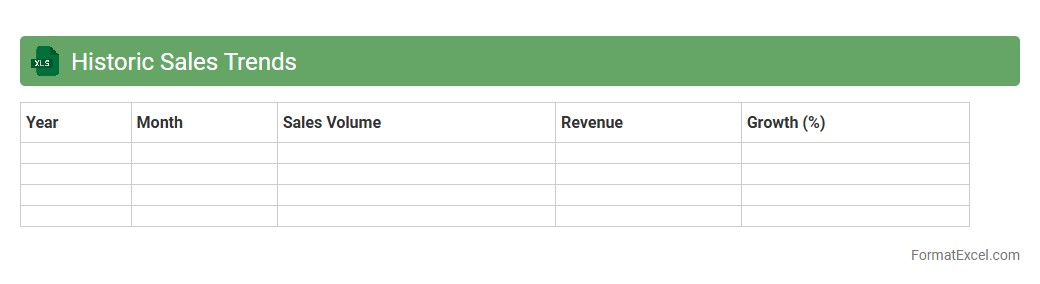
Historic Sales Trends
The
Historic Sales Trends Excel document is a comprehensive data analysis tool that tracks past sales performance over time, allowing businesses to identify patterns and seasonal fluctuations. It provides detailed insights into product demand, revenue changes, and customer purchasing behavior, which enables more accurate sales forecasting and inventory management. Utilizing this document helps optimize marketing strategies, improve budget allocation, and drive informed decision-making to enhance overall business growth.
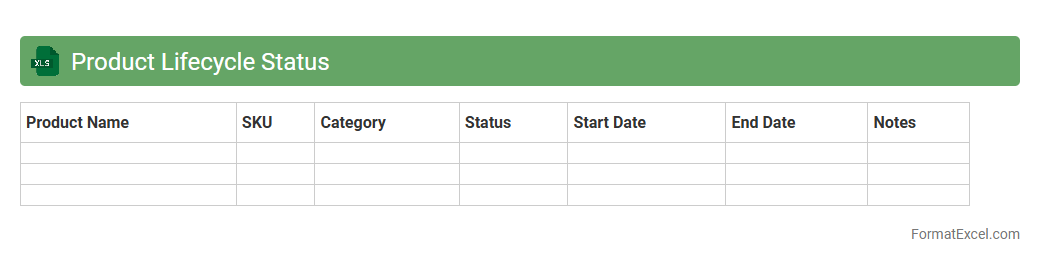
Product Lifecycle Status
The
Product Lifecycle Status Excel document tracks the stages of a product from introduction to decline, enabling efficient management of its progress and performance. It provides a clear overview of product phases such as development, launch, growth, maturity, and phase-out, helping teams make informed decisions about marketing, inventory, and resource allocation. Utilizing this document improves forecasting accuracy, supports strategic planning, and enhances communication across departments.
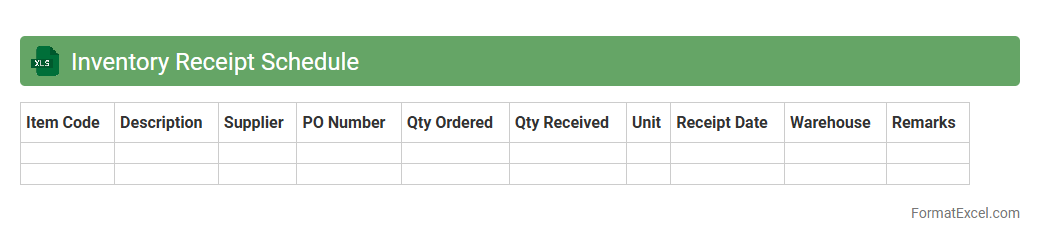
Inventory Receipt Schedule
An
Inventory Receipt Schedule Excel document organizes expected delivery dates and quantities of incoming stock, allowing businesses to track and manage inventory efficiently. It helps optimize supply chain operations by providing visibility into stock arrival timelines, preventing stockouts or overstock situations. This tool supports accurate forecasting and timely replenishment, improving overall inventory control and operational productivity.
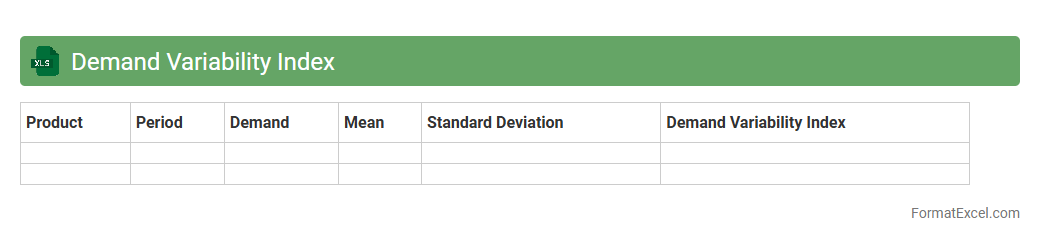
Demand Variability Index
The
Demand Variability Index Excel document is a tool designed to measure fluctuations in demand over time, helping businesses identify patterns and inconsistencies. It enables users to analyze historical sales data, calculate variability metrics, and forecast future demand more accurately. This insight supports inventory optimization, reduces stockouts, and improves supply chain efficiency.
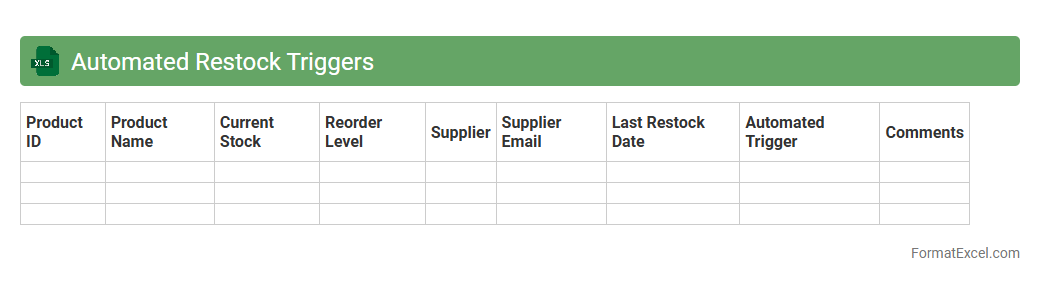
Automated Restock Triggers
The
Automated Restock Triggers Excel document is a tool designed to monitor inventory levels and automatically signal when stock replenishment is needed. This document helps businesses maintain optimal inventory by reducing human error and preventing stockouts or overstock situations. By leveraging real-time data integration and customizable thresholds, it streamlines supply chain management and improves overall operational efficiency.
Introduction to Inventory Forecast Format in Excel
An Inventory Forecast Format in Excel is a structured template designed to predict future stock requirements. It allows businesses to plan effectively by analyzing past sales and supply data. Utilizing Excel enhances data visualization and decision-making accuracy.
Importance of Accurate Inventory Forecasting
Accurate inventory forecasting prevents overstocking and stockouts, improving cash flow and customer satisfaction. It ensures that the right amount of inventory is available at the right time. This leads to optimized storage costs and operational efficiency.
Key Components of an Inventory Forecast Template
A comprehensive template includes sales history, lead time, reorder levels, and demand forecasts. Incorporating these key components ensures precise inventory planning. It also features dynamic tables and charts for quick analysis.
Essential Excel Functions for Inventory Forecasting
Functions like SUM, AVERAGE, VLOOKUP, and IF statements are crucial tools in building inventory forecasts. These Excel functions automate calculations and improve model accuracy. They allow seamless handling of large datasets.
Step-by-Step Guide to Creating an Inventory Forecast Format
Start by gathering historical data, then set formulas for demand and supply projections. Input reorder points and safety stock metrics as a step-by-step guide to build a solid forecast model. Finally, visualize trends with charts.
Sample Inventory Forecast Excel Template Structure
A typical structure includes columns for item ID, descriptions, sales data, forecasted demand, and inventory levels. This template structure helps organize data logically for easy updates. Rows represent individual inventory items for clarity.
Tips for Customizing Inventory Forecast Sheets
Tailor templates by adding columns for seasonal trends, supplier lead times, and priority items. Customization enhances relevance and reliability of your inventory forecast sheets. Use conditional formatting to highlight critical stock levels.
Common Mistakes in Excel Inventory Forecast Formats
Ignoring lead times, failing to update data regularly, and overcomplicating formulas are frequent errors. These common mistakes can lead to inaccurate forecasting and poor inventory decisions. Keep templates simple and data current.
Integrating Data Sources with Excel Inventory Forecasts
Connecting Excel with ERP systems, sales databases, or CRM tools streamlines data flow. This integration reduces manual errors and enhances forecast accuracy. Automated updates keep inventory forecasts up to date in real time.
Best Practices for Maintaining Inventory Forecast Templates
Regularly review and update forecast assumptions and formulas to reflect market changes. Maintain best practices such as backup versions and clear documentation for consistency. Continuous improvement ensures the forecasting model remains effective.