Quarterly Revenue Projection
A
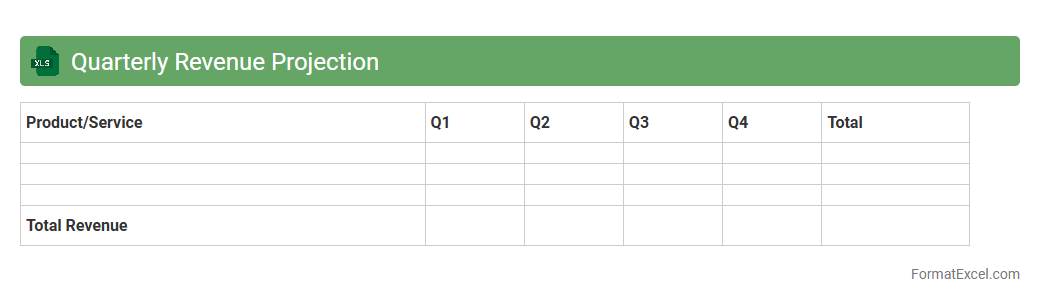
Quarterly Revenue Projection Excel document is a financial tool used to estimate future income over each quarter, based on historical data and market trends. This projection helps businesses anticipate cash flow, allocate resources effectively, and make informed strategic decisions. Accurate quarterly revenue forecasts enable companies to identify growth opportunities and manage potential financial risks proactively.
Quarterly Expense Estimate
A
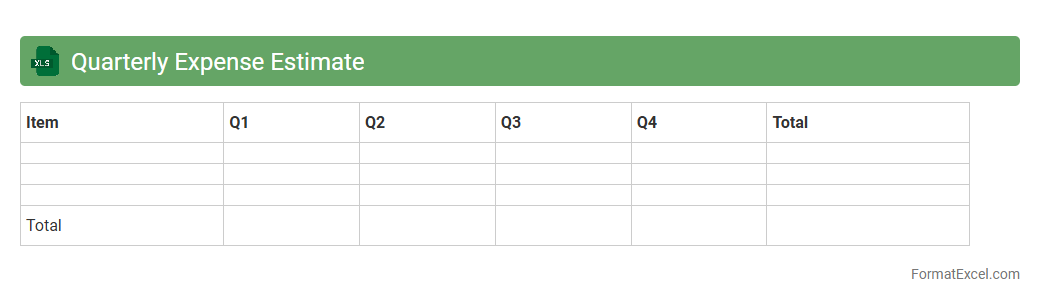
Quarterly Expense Estimate Excel document organizes projected costs for a three-month period, allowing accurate budgeting and financial planning. It helps track expenses against forecasts, identify spending patterns, and make informed decisions to control costs effectively. Using this tool enhances financial transparency and supports strategic allocation of resources within an organization.
Quarterly Sales Pipeline
The
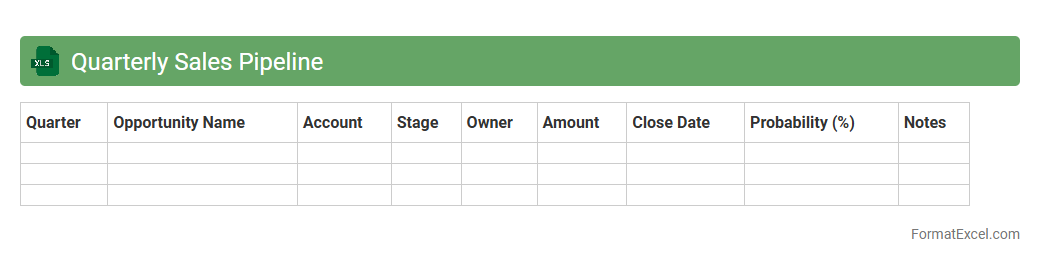
Quarterly Sales Pipeline Excel document is a structured tool that tracks potential sales opportunities and their progress over a specific quarter. It helps sales teams visualize the stages of each deal, forecast revenue, and identify bottlenecks in the sales process. By analyzing this data, businesses can make informed decisions, allocate resources effectively, and improve overall sales performance.
Quarterly Profit Outlook
The
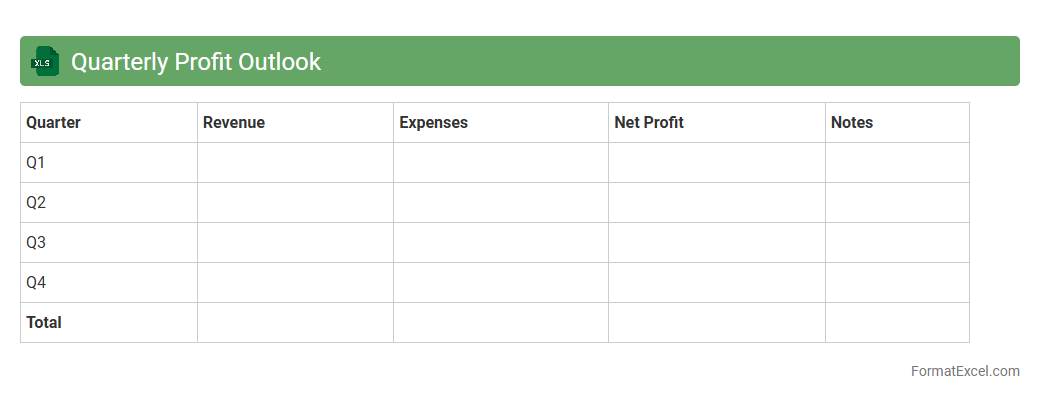
Quarterly Profit Outlook Excel document provides a detailed financial forecast highlighting projected revenues, expenses, and net profit for upcoming quarters. It helps businesses track performance trends, set realistic financial goals, and make informed budget allocation decisions. Utilizing this tool enhances strategic planning by offering clear visibility into potential profit fluctuations and growth opportunities.
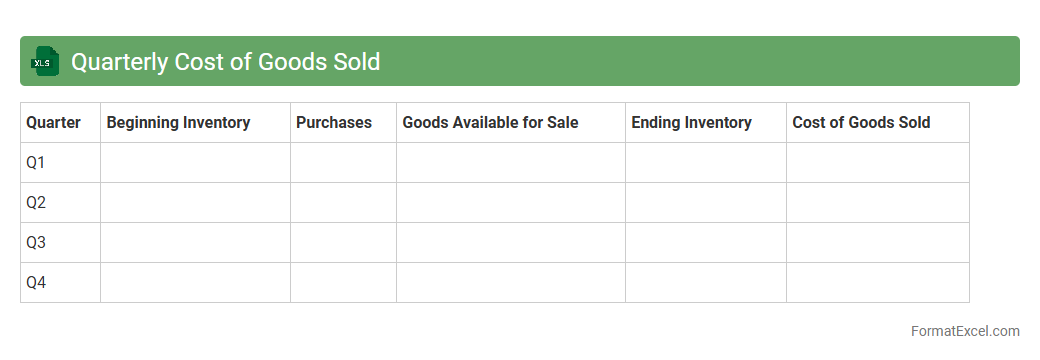
Quarterly Cost of Goods Sold
A
Quarterly Cost of Goods Sold (COGS) Excel document is a detailed financial tool that tracks and calculates the direct costs involved in producing goods over a three-month period. It helps businesses monitor expenses related to raw materials, labor, and manufacturing overhead, enabling accurate profit margin analysis and budgeting. Using this document improves financial planning and decision-making by providing clear insights into cost trends and operational efficiency.
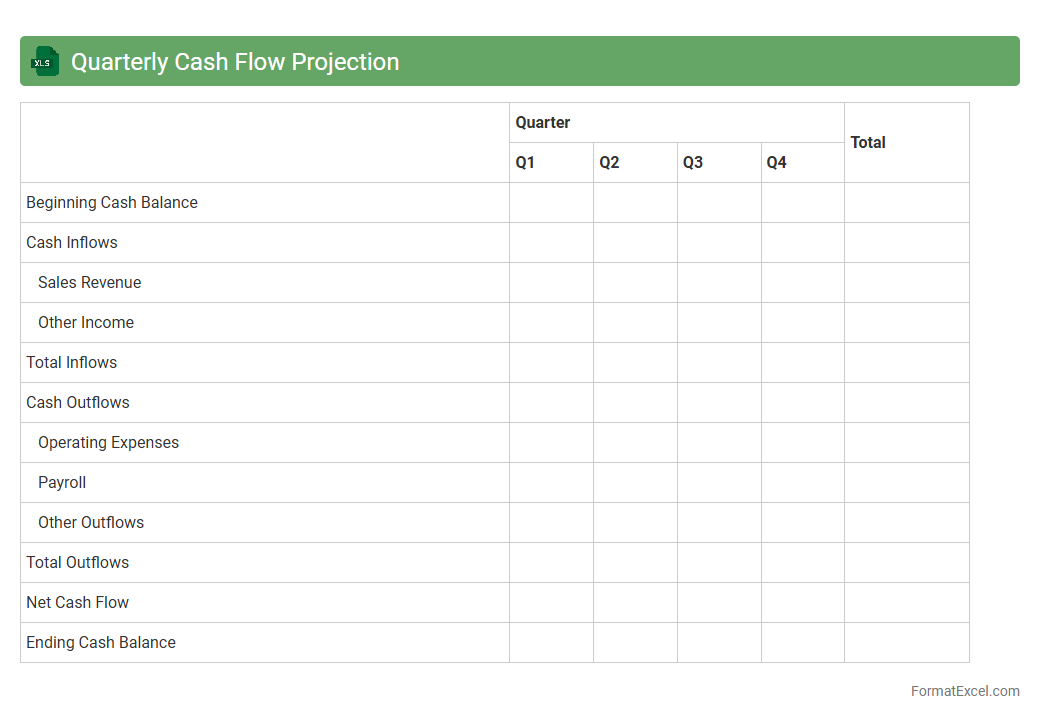
Quarterly Cash Flow Projection
A
Quarterly Cash Flow Projection Excel document forecasts the inflow and outflow of cash over three months, helping businesses anticipate liquidity needs and manage expenses effectively. It enables accurate tracking of revenue, operational costs, and capital expenditures, aiding in strategic financial planning. Utilizing this tool reduces the risk of cash shortages and supports informed decision-making for sustainable growth.
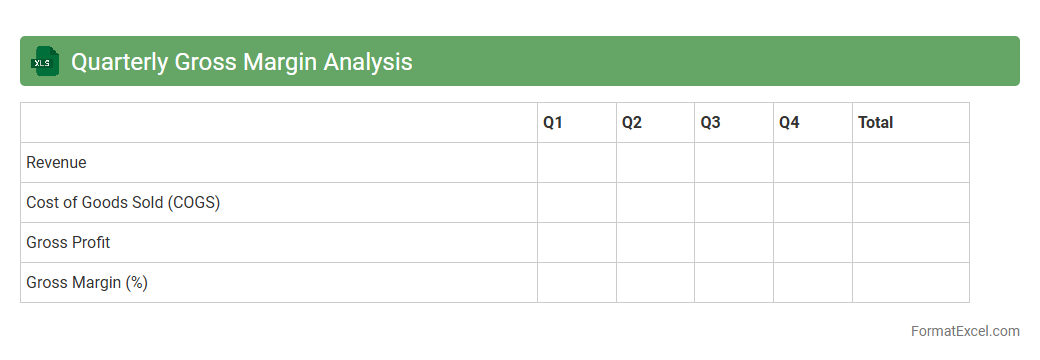
Quarterly Gross Margin Analysis
The
Quarterly Gross Margin Analysis Excel document is a financial tool designed to track and evaluate a company's gross margin across different quarters, enabling the identification of trends and variances in profitability. This analysis helps businesses measure the efficiency of production and pricing strategies by comparing revenue against the cost of goods sold. Using this document, decision-makers can make informed adjustments to improve margins and optimize overall financial performance.
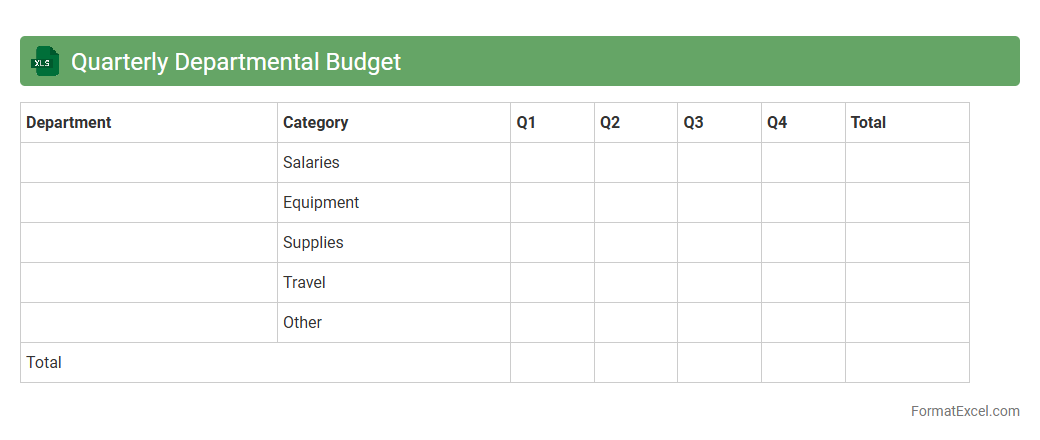
Quarterly Departmental Budget
The
Quarterly Departmental Budget Excel document is a structured financial tool designed to track and manage departmental expenses and revenues over a three-month period. It enables precise allocation of resources, monitoring of budget adherence, and identification of cost-saving opportunities. Utilizing this document enhances financial planning accuracy and supports informed decision-making within departments.
Quarterly Inventory Forecast
A
Quarterly Inventory Forecast Excel document projects stock levels and demand trends over a three-month period, enabling businesses to plan inventory purchases accurately. It helps optimize supply chain management by minimizing overstock and stockouts, ensuring cost efficiency and improved customer satisfaction. This tool supports strategic decision-making through data-driven insights on sales patterns and seasonality.
Quarterly Customer Demand Forecast
The Quarterly Customer Demand Forecast Excel document is a comprehensive tool designed to analyze and project customer demand over a three-month period. It helps businesses anticipate sales trends, manage inventory efficiently, and align production schedules with market needs. Utilizing
accurate demand forecasting enables better financial planning and improved customer satisfaction by ensuring product availability meets anticipated demand.
Quarterly Market Trend Analysis
A
Quarterly Market Trend Analysis Excel document systematically compiles and evaluates data on market performance, consumer behavior, and industry shifts over three-month periods. This tool enables businesses to identify emerging trends, forecast future market movements, and make data-driven decisions to optimize strategies. Utilizing this analysis helps enhance competitive advantage by providing clear insights into sales patterns, market demands, and economic factors.
Quarterly Sales by Region
The
Quarterly Sales by Region Excel document organizes sales data across different geographic areas for each quarter, providing clear insights into regional performance trends. It is useful for identifying high-performing markets, tracking progress against sales targets, and making informed strategic decisions to optimize resource allocation. By analyzing this data, businesses can enhance forecasting accuracy and tailor marketing efforts to maximize revenue growth.
Quarterly Product Performance
The
Quarterly Product Performance Excel document consolidates key sales, revenue, and customer feedback data for products over a three-month period, enabling clear trend analysis. This tool helps businesses identify best-performing products, adjust marketing strategies, and forecast future demand based on quantitative insights. By leveraging this document, decision-makers can optimize inventory management and enhance overall product portfolio profitability.
Quarterly Headcount Forecast
The Quarterly Headcount Forecast Excel document is a strategic tool used to predict and manage workforce requirements over a three-month period. It enables businesses to analyze trends in staffing needs, budget labor costs accurately, and align recruitment efforts with projected demand. By providing detailed insights into future hiring, the
Quarterly Headcount Forecast helps optimize resource allocation and supports proactive decision-making in talent management.
Quarterly Capital Expenditure Plan
The
Quarterly Capital Expenditure Plan Excel document is a financial tool designed to outline and track planned investments in long-term assets over a three-month period. It helps organizations allocate budgets, monitor expenditure against forecasts, and prioritize capital projects efficiently. By providing clear visibility into upcoming expenses, this plan supports strategic decision-making and ensures optimal resource management.
Quarterly Overhead Projection
The
Quarterly Overhead Projection Excel document is a detailed financial tool designed to estimate and track indirect business expenses over a three-month period. It helps organizations forecast overhead costs such as rent, utilities, and administrative salaries, enabling more accurate budgeting and cash flow management. By providing clear visibility into upcoming expenses, this document supports strategic decision-making and resource allocation.
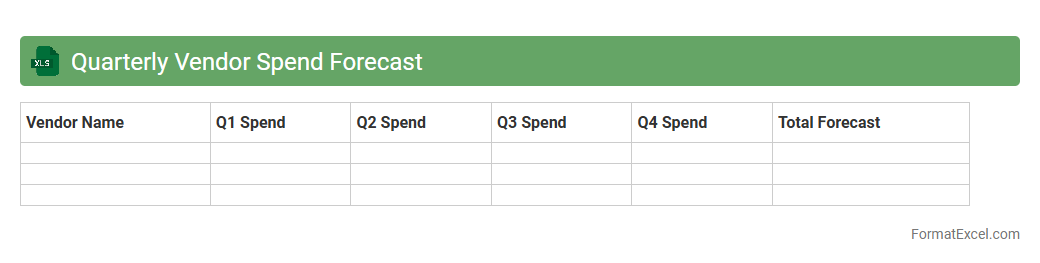
Quarterly Vendor Spend Forecast
The
Quarterly Vendor Spend Forecast Excel document is a detailed financial tool designed to project vendor expenses over a three-month period. By analyzing historical purchase data and upcoming contract obligations, it helps businesses anticipate cash flow requirements and identify cost-saving opportunities. This forecast enables more accurate budgeting, vendor negotiations, and strategic procurement planning.
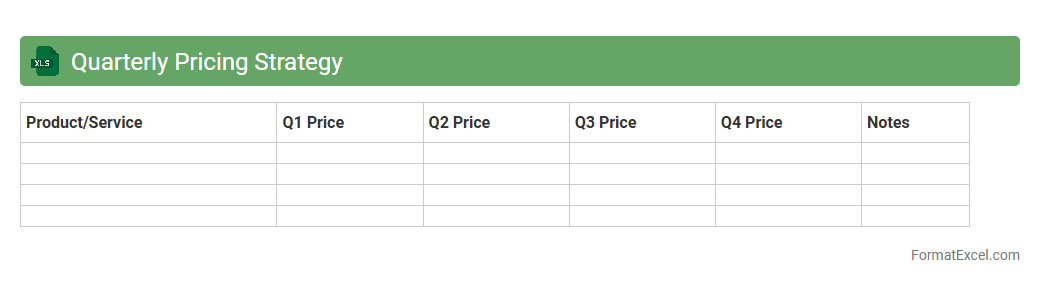
Quarterly Pricing Strategy
The
Quarterly Pricing Strategy Excel document serves as a comprehensive tool for analyzing and setting product prices based on market trends, competitor pricing, and sales data across each quarter. It enables businesses to adjust pricing dynamically to maximize revenue and maintain competitiveness within fluctuating market conditions. Using this document helps streamline decision-making, forecast financial outcomes, and optimize profit margins effectively.
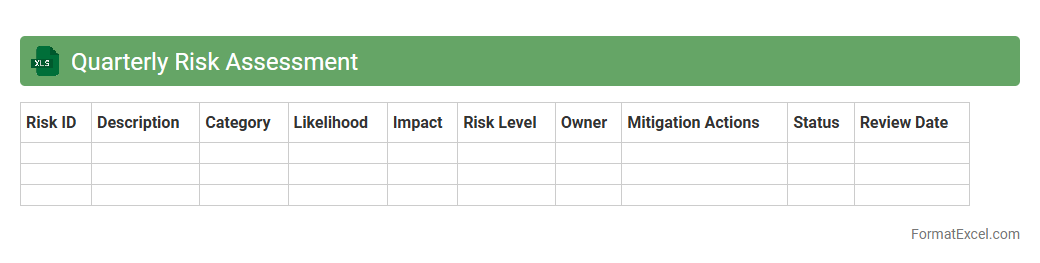
Quarterly Risk Assessment
A
Quarterly Risk Assessment excel document is a structured tool designed to identify, evaluate, and prioritize potential risks within an organization every three months. It helps track risk factors, their impact, and mitigation strategies in a systematic manner, enabling proactive decision-making. This document enhances risk management by providing clear insights and facilitating regular reviews to minimize financial, operational, and compliance threats.
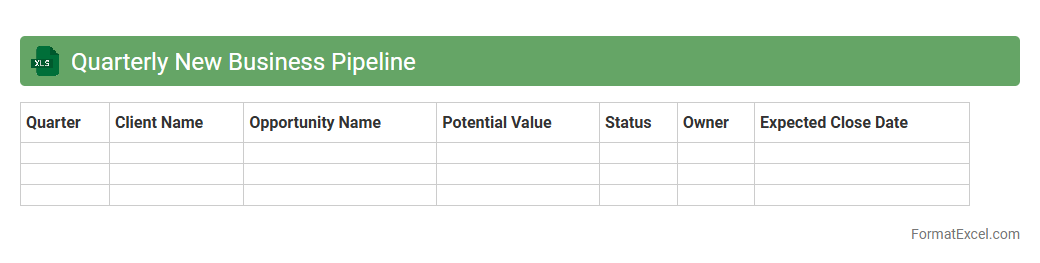
Quarterly New Business Pipeline
The
Quarterly New Business Pipeline Excel document is a strategic tool designed to track and manage prospective sales opportunities within a three-month period. It provides a structured overview of potential clients, deal stages, projected revenues, and closing timelines, enabling sales teams to prioritize efforts and forecast revenue accurately. This document is essential for optimizing sales strategies, enhancing pipeline visibility, and improving quarterly performance analysis.
Quarterly Accounts Receivable Forecast
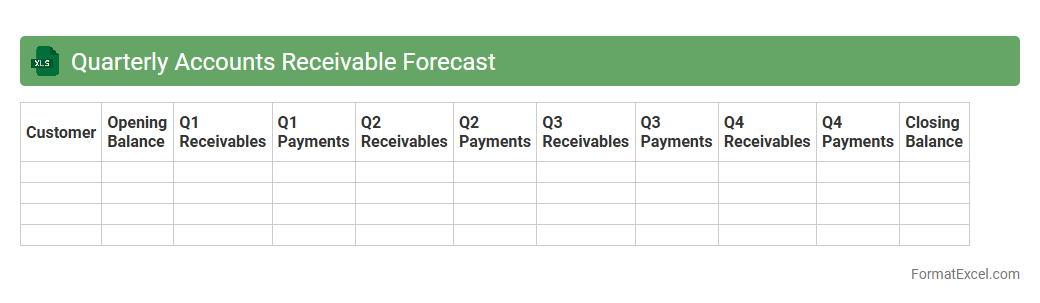
The
Quarterly Accounts Receivable Forecast Excel document projects outstanding customer payments over a three-month period, helping businesses anticipate cash flow and manage credit risk effectively. It organizes detailed invoices, payment due dates, and customer payment behavior to provide accurate financial forecasting and enhance decision-making. This tool supports timely collections and improves financial planning by highlighting trends and potential liquidity gaps.
Quarterly Accounts Payable Forecast
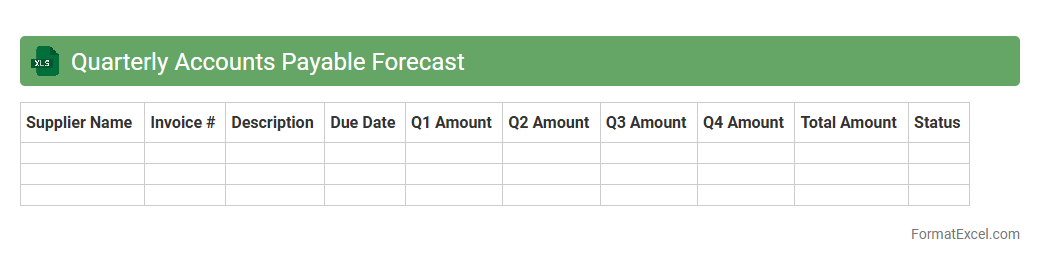
A
Quarterly Accounts Payable Forecast Excel document is a financial tool that projects upcoming payment obligations over a three-month period, allowing businesses to anticipate cash outflows accurately. It organizes vendor payment schedules, amounts due, and due dates, helping companies manage liquidity and avoid late payment penalties. This forecast is essential for budgeting, improving vendor relationships, and maintaining a healthy cash flow position.
Quarterly Marketing Spend Forecast
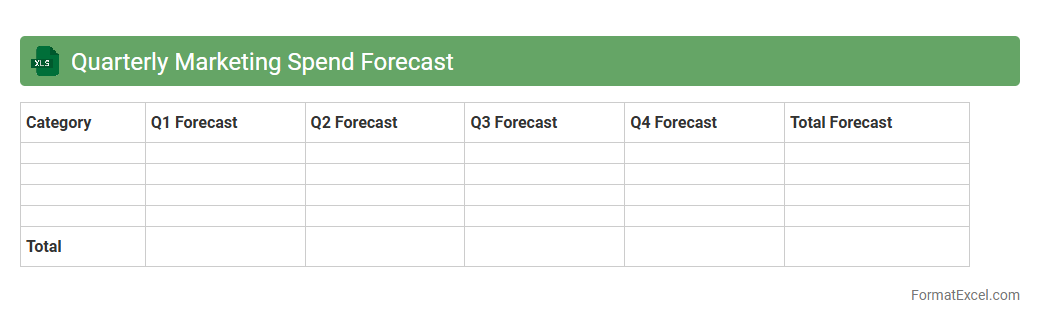
The
Quarterly Marketing Spend Forecast Excel document projects marketing expenses over a three-month period, enabling precise budget allocation and financial planning. It helps businesses monitor spending patterns, identify cost-saving opportunities, and ensure alignment with overall marketing strategies. This tool supports data-driven decisions by providing clear visibility into future financial commitments and campaign effectiveness.
Quarterly Operational Efficiency Forecast
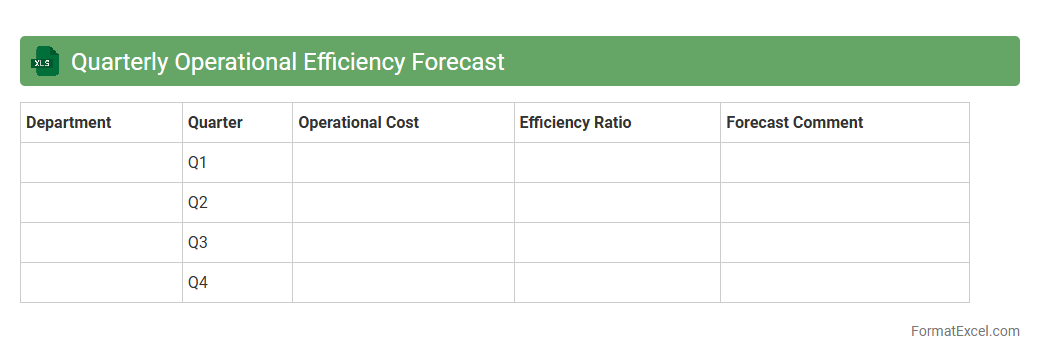
The
Quarterly Operational Efficiency Forecast Excel document is a strategic tool designed to project and analyze key performance indicators related to operational productivity and cost management over a three-month period. It enables organizations to identify trends, anticipate resource needs, and adjust workflows to optimize performance and reduce expenses. By leveraging this forecast, businesses can make informed decisions that enhance overall efficiency and drive sustained operational improvements.
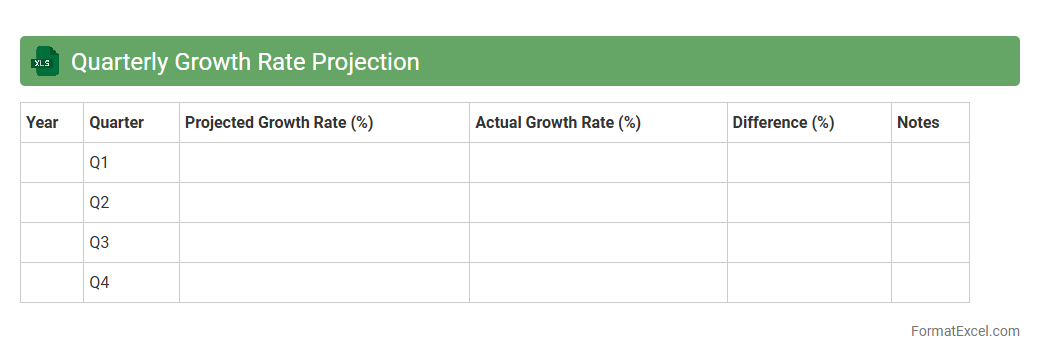
Quarterly Growth Rate Projection
The
Quarterly Growth Rate Projection Excel document is a financial tool designed to estimate the percentage change in revenue, sales, or other key performance indicators over successive quarters. It helps businesses analyze trends, forecast future growth, and make informed strategic decisions by providing clear, data-driven insights on performance trajectory. Using this document enables organizations to allocate resources effectively and set realistic targets based on projected quarterly growth.
Introduction to Quarterly Forecast Format in Excel
The quarterly forecast format in Excel is a structured template used to predict financial and operational performance every three months. It helps businesses plan resources and set achievable goals. Excel's flexibility makes it ideal for detailed and customizable forecasts.
Importance of Quarterly Forecasting for Businesses
Quarterly forecasting is crucial for making informed decisions and managing cash flow effectively. It allows businesses to track progress, identify trends, and adjust strategies proactively. Accurate forecasts reduce risks and improve overall financial planning.
Key Components of a Quarterly Forecast Spreadsheet
A typical quarterly forecast spreadsheet includes revenue, expenses, profit margins, and sales projections. It should capture historical data and projected trends for each quarter. Including a data validation section ensures input consistency and accuracy.
Setting Up Your Quarterly Forecast Template in Excel
Start by defining the quarters and relevant financial metrics in rows and columns. Use headers to separate months or quarters for clarity. A well-structured template enables easier updates and analysis over time.
Essential Formulas for Accurate Forecast Calculations
Incorporate formulas like SUM, AVERAGE, and FORECAST.LINEAR to compute totals and predict future values. Use IF and VLOOKUP functions to handle dynamic data inputs and conditions. Correct formula use ensures a reliable and automated forecast.
Step-by-Step Guide to Inputting Data for Each Quarter
Begin by entering historical data as a baseline, then input projected figures for revenues and expenses. Maintain consistency in units and time periods to enhance forecast reliability. Regularly reviewing and updating data maintains the forecast's accuracy.
Visualizing Forecast Data with Excel Charts
Use line charts or bar graphs to represent trends and compare actual vs forecasted values visually. Conditional formatting can highlight significant variances and anomalies. Visual tools improve understanding and facilitate data-driven decisions.
Tips for Customizing Your Quarterly Forecast Format
Adapt your template by adding industry-specific metrics or KPIs relevant to your business goals. Use colors and cell styles to improve readability and focus areas. Customization ensures the forecast format aligns with unique business needs.
Common Mistakes to Avoid in Quarterly Forecasting
Avoid relying solely on historical data without considering market changes or seasonality. Neglecting regular updates can lead to outdated forecasts and poor decision-making. Always double-check for data entry errors to maintain forecast integrity.
Best Practices for Updating and Maintaining Your Forecast in Excel
Review forecasts each quarter, incorporate actual performance, and adjust assumptions accordingly. Backup files regularly and document changes for transparency. Consistent maintenance ensures your quarterly forecast remains a valuable business tool.