Monthly Sales Performance
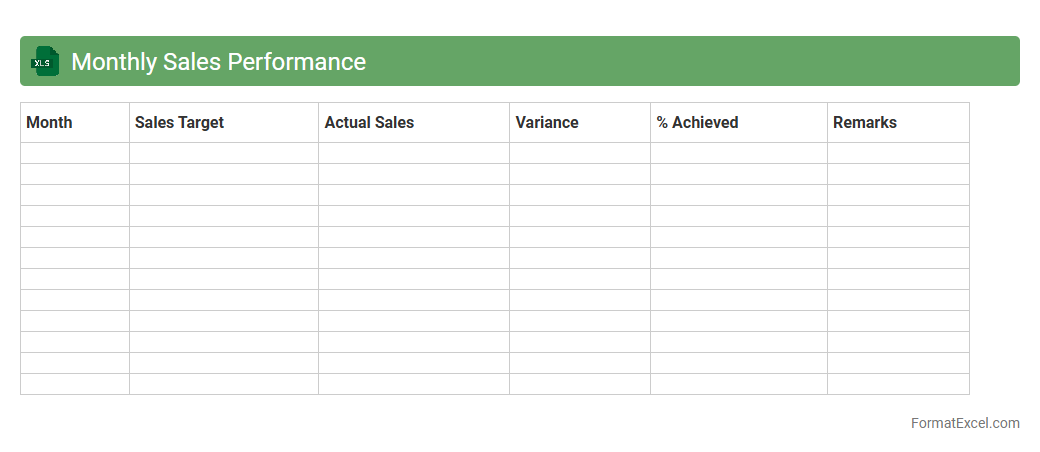
The
Monthly Sales Performance Excel document is a comprehensive tool designed to track, analyze, and visualize sales data over a monthly period. It helps businesses monitor key metrics such as revenue, units sold, and growth trends, enabling informed decision-making and targeted sales strategies. By using this document, companies can identify high-performing products, measure salesperson effectiveness, and optimize their overall sales process for improved profitability.
Year-to-Date Sales Comparison
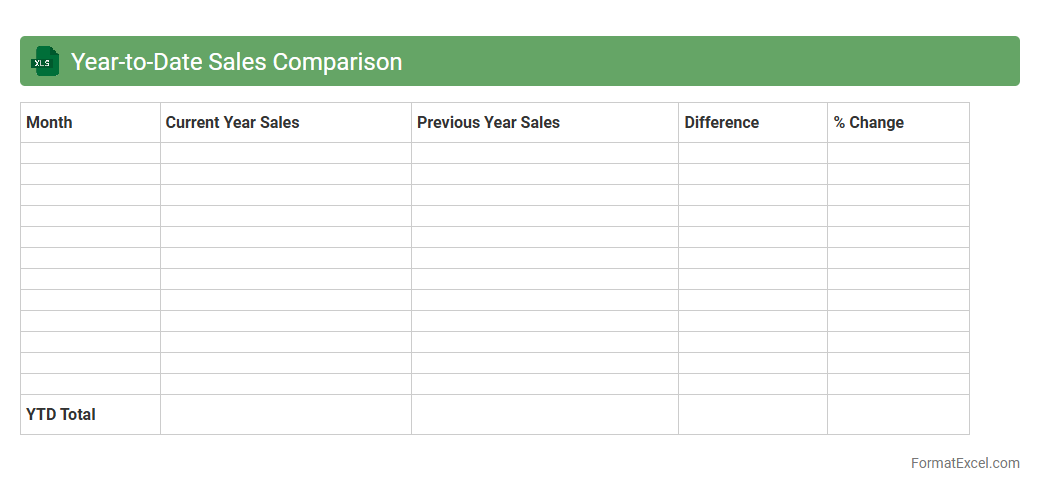
A
Year-to-Date Sales Comparison Excel document tracks and compares sales performance from the beginning of the year to the current date across different periods or product categories, enabling businesses to identify trends and measure growth effectively. It consolidates data into visual charts and tables, making it easier to evaluate whether sales targets are being met or if adjustments are needed. This tool improves decision-making by providing clear insights into sales fluctuations and seasonality, helping companies optimize strategies and forecast future revenue accurately.
Product Category Sales Breakdown
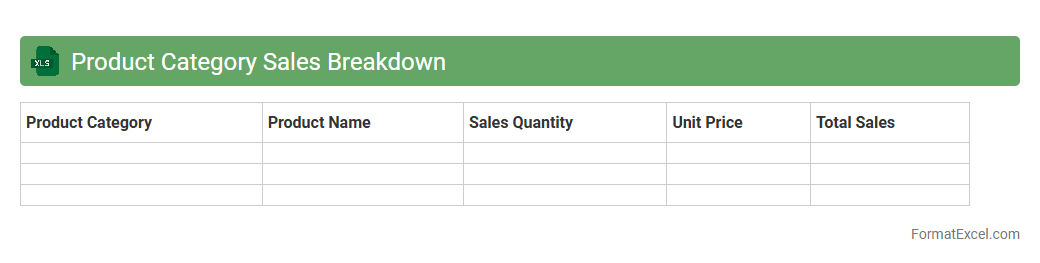
The
Product Category Sales Breakdown Excel document organizes sales data by product categories, enabling detailed analysis of revenue streams and performance trends. It helps businesses identify top-performing categories, optimize inventory, and make informed marketing decisions. This tool enhances forecasting accuracy and supports strategic planning by providing clear visibility into sales distribution across different product segments.
Regional Sales Summary
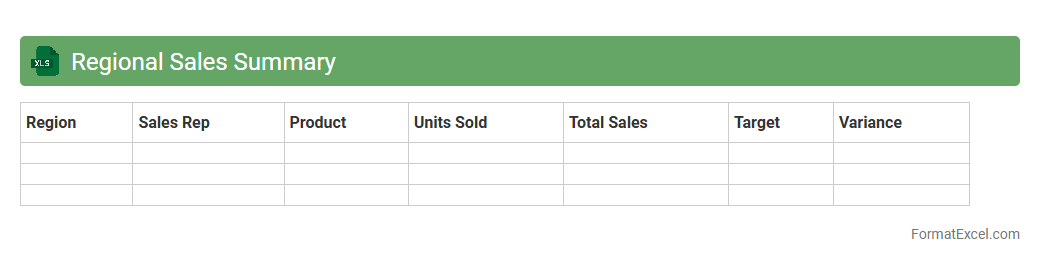
The
Regional Sales Summary Excel document consolidates sales data from multiple regions into a single, easy-to-read format, enabling quick analysis of performance across different geographic areas. It helps businesses identify trends, compare regional revenue, and make informed decisions to optimize sales strategies. This tool is essential for tracking targets and resource allocation efficiently, increasing overall sales effectiveness.
Sales by Salesperson
The
Sales by Salesperson Excel document is a detailed report tracking individual sales performance, including metrics such as total sales, product categories sold, and commission calculations. It helps managers analyze productivity, identify top performers, and allocate resources effectively for improved sales strategies. This data-driven approach enables businesses to optimize sales processes and enhance overall revenue generation.
Top Selling Products
The
Top Selling Products Excel document is a detailed spreadsheet that tracks and analyzes the highest-performing products based on sales data. It helps businesses identify trends, optimize inventory management, and forecast future demand effectively. Utilizing this document enhances decision-making and drives strategic growth by focusing on the most profitable merchandise.
Sales Target Achievement
A
Sales Target Achievement Excel document is a structured tool designed to track and analyze sales performance against predefined goals. It helps sales teams monitor progress, identify gaps, and strategize improvements by visualizing data through charts and summary tables. This document enhances decision-making, boosts productivity, and aligns individual efforts with overall business objectives.
New vs Returning Customer Sales
The
New vs Returning Customer Sales Excel document provides a detailed comparison between sales generated from first-time buyers and repeat customers, enabling businesses to track customer loyalty and acquisition effectiveness. By analyzing this data, companies can identify trends, optimize marketing strategies, and allocate resources more efficiently to grow revenue. This tool is essential for understanding customer behavior and improving overall sales performance.
Sales Growth Rate
The
Sales Growth Rate Excel document is a powerful tool designed to calculate and visualize the percentage increase or decrease in sales over specific periods. It helps businesses monitor performance trends, identify growth opportunities, and make informed financial decisions by analyzing historical sales data effectively. Using this document streamlines data management and enhances strategic planning through clear, organized insights.
Sales by Channel
The
Sales by Channel Excel document organizes revenue data across different distribution channels, enabling businesses to analyze performance metrics for online, retail, wholesale, and direct sales streams. This detailed breakdown helps identify trends, measure channel-specific growth, and allocate resources effectively to maximize profitability. Using this tool, companies can make data-driven decisions to optimize marketing strategies and improve overall sales efficiency.
Discount Impact on Sales
A
Discount Impact on Sales Excel document analyzes how different discount strategies affect overall revenue and profit margins by tracking sales volume, discount rates, and customer buying behavior. This tool helps businesses identify the optimal discount levels that maximize sales without eroding profitability, enabling data-driven pricing decisions. By visualizing trends and forecasting outcomes, it supports strategic planning and enhances competitive advantage in the market.
Customer Segment Sales
The
Customer Segment Sales Excel document organizes sales data by distinct customer groups, enabling detailed analysis of purchasing behaviors and revenue streams. It helps businesses identify high-value segments and tailor marketing strategies to maximize profitability and customer engagement. By leveraging this tool, companies can make data-driven decisions to optimize sales performance and allocate resources efficiently.
Quarterly Sales Totals
The
Quarterly Sales Totals Excel document is a spreadsheet that consolidates sales data across three-month periods, enabling clear visibility into revenue performance over time. It allows businesses to track growth trends, identify top-selling products, and evaluate the effectiveness of sales strategies efficiently. By analyzing this data, companies can make informed decisions to optimize marketing efforts and improve financial forecasting.
Sales Order Volume
A
Sales Order Volume Excel document tracks the quantity and value of sales orders over a specific period, enabling businesses to monitor performance and forecast demand accurately. This tool consolidates data on customer orders, product categories, and sales channels, facilitating detailed analysis and strategic planning. By leveraging this document, companies can identify trends, optimize inventory management, and improve overall sales efficiency.
Units Sold Summary
The
Units Sold Summary Excel document consolidates sales data by item, date, and region, enabling clear tracking of product performance over time. It provides critical insights for inventory management, sales forecasting, and identifying trends, which supports informed decision-making and strategic planning. By summarizing units sold, businesses can optimize stock levels, reduce waste, and improve overall revenue efficiency.
Lost Sales Analysis
The
Lost Sales Analysis Excel document systematically tracks and evaluates missed revenue opportunities due to stockouts, pricing errors, or customer attrition. It enables businesses to identify patterns in lost sales, quantify financial impact, and prioritize corrective actions to improve inventory management and customer retention. This analysis ultimately drives data-informed decisions that enhance sales forecasting and operational efficiency.
Profit Margin by Product
A
Profit Margin by Product Excel document calculates and displays the profitability of each individual product by comparing revenue against costs, enabling businesses to gauge which items contribute most to overall profit. This tool helps identify high-margin products for focused marketing and cost management strategies, improving decision-making. Tracking these margins regularly supports optimizing the product mix and enhancing financial performance.
Average Deal Size
The
Average Deal Size Excel document is a spreadsheet used to calculate and analyze the typical value of sales transactions within a business over a specific period. It helps sales teams and management identify revenue trends, optimize pricing strategies, and forecast future sales performance accurately. By tracking the average deal size, organizations can improve decision-making processes and allocate resources more effectively to maximize profitability.
Sales Pipeline Summary
A
Sales Pipeline Summary Excel document is a structured spreadsheet that tracks and visualizes the stages of potential sales opportunities from initial contact to closing. It provides valuable insights into sales performance, forecasting, and resource allocation by categorizing prospects by status, expected revenue, and closing probability. This tool enables sales teams to prioritize efforts, identify bottlenecks, and make data-driven decisions to improve conversion rates and achieve revenue targets.
Closed Deals Summary
The
Closed Deals Summary Excel document consolidates all finalized sales transactions into a clear, organized format, enabling businesses to track revenue, analyze performance trends, and forecast future sales. It includes essential data such as client names, deal values, closing dates, and sales representatives, providing a comprehensive overview for management and finance teams. This summary enhances decision-making by offering quick access to critical sales metrics and supporting strategic planning efforts.
Open Opportunities
The
Open Opportunities Excel document is a comprehensive spreadsheet that tracks active job openings, project bids, or business leads within an organization. It organizes critical data such as opportunity status, deadlines, responsible team members, and potential value, enabling efficient prioritization and follow-up. This tool enhances decision-making by providing clear visibility into available opportunities, facilitating timely actions that increase success rates and revenue generation.
Sales Return Analysis
Sales Return Analysis Excel document is a comprehensive tool designed to track and evaluate returned sales transactions, enabling businesses to identify key patterns and reasons behind product returns. It provides essential insights into customer behavior, product quality issues, and operational inefficiencies by organizing data such as return dates, quantities, reasons, and financial impacts. Using this
Sales Return Analysis helps companies reduce return rates, improve inventory management, and enhance overall profitability through informed decision-making.
Revenue Forecast
A
Revenue Forecast Excel document is a powerful financial tool that projects future income based on historical data, market trends, and business assumptions. It helps businesses plan budgets, allocate resources efficiently, and set realistic sales targets by providing clear visibility into expected revenue streams. Utilizing this document enhances decision-making accuracy and supports strategic growth initiatives.
Payment Status Summary
The
Payment Status Summary Excel document provides a comprehensive overview of all payment transactions, categorizing them by status such as pending, completed, or overdue. This helps businesses track cash flow, identify delayed payments, and improve financial planning. By consolidating payment data in one place, it enhances decision-making and supplier relationship management.
Backorder Report
A
Backorder Report Excel document tracks products or inventory items that are currently out of stock but have pending customer orders. It is useful for managing supply chain efficiency, identifying fulfillment delays, and prioritizing restocking efforts to improve customer satisfaction. By analyzing this report, businesses can optimize inventory levels and reduce order processing time.
Introduction to Sales Summary Formats in Excel
A sales summary format in Excel provides a clear overview of sales data, helping businesses track performance efficiently. It organizes complex sales figures into easy-to-understand summaries. Using Excel ensures flexibility and accessibility for all users.
Importance of Structured Sales Reports
Structured sales reports allow businesses to identify trends and make informed decisions quickly. They enable consistent tracking of sales targets and progress. Proper formatting ensures data accuracy and easy interpretation of sales metrics.
Key Components of a Sales Summary
Key components include total sales, sales by product or region, and time-period comparisons. Including graphical representations like charts enhances comprehension. These elements form the backbone of an effective sales summary.
Step-by-Step Guide to Creating a Sales Summary in Excel
Begin by organizing raw data into tables with clear headers. Apply formulas to calculate totals, averages, and growth percentages. Finally, use Excel's features such as PivotTables for dynamic data analysis.
Essential Excel Functions for Sales Data Analysis
Functions like SUM, AVERAGE, VLOOKUP, and IF are vital to analyze sales data effectively. These formulas help automate calculations and comparisons across datasets. Mastering these ensures powerful Excel data analysis.
Sample Sales Summary Format Templates
Templates provide a quick start by offering pre-structured layouts for sales summaries. They include built-in formulas and charts to visualize data. Using them saves time and ensures professional report formatting.
Customizing Sales Summary Formats for Your Business
Modify templates to fit your unique sales process, products, and goals. Custom fields such as region or sales rep enable personalized reporting. Tailored sales summary formats maximize business insights.
Tips for Automating Sales Summary Reports in Excel
Use macros and automated formulas to update sales data in real time. Linking external data sources allows seamless data refresh. Automation reduces manual errors and streamlines report generation.
Common Sales Summary Mistakes to Avoid
Avoid inconsistent data entry and lack of clear labels, which cause confusion. Ensure formulas are correctly applied to prevent inaccurate results. Preventing these errors leads to reliable and trustworthy sales summaries.
Downloadable Sales Summary Format Excel Templates
Many websites offer free or premium downloadable Excel templates for sales summaries. These templates provide customizable and ready-to-use solutions. Using trusted Excel templates accelerates report creation.