Pivot Table Summary
A
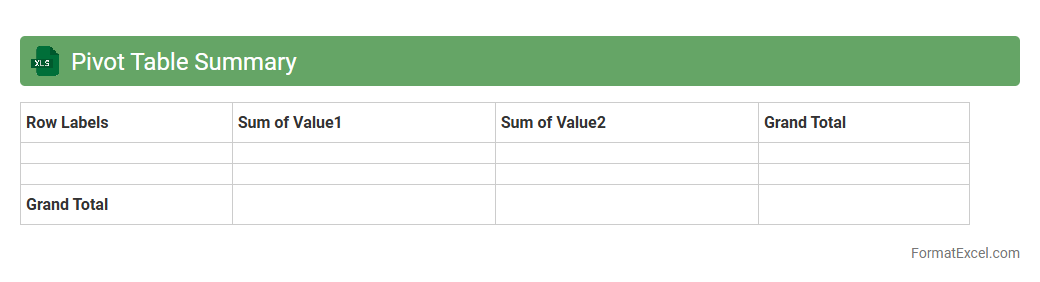
Pivot Table Summary in Excel is a powerful data analysis tool that allows users to quickly organize, summarize, and interpret large datasets by creating dynamic tables. It enables efficient data grouping, filtering, and aggregation, providing insightful trends and patterns without altering the original data. This tool is essential for making data-driven decisions, simplifying complex data into concise reports, and enhancing productivity in data management tasks.
Descriptive Statistics Table
A
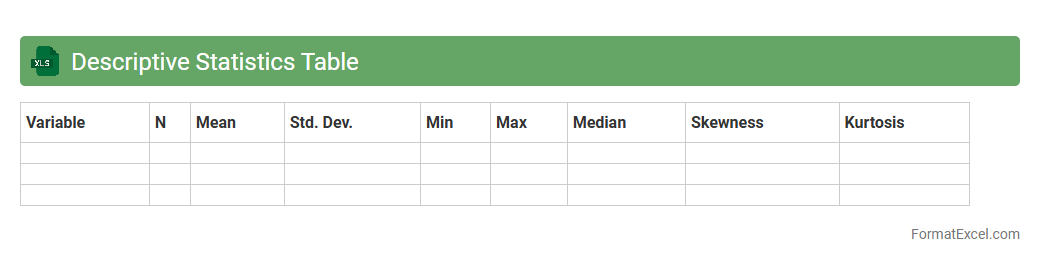
Descriptive Statistics Table in an Excel document summarizes data through measures such as mean, median, mode, standard deviation, and range, providing stakeholders with a clear understanding of the dataset's characteristics. This tool enables efficient data analysis by highlighting central tendencies and variability, facilitating informed decision-making across various fields like finance, research, and marketing. Using this table in Excel streamlines data interpretation and helps identify trends, outliers, and patterns quickly for improved strategic planning.
Correlation Matrix
A
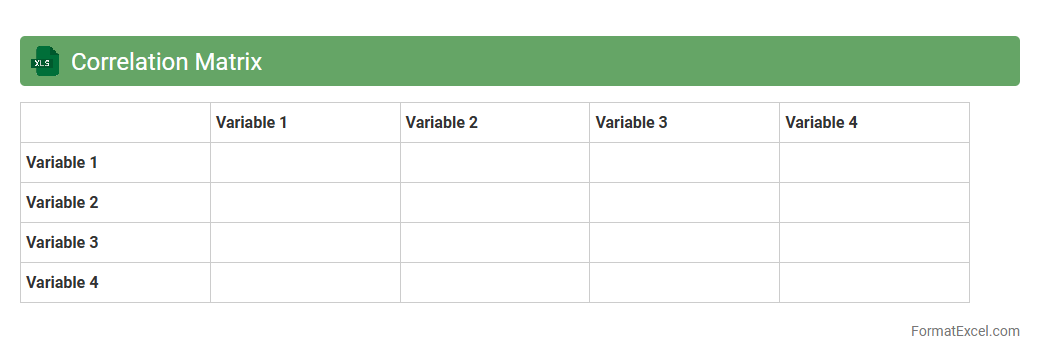
Correlation Matrix Excel document represents a table displaying the correlation coefficients between multiple variables, allowing quick identification of linear relationships. It is useful for data analysis, helping users detect patterns, trends, and potential multicollinearity in datasets for fields like finance, marketing, and scientific research. By visualizing these correlations, decision-makers can prioritize variables and improve predictive models or business strategies.
Regression Analysis Output
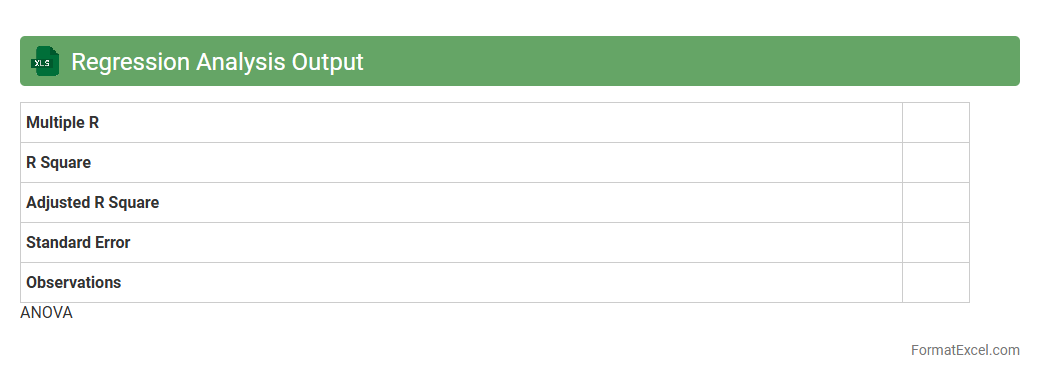
Regression Analysis Output in an Excel document provides detailed statistical data including coefficients, R-squared values, p-values, and residuals, which help in understanding the relationship between dependent and independent variables. This output is essential for identifying trends, making predictions, and validating models in various fields such as finance, marketing, and engineering. The
regression summary table allows users to assess model accuracy and make informed decisions based on quantitative evidence.
Data Validation Log
A
Data Validation Log Excel document tracks and records errors, discrepancies, and validation checks within datasets, ensuring data accuracy and consistency. It helps identify incomplete or incorrect entries quickly, streamlining data cleansing and improving overall data quality. Organizations use this log to enhance decision-making by maintaining reliable, validated data for analysis and reporting.
Outlier Detection Summary
The
Outlier Detection Summary Excel document compiles data anomalies by highlighting values that deviate significantly from the dataset's norm, aiding in the identification of errors, fraud, or unusual patterns. It streamlines the process of data cleaning, ensuring accuracy and reliability in subsequent analyses. This tool supports informed decision-making by allowing users to quickly pinpoint and investigate outliers impacting business intelligence or research outcomes.
Trend Analysis Table
A
Trend Analysis Table in Excel is a tool that organizes and visualizes data patterns over time, enabling users to identify significant shifts and forecast future outcomes effectively. It helps businesses and analysts track performance metrics, sales growth, or market changes by comparing historical data points side by side. Utilizing this table enhances decision-making processes by providing clear, data-driven insights that support strategic planning and resource allocation.
Time Series Decomposition
Time Series Decomposition in an Excel document involves breaking down a complex data series into its fundamental components: trend, seasonality, and residuals. This process helps identify underlying patterns and seasonal fluctuations, enabling more accurate forecasting and decision-making. Using
Time Series Decomposition in Excel allows users to visualize and interpret historical data effectively, improving strategic planning and performance analysis.
Moving Average Calculation
A
Moving Average Calculation Excel document is a tool used to analyze data trends by smoothing out fluctuations in time series data through averaging. It helps identify patterns, making it easier to predict future values in stock prices, sales, or other business metrics. This method is essential for data-driven decision-making, improving forecasting accuracy and trend analysis.
Cluster Membership List
A
Cluster Membership List Excel document is a structured file that organizes data about members within a specific cluster, group, or organization, including their roles, contact details, and participation status. It streamlines communication, facilitates tracking of member engagement, and supports efficient management of group activities by providing a centralized and accessible record. This document proves essential for coordinating tasks, analyzing member contributions, and ensuring accurate reporting within clusters.
ANOVA Results Table
The
ANOVA Results Table in an Excel document presents the summary of variance analysis, displaying key statistics such as sum of squares, degrees of freedom, mean squares, F-value, and p-value. This table helps determine if there are statistically significant differences between group means in experimental data. Utilizing this output facilitates informed decision-making by identifying factors that impact the outcomes and guiding further data analysis or research.
Chi-Square Test Table
The
Chi-Square Test Table Excel document is a pre-formatted spreadsheet containing critical values for the chi-square distribution, used to determine statistical significance in hypothesis testing. It helps analysts and researchers quickly compare calculated chi-square statistics against tabulated values to accept or reject null hypotheses in categorical data analysis. This tool streamlines the process of identifying p-values and critical thresholds, enhancing accuracy and efficiency in data interpretation.
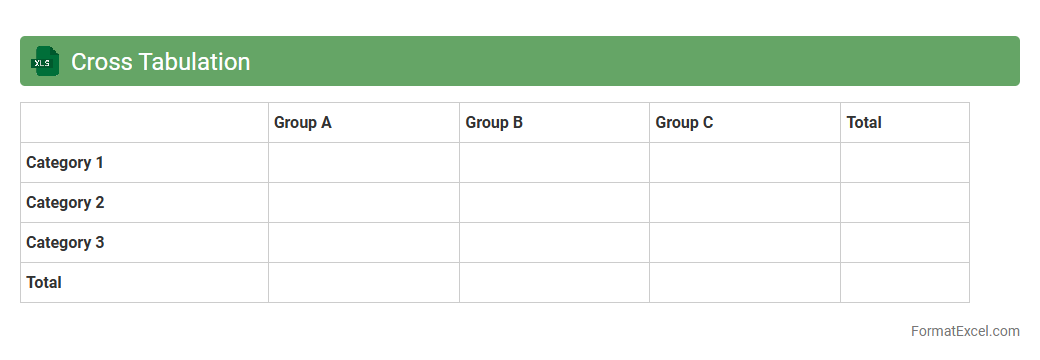
Cross Tabulation
Cross Tabulation in an Excel document is a powerful data analysis tool that summarizes the relationship between two or more variables by displaying their frequency distribution in a matrix format. It helps identify patterns, trends, and correlations by organizing data into rows and columns, making it easier to interpret large datasets. Using
Cross Tabulation enhances decision-making by providing clear insights into how different variables interact, facilitating targeted strategies in business, research, and marketing.
Missing Value Report
A
Missing Value Report Excel document systematically identifies and summarizes gaps or absent data points within a dataset, enhancing data quality assessment. This report helps users quickly pinpoint incomplete or inconsistent entries, facilitating more accurate data analysis and informed decision-making. By addressing missing values early, organizations can improve the reliability of their statistical models and reporting outcomes.
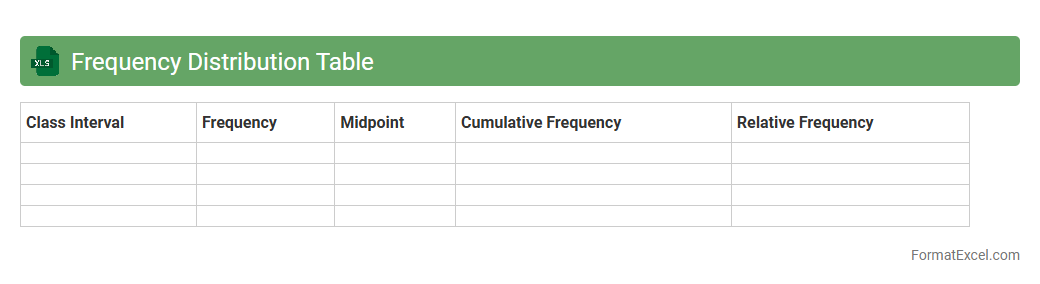
Frequency Distribution Table
A
Frequency Distribution Table in an Excel document organizes data into categories or intervals, displaying the number of occurrences for each category. It helps users quickly identify patterns, trends, and the spread of data, making it easier to analyze large datasets. This tool is essential for statistical analysis, data visualization, and informed decision-making in various fields.
Normalization Summary
The
Normalization Summary Excel document organizes and consolidates data normalization processes, providing a clear overview of data transformations and standardizations applied. It helps identify inconsistencies, streamline data for analysis, and ensures accuracy across datasets. This document is essential for maintaining data integrity and enhancing the quality of reporting and decision-making.
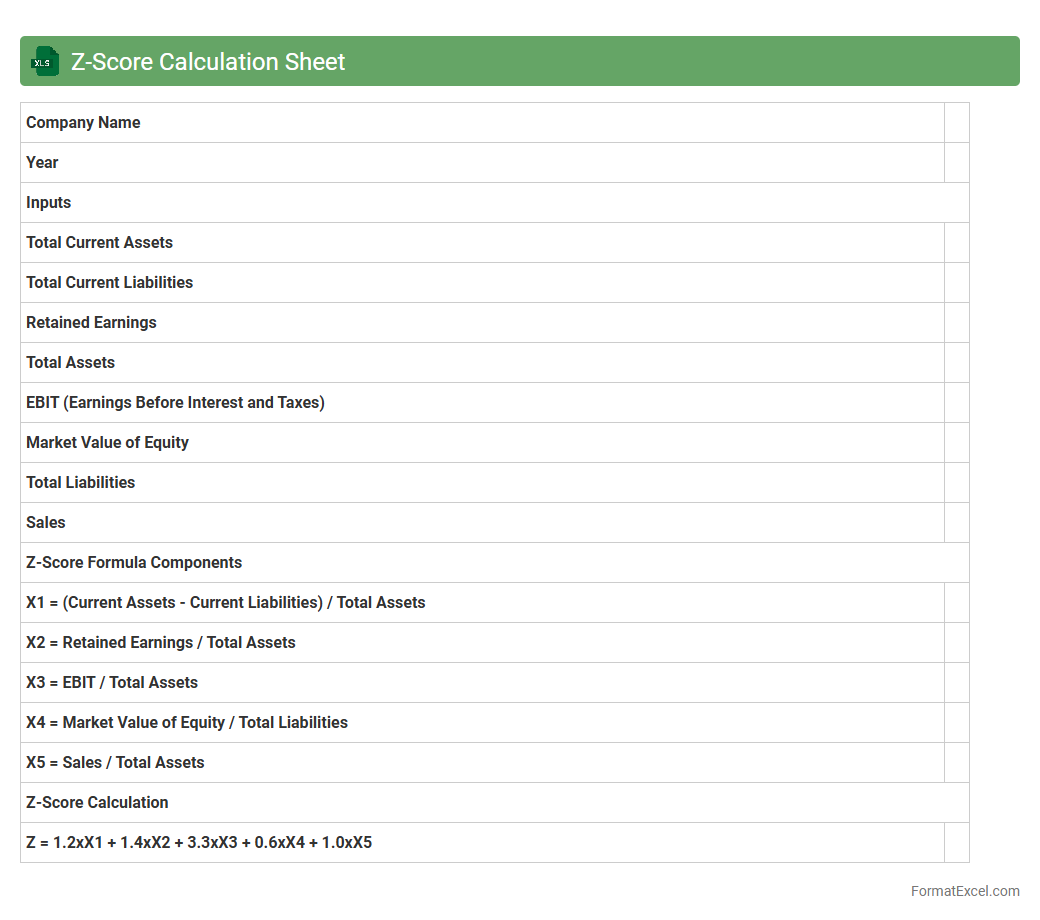
Z-Score Calculation Sheet
The
Z-Score Calculation Sheet in Excel is a powerful tool for standardizing data by measuring how many standard deviations a value is from the mean, facilitating comparisons across different datasets. It streamlines statistical analysis by automating z-score computations, which are essential for identifying outliers, normalizing scores, and conducting hypothesis testing. Utilizing this sheet enhances data interpretation accuracy, making it invaluable for researchers, analysts, and decision-makers.
Principal Component Scores
The
Principal Component Scores Excel document contains numerical values that represent the projection of original data onto principal components derived from Principal Component Analysis (PCA). These scores are essential for dimensionality reduction, allowing us to simplify complex datasets while preserving most of the variance. Using this document helps in identifying patterns, improving visualization, and enhancing machine learning models by reducing noise and redundancy.
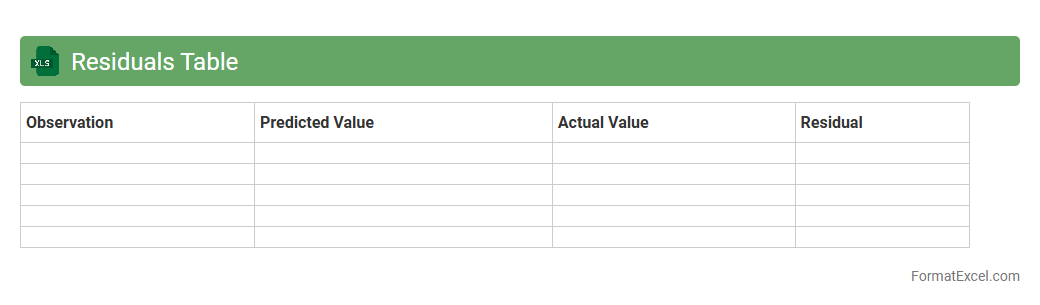
Residuals Table
A
Residuals Table in an Excel document displays the differences between observed and predicted values in a dataset, typically used in regression analysis to assess model accuracy. This table helps identify patterns of errors, detect outliers, and evaluate whether assumptions like linearity and homoscedasticity hold true. By analyzing residuals, users can improve predictive models, ensuring more reliable and precise forecasts for decision-making processes.
Ranking Analysis Table
A
Ranking Analysis Table in an Excel document organizes data by sorting items based on specific performance metrics, such as sales, ratings, or other quantifiable criteria. This tool allows for quick identification of top performers and areas needing improvement, enabling more strategic decision-making. Utilizing this analysis enhances clarity in complex data sets and supports prioritization in business or project management.
Variance Inflation Factor Table
A
Variance Inflation Factor (VIF) Table in an Excel document quantifies the severity of multicollinearity in regression analysis by measuring how much the variance of an estimated regression coefficient increases due to collinearity. This table is useful for identifying predictor variables that are highly correlated, which can inflate standard errors and distort statistical tests. By examining VIF values, researchers and analysts can decide which variables to remove or combine, improving model accuracy and interpretability.
Forecasting Results
The
Forecasting Results Excel document compiles predictive data analysis to project future trends based on historical information, enabling strategic decision-making. It allows users to identify potential risks and opportunities by visualizing patterns and fluctuations in sales, inventory, or financial performance. This tool enhances accuracy in planning, budgeting, and resource allocation, driving business efficiency and growth.
Hypothesis Testing Summary
The
Hypothesis Testing Summary Excel document consolidates statistical test results, including p-values, test statistics, and confidence intervals, to help evaluate assumptions and validate data-driven decisions. It simplifies comparison of null and alternative hypotheses, enabling users to determine the significance of observed effects quickly and accurately. This tool is essential for quality control, research analysis, and business intelligence by providing a clear overview that supports evidence-based conclusions.
Error Metrics Table
The
Error Metrics Table in an Excel document systematically organizes performance data by quantifying deviations between predicted and actual values, facilitating precise error analysis. This table is essential for identifying patterns, trends, and outliers in data accuracy, enabling informed decision-making and model improvement. Utilizing such metrics enhances reliability in forecasting, quality control, and process optimization across diverse applications.
Data Distribution Summary
A
Data Distribution Summary Excel document provides a detailed overview of how data values are spread across different categories or ranges, highlighting patterns, frequencies, and outliers. It allows users to quickly identify central tendencies, variability, and distribution shapes, enabling informed decision-making and efficient data analysis. This tool is essential for businesses and researchers to validate data quality, detect anomalies, and drive strategic insights based on statistical evidence.
Introduction to Data Analysis in Excel
Excel is a powerful tool widely used for data analysis, enabling users to transform raw data into meaningful insights. It provides numerous built-in functions and features designed to handle large datasets efficiently. Mastering Excel's data analysis capabilities is essential for making data-driven decisions.
Importance of a Structured Data Format
A well-organized dataset is crucial for accurate and efficient analysis. Using a structured data format ensures consistency, reduces errors, and facilitates the use of Excel's formulas and tools. Without structure, data can become difficult to interpret and prone to mistakes.
Preparing Raw Data for Analysis
Cleaning and organizing raw data is the first step toward effective analysis. This involves removing duplicates, correcting errors, and standardizing data entries to maintain data integrity. Proper preparation sets a strong foundation for reliable analysis outcomes.
Setting Up Data Tables and Ranges
Converting raw data into Excel tables allows for dynamic data management and easier referencing. Defining clear data ranges helps Excel recognize the dataset bounds, improving formula accuracy and pivot table creation. Tables also automatically expand as new data is added.
Formatting Columns and Data Types
Appropriate formatting of columns according to data types (e.g., dates, numbers, text) enhances data readability and processing. Correct data types ensure that Excel applies the correct operations and validations, reducing errors during analysis. Consistent formatting improves overall dataset clarity.
Using Named Ranges for Clarity
Named ranges replace cell references with meaningful identifiers, making formulas more understandable. Utilizing named ranges simplifies complex calculations and improves workbook navigation. This practice increases efficiency, especially in large spreadsheets.
Applying Data Validation Rules
Data validation enforces constraints on data entry, preventing invalid inputs and typographical mistakes. By setting data validation rules, you maintain dataset accuracy and reduce the need for later corrections. This leads to more trustworthy analysis results.
Leveraging Excel's Built-in Analysis Tools
Excel offers powerful features like pivot tables, conditional formatting, and functions that streamline data analysis. Utilizing these built-in analysis tools helps uncover patterns and trends quickly without external software. These tools enhance productivity and insight generation.
Visualizing Data with Charts and PivotTables
Graphs and pivot tables transform raw numbers into clear visuals, facilitating easier interpretation and decision-making. Effective use of visualization tools highlights key insights and supports storytelling with data. Visualization enhances both understanding and communication of findings.
Best Practices for Saving and Sharing Analysis Files
Saving files with clear names and consistent formats ensures accessibility and collaboration. Employing features like protected sheets and version control safeguards your analysis files from accidental changes or data loss. Sharing files in common formats promotes seamless teamwork.