Customer Satisfaction Summary
The
Customer Satisfaction Summary Excel document consolidates feedback and ratings from customers into a clear, data-driven report. It helps businesses identify patterns in customer experiences, measure service quality, and prioritize areas for improvement. This tool is invaluable for making informed decisions that enhance client loyalty and drive business growth.
Survey Response Rate Tracker
The
Survey Response Rate Tracker Excel document is a tool designed to monitor and analyze the percentage of completed surveys relative to the total number distributed. It helps identify trends in participant engagement over time, enabling more accurate assessment of survey reach and effectiveness. By providing clear visual data, it supports better decision-making for improving survey design and follow-up strategies.
Net Promoter Score Summary
A
Net Promoter Score Summary Excel document consolidates customer feedback into a clear metric that measures loyalty and satisfaction by categorizing respondents as promoters, passives, or detractors. This organized data visualization helps businesses identify trends, assess customer sentiment, and prioritize areas for improvement. By tracking changes over time, companies can make strategic decisions to enhance customer experience and drive growth.
Survey Demographics Overview
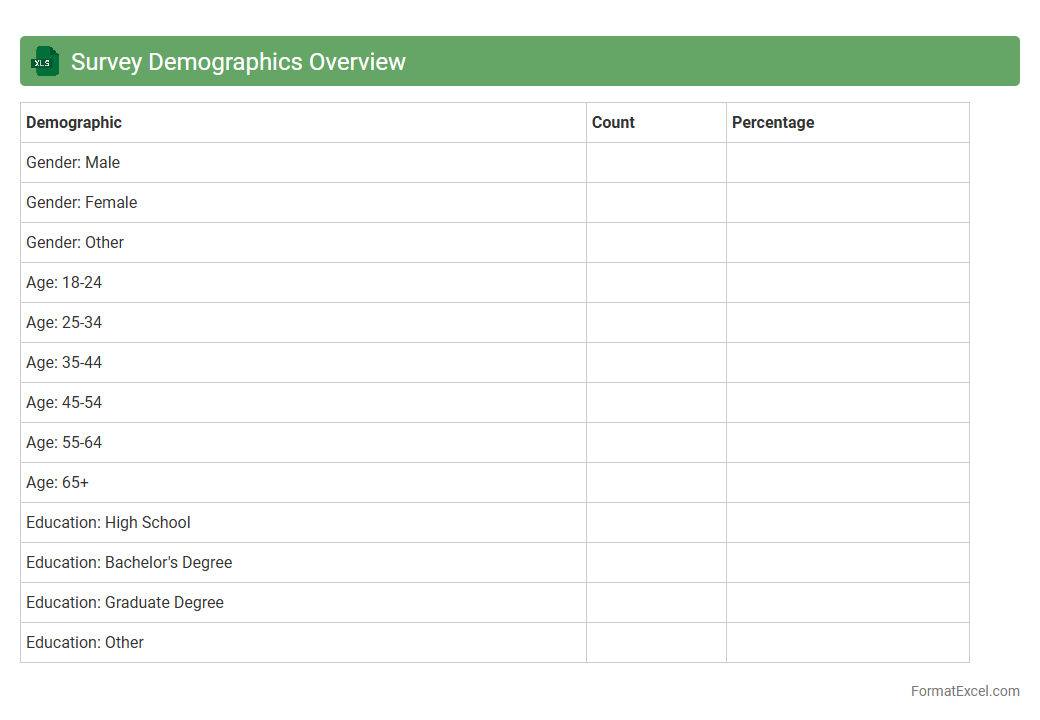
The
Survey Demographics Overview Excel document compiles and organizes critical demographic data collected from survey participants, such as age, gender, location, and income level. This structured dataset enables efficient analysis of target audience segments, helping identify trends and patterns that inform decision-making and marketing strategies. Utilizing this overview enhances the accuracy of insights drawn from survey results, leading to more tailored and effective business solutions.
Likert Scale Response Breakdown
The
Likert Scale Response Breakdown Excel document organizes and quantifies survey responses based on Likert scale data, allowing clear visualization of agreement levels across various statements. It enables efficient analysis of respondent attitudes by breaking down percentages and frequencies for each scale point, highlighting trends and patterns within the collected data. This tool supports data-driven decision-making by simplifying the interpretation of subjective responses in research, marketing, or organizational assessments.
Open-Ended Response Compilation
An
Open-Ended Response Compilation Excel document organizes qualitative data gathered from surveys, interviews, or feedback forms by categorizing and summarizing textual responses for easier analysis. This document allows researchers and analysts to identify recurring themes, trends, and sentiments without losing the nuance of individual answers. By streamlining the review process, it supports informed decision-making and enhances the accuracy of insights derived from large volumes of descriptive data.
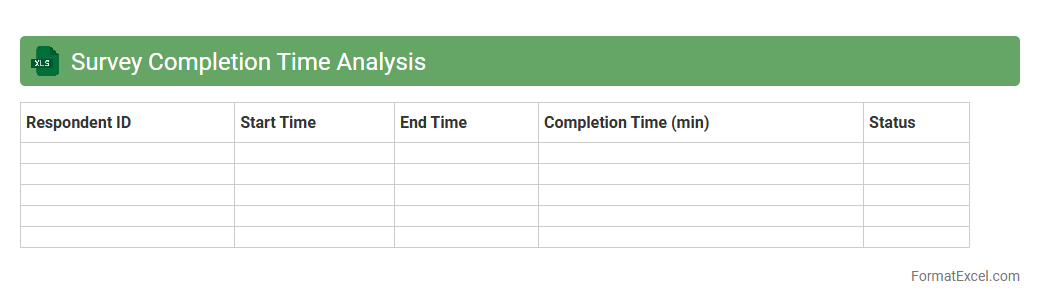
Survey Completion Time Analysis
The
Survey Completion Time Analysis Excel document tracks and evaluates the duration taken by respondents to complete surveys, identifying patterns and potential bottlenecks. This analysis helps improve survey design by highlighting questions that may cause delays or confusion, enhancing respondent experience and data quality. By optimizing survey completion time, organizations can increase response rates and gather more reliable insights for informed decision-making.
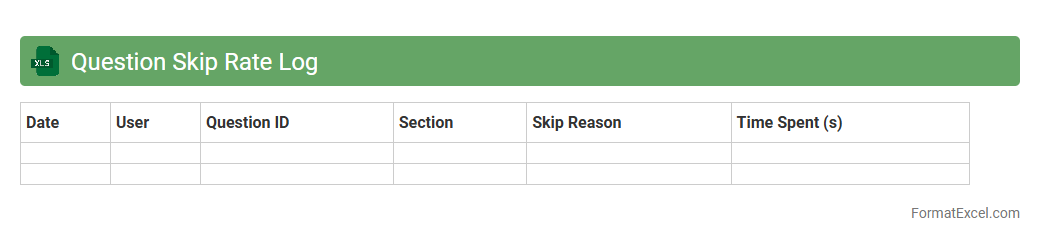
Question Skip Rate Log
The
Question Skip Rate Log Excel document is a detailed record that tracks the frequency at which questions are skipped during assessments or surveys. By analyzing skip rates, educators and researchers can identify problematic or confusing questions, facilitating targeted improvements to test design and user experience. This log provides actionable insights that enhance data accuracy and optimize question effectiveness in future evaluations.
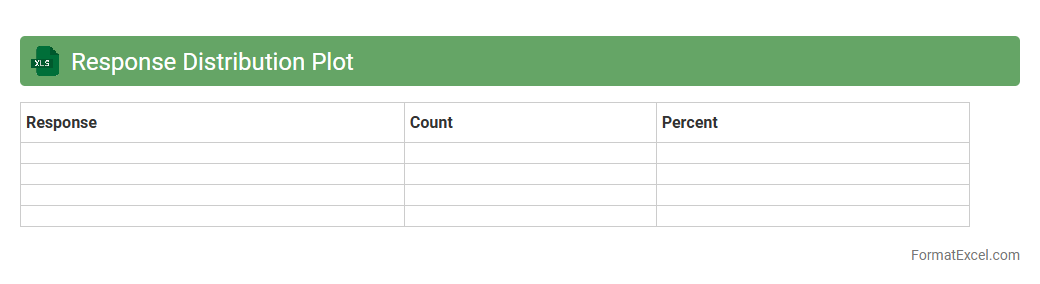
Response Distribution Plot
A
Response Distribution Plot in an Excel document visually represents the frequency of different responses within a dataset, making it easier to identify patterns and trends. This tool helps analyze survey results, customer feedback, or any categorical data by displaying the distribution of answers across various segments. It supports data-driven decision-making by highlighting the most common responses and variations within the dataset.
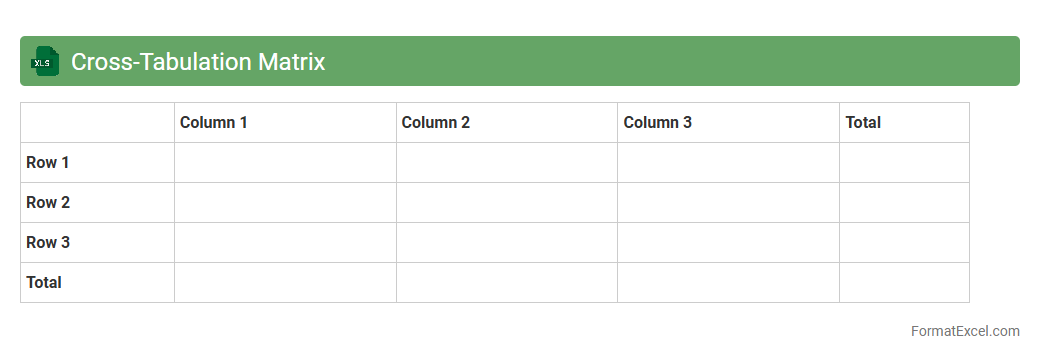
Cross-Tabulation Matrix
A
Cross-Tabulation Matrix in an Excel document organizes data into a compact, easy-to-read format that displays the relationship between two or more variables through a grid of rows and columns. It helps identify patterns, trends, and correlations by summarizing large datasets into meaningful categories, facilitating efficient data analysis. Cross-tabulation matrices are essential for business intelligence, market research, and performance evaluation, enabling informed decision-making based on comparative insights.
Top Survey Issues Highlight
The
Top Survey Issues Highlight Excel document consolidates key feedback from surveys to identify and prioritize critical areas requiring attention within an organization. It enables data-driven decision-making by clearly displaying recurring problems, trends, and their impact on customer satisfaction or operational efficiency. This tool streamlines issue tracking and supports targeted improvements by providing a structured overview of the most pressing concerns.
Year-over-Year Survey Comparison
A
Year-over-Year Survey Comparison Excel document systematically organizes and analyzes survey data collected across different years to identify trends and changes in responses. This tool allows businesses to measure performance, customer satisfaction, or employee engagement consistently over time, facilitating data-driven decisions and strategic planning. By visualizing year-over-year shifts, it uncovers areas of improvement and highlights successes, enhancing overall organizational effectiveness.
Survey Anonymity Compliance Check
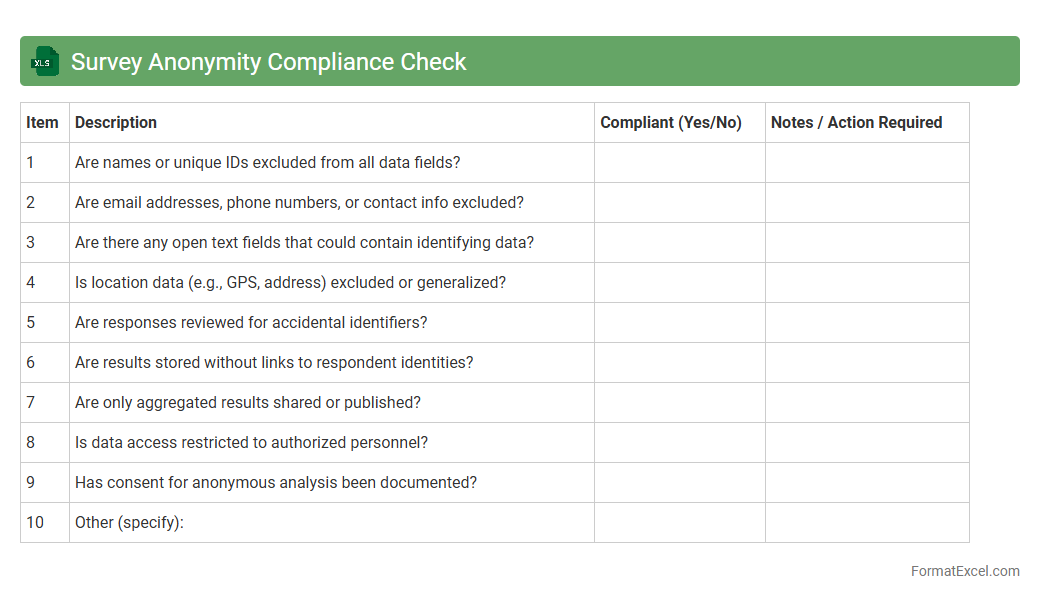
The
Survey Anonymity Compliance Check Excel document ensures that survey responses remain confidential by verifying the removal of identifiable information and adherence to data privacy standards. This tool systematically flags potential breaches of anonymity, helping organizations maintain ethical research practices and comply with legal regulations such as GDPR. Utilizing this document enhances data integrity and builds trust with respondents by safeguarding their personal information throughout the survey process.
Branch-wise Feedback Summary
The
Branch-wise Feedback Summary Excel document consolidates feedback data from various branches into a single, organized format, enabling quick analysis and comparison of performance metrics. It helps identify trends, strengths, and areas for improvement across different locations, facilitating data-driven decision-making and targeted action plans. This summary enhances transparency and efficiency by providing clear insights into customer satisfaction and operational effectiveness at the branch level.
Departmental Survey Results
The
Departmental Survey Results Excel document compiles responses and data collected from various departments within an organization, presenting them in an organized, easy-to-analyze format. It enables management to identify trends, assess employee satisfaction, pinpoint areas requiring improvement, and make data-driven decisions. By consolidating feedback systematically, this tool enhances transparency and supports strategic planning across departments.
Region-Based Response Analysis
Region-Based Response Analysis
Excel document is a tool designed to collect, organize, and analyze data specific to various geographic regions. It helps in identifying regional trends, customer behavior, and performance metrics by comparing responses across different locations, enabling targeted decision-making. This document is valuable for businesses and researchers aiming to optimize strategies and improve outcomes based on localized insights.
Age Group Survey Analysis
The
Age Group Survey Analysis Excel document categorizes survey data based on different age brackets, enabling detailed demographic insights. It helps identify trends, preferences, and behaviors unique to specific age segments, facilitating targeted decision-making and marketing strategies. By organizing data efficiently, this tool enhances the accuracy and clarity of age-related analyses for businesses and researchers.
Product Satisfaction Scoring
The
Product Satisfaction Scoring Excel document is a tool designed to quantify and analyze customer feedback on various product attributes, enabling businesses to identify strengths and areas for improvement. It systematically aggregates survey data into actionable scores, facilitating data-driven decision-making to enhance product quality and customer experience. Using this document helps companies prioritize development efforts and increase overall satisfaction and loyalty.
Mobile vs Desktop Response Split
The
Mobile vs Desktop Response Split Excel document provides a detailed comparison of user interactions and response rates across mobile and desktop platforms. It enables businesses to analyze device-specific behavior, optimize marketing strategies, and enhance user experience by identifying which platform drives better engagement. This data-driven insight aids in resource allocation and tailoring content for maximum impact on each device type.
Survey Incentive Impact Report
The
Survey Incentive Impact Report Excel document analyzes how different incentives influence survey response rates and participant engagement. It consolidates data on various incentive types, response metrics, and demographic insights to help organizations optimize their reward strategies for increased participation. Using this report enables data-driven decisions that improve survey effectiveness and maximize return on investment.
Overall Satisfaction Index
The
Overall Satisfaction Index Excel document is a tool designed to aggregate and analyze customer feedback or user experience data by quantifying satisfaction levels into a comprehensive score. This index helps businesses identify strengths and weaknesses, enabling targeted improvements in products or services. By visualizing trends and comparing satisfaction over time, organizations can make informed decisions to enhance customer loyalty and operational efficiency.
Employee Engagement Survey Metrics
The
Employee Engagement Survey Metrics Excel document is a structured tool designed to capture, analyze, and visualize data from employee engagement surveys, providing insights into workforce satisfaction, motivation, and overall work environment. It enables HR professionals and managers to track key performance indicators such as employee morale, retention rates, and productivity levels to identify areas needing improvement. This document supports data-driven decision-making, helping organizations enhance employee experience and foster a more engaged and productive workforce.
Service Improvement Suggestions List
The
Service Improvement Suggestions List Excel document is a structured tool designed to collect, organize, and prioritize feedback aimed at enhancing service quality. It helps track service issues, proposed solutions, and progress, enabling teams to focus on impactful improvements systematically. By providing a clear overview of suggestions and their implementation status, it supports data-driven decision-making and continuous service enhancement.
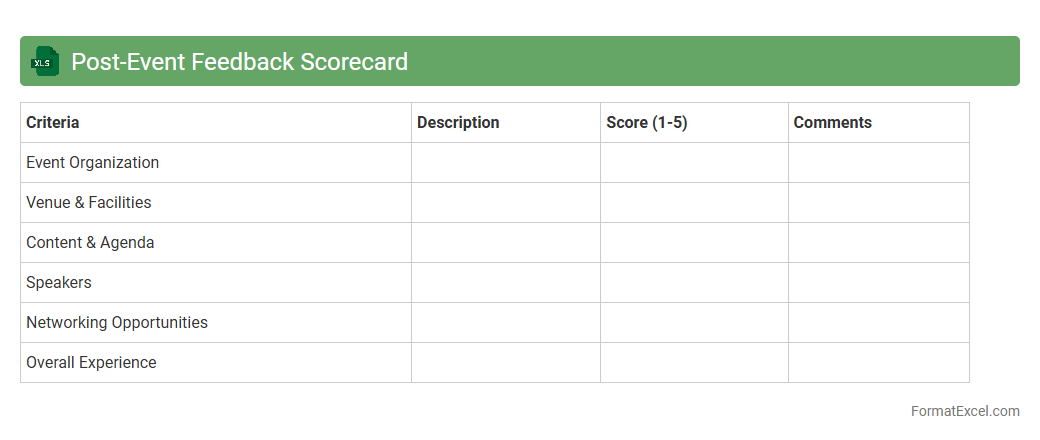
Post-Event Feedback Scorecard
The
Post-Event Feedback Scorecard Excel document is a structured tool designed to collect, organize, and analyze participant feedback after an event. It helps quantify satisfaction levels, identify strengths and areas of improvement, and provides actionable insights through visual charts and summary metrics. Using this scorecard enhances decision-making for future event planning, ensuring continuous improvement and higher attendee engagement.
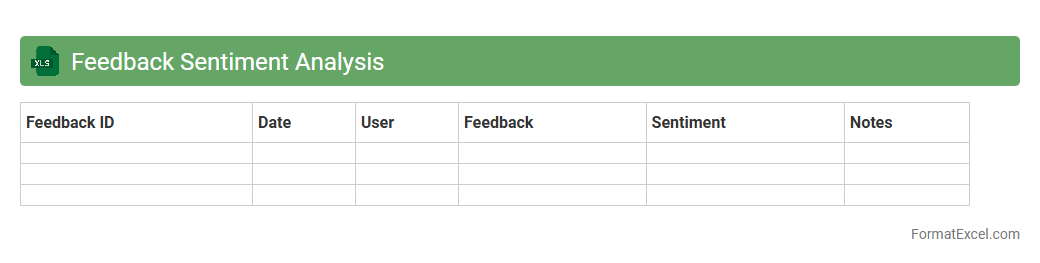
Feedback Sentiment Analysis
The
Feedback Sentiment Analysis Excel document is a powerful tool designed to systematically evaluate customer feedback by categorizing comments into positive, negative, or neutral sentiments. It enables businesses to identify trends and key areas for improvement by quantifying customer emotions and opinions through automated data processing. Utilizing this document helps organizations enhance decision-making, improve customer satisfaction, and drive strategic developments based on accurate sentiment insights.
Introduction to Survey Analysis in Excel
Survey analysis in Excel enables users to organize and interpret data efficiently. Understanding how to leverage Excel's features can transform raw data into valuable insights. This process streamlines decision-making based on survey results.
Preparing Your Survey Data for Excel
Proper data preparation ensures accurate analysis by structuring survey responses systematically. This step involves entering responses consistently and labeling variables clearly. Clean data forms the foundation for meaningful analysis.
Setting Up Excel Workbook for Survey Analysis
Creating a dedicated workbook with separate sheets for raw data, calculations, and visualizations optimizes workflow. Naming each sheet intuitively helps maintain organization. This setup facilitates easy navigation and efficient data management.
Data Cleaning and Validation Techniques
Cleaning data involves removing duplicates, correcting errors, and handling missing values to preserve accuracy. Validation rules in Excel prevent incorrect entries during data input. Implementing these techniques is critical for maintaining data integrity.
Designing an Effective Survey Analysis Template
An effective template standardizes data entry and automates calculations, saving time during repetitive analyses. Templates should include pre-configured formulas and formatting for consistency. This enhances productivity and ensures reliable results.
Using Excel Functions for Survey Data Analysis
Functions like COUNTIF, AVERAGE, and VLOOKUP help summarize and explore survey data efficiently. They enable quick identification of trends and patterns through automated calculations. Mastery of these functions elevates the depth of analysis.
Visualizing Survey Results with Charts and Graphs
Charts like bar graphs, pie charts, and histograms present data visually to uncover trends and comparisons. Visual representations facilitate clearer communication of the survey findings. Effective visualizations enhance understanding and stakeholder engagement.
Applying Filters and PivotTables for Deeper Insights
Filters let users focus on specific data subsets, while PivotTables summarize large datasets dynamically. These tools uncover hidden patterns and correlations within survey results efficiently. Utilizing PivotTables is key to extracting actionable insights.
Tips for Interpreting Survey Data in Excel
Interpretation requires attention to context, sample size, and potential biases to draw valid conclusions. Comparing metrics and identifying outliers support more accurate decisions. Critical analysis ensures data-backed, meaningful outcomes.
Exporting and Sharing Survey Analysis Reports
Exporting results to PDF or sharing Excel workbooks makes survey findings accessible to stakeholders. Clear formatting and summaries enhance report readability. Collaborative sharing fosters informed decision-making across teams.