Inventory Turnover Rate
An
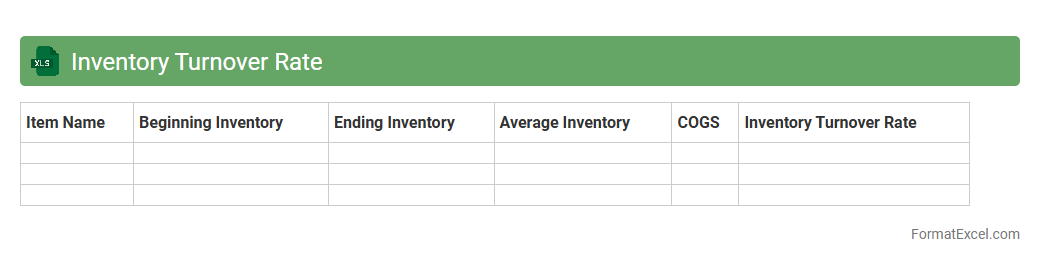
Inventory Turnover Rate Excel document is a tool designed to calculate and analyze how efficiently a company manages its inventory by tracking the number of times inventory is sold and replaced over a specific period. This document helps businesses identify trends in stock movement, optimize inventory levels, and reduce holding costs by providing clear, organized data insights. Using this Excel sheet enables improved demand forecasting, better cash flow management, and enhanced decision-making in supply chain operations.
Days Sales of Inventory
The
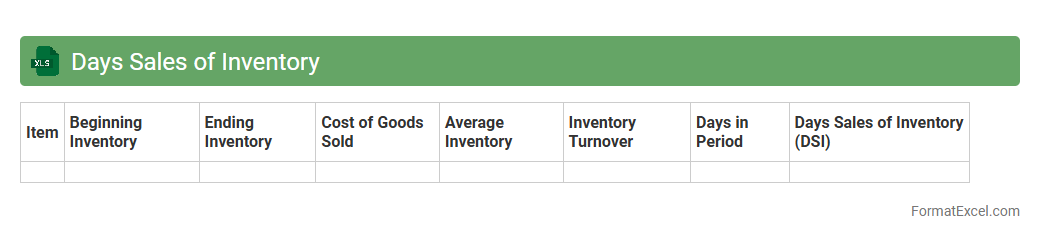
Days Sales of Inventory (DSI) Excel document calculates the average number of days a company takes to sell its entire inventory during a specific period. This metric helps businesses optimize inventory management by identifying slow-moving stock and improving cash flow efficiency. Using this Excel tool enables better decision-making for procurement, production planning, and sales strategies.
Stock Aging Report
A
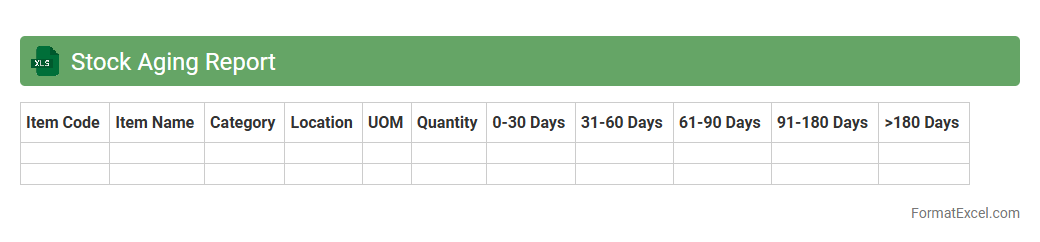
Stock Aging Report Excel document categorizes inventory based on the length of time items have been held in stock, highlighting aging products that may require attention. This report helps businesses identify slow-moving or obsolete inventory, optimize stock levels, and improve cash flow management. By analyzing aging data, companies can make informed decisions on purchasing, sales strategies, and inventory write-offs, ultimately enhancing operational efficiency.
Reorder Point Analysis
The
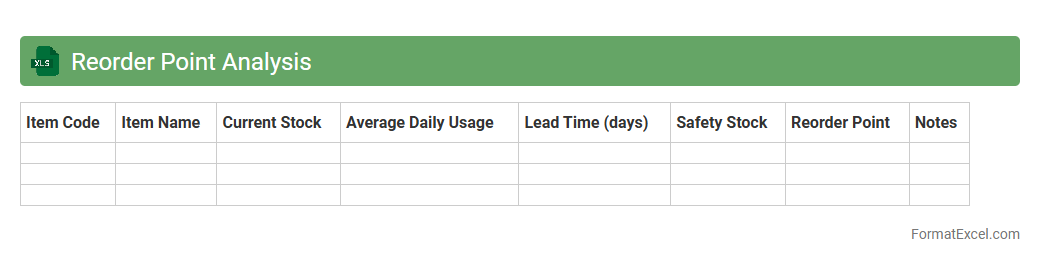
Reorder Point Analysis Excel document is a tool used to determine the optimal inventory level at which new stock should be ordered to prevent stockouts. It calculates the reorder point by considering factors such as lead time demand, safety stock, and average daily usage, ensuring that inventory replenishment happens timely and efficiently. This analysis helps businesses maintain balanced inventory levels, reduce carrying costs, and improve overall supply chain management.
ABC Inventory Classification
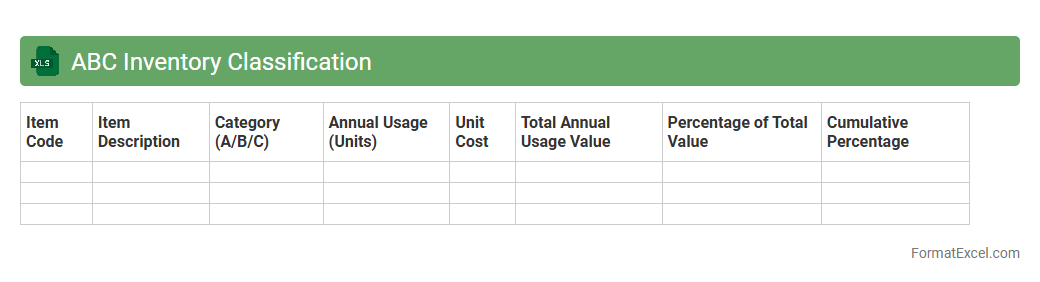
The
ABC Inventory Classification Excel document categorizes inventory items based on their importance and value, typically dividing them into three categories: A (high value), B (moderate value), and C (low value). This classification helps businesses prioritize inventory management efforts, optimize stock levels, reduce carrying costs, and improve cash flow by focusing on the most critical items. Utilizing this file enables better inventory control, efficient resource allocation, and enhances decision-making in supply chain management.
Slow-Moving Inventory Analysis
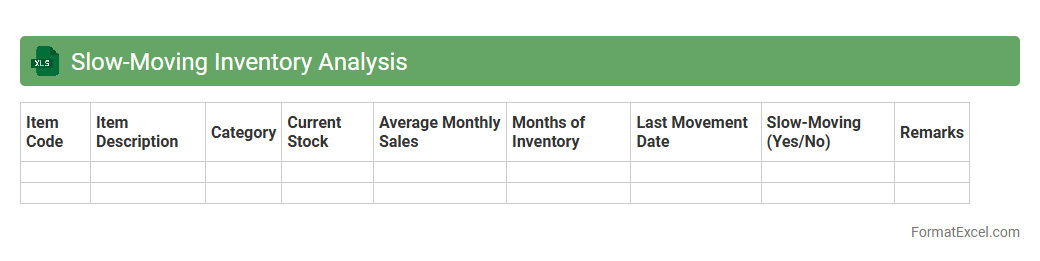
Slow-Moving Inventory Analysis Excel document identifies products with low sales velocity, helping businesses optimize stock levels and reduce holding costs. It tracks inventory turnover rates, aging products, and demand patterns to highlight potential obsolescence risks. Using this tool improves cash flow management and enhances supply chain efficiency by focusing on
slow-moving inventory.
Dead Stock Identification
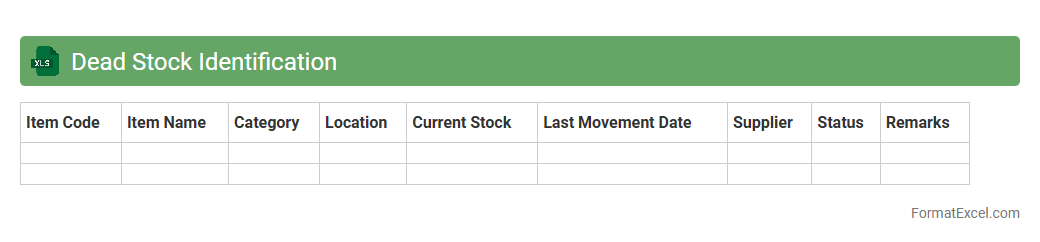
A
Dead Stock Identification Excel document is a tool designed to track and analyze inventory items that have not been sold or used over a specific period. It helps businesses identify obsolete or excess stock, enabling more efficient inventory management and cost reduction. By providing clear data on slow-moving products, this document supports informed decision-making regarding stock clearance and procurement strategies.
Stockout Frequency
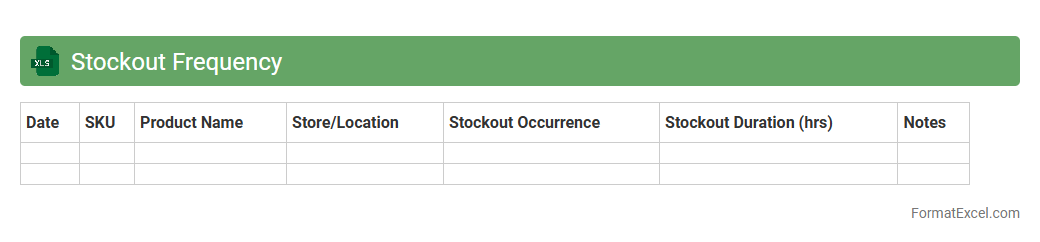
The
Stockout Frequency Excel document tracks the occurrence and timing of inventory shortages within a specific period, enabling businesses to identify patterns and high-risk products. It provides actionable insights for supply chain optimization by highlighting products prone to stockouts, facilitating timely replenishment and minimizing lost sales. Using this data-driven tool improves inventory management accuracy, reduces customer dissatisfaction, and boosts overall operational efficiency.
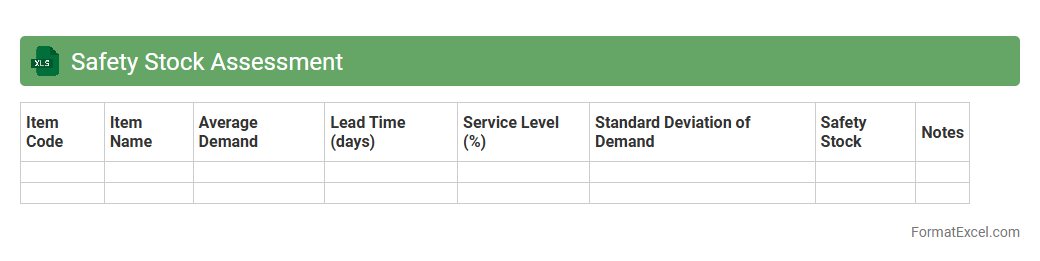
Safety Stock Assessment
Safety Stock Assessment excel document is a tool designed to calculate and analyze the optimal level of
safety stock required to prevent stockouts while minimizing inventory costs. It uses historical demand data, lead times, and variability to provide accurate safety stock recommendations that enhance supply chain reliability and operational efficiency. This document allows businesses to make data-driven decisions, ensuring product availability and improving customer satisfaction without overstocking.
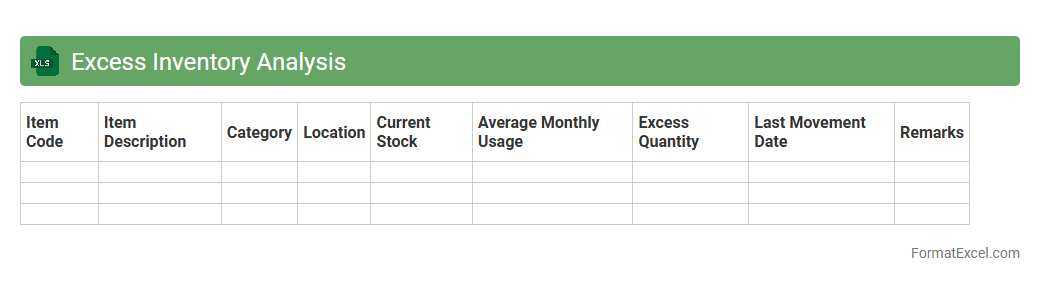
Excess Inventory Analysis
Excess Inventory Analysis excel document is a powerful tool used to identify and quantify surplus stock that exceeds demand or optimal inventory levels. It helps businesses minimize holding costs, improve cash flow, and enhance inventory turnover by providing clear insights into slow-moving or obsolete items. Utilizing this
analysis allows companies to make informed decisions on inventory reduction strategies and optimize supply chain efficiency.
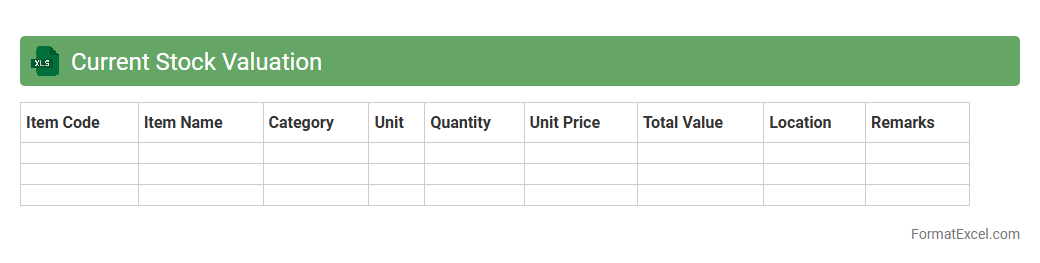
Current Stock Valuation
The
Current Stock Valuation Excel document is a financial tool designed to calculate the real-time value of stocks based on market data, including share price, outstanding shares, and recent financial metrics. It enables investors and analysts to quickly assess the market capitalization and intrinsic value of equity holdings, facilitating informed investment decisions. This document streamlines portfolio management by providing clear, updated stock valuations essential for tracking investment performance and identifying potential market opportunities.
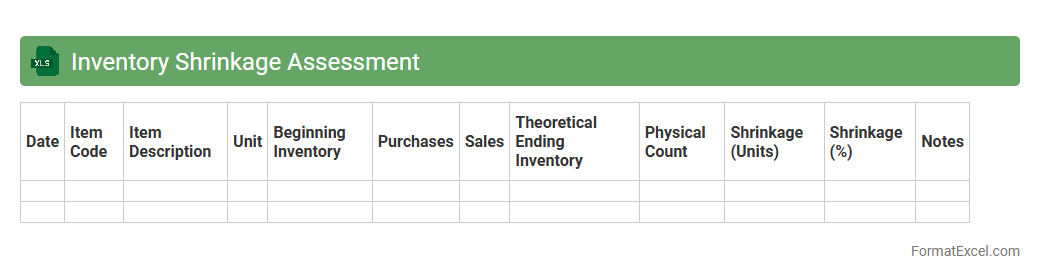
Inventory Shrinkage Assessment
The
Inventory Shrinkage Assessment Excel document is a tool designed to track and analyze discrepancies between recorded inventory and actual stock levels. It helps identify causes of shrinkage such as theft, damage, or administrative errors, enabling businesses to implement corrective measures. By providing clear insights into inventory losses, this document supports improved inventory management and cost control strategies.
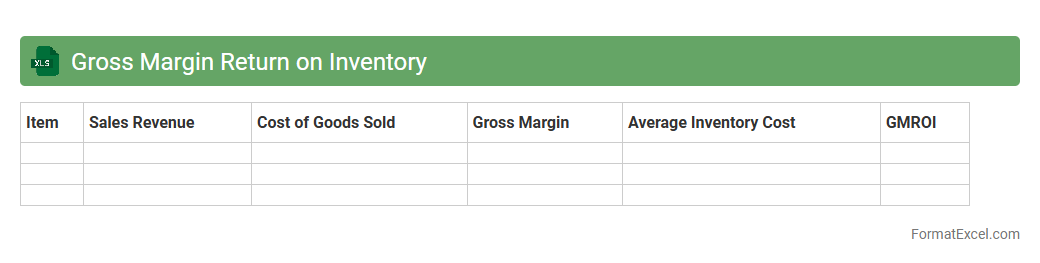
Gross Margin Return on Inventory
Gross Margin Return on Inventory (GMROI) is a crucial metric that measures the profitability of inventory by comparing gross margin to the cost of inventory. An Excel document designed for GMROI helps businesses efficiently analyze product performance, optimize stock levels, and boost profitability. Using
GMROI Excel tools enables precise inventory management decisions, ensuring resources are allocated to the most profitable products.
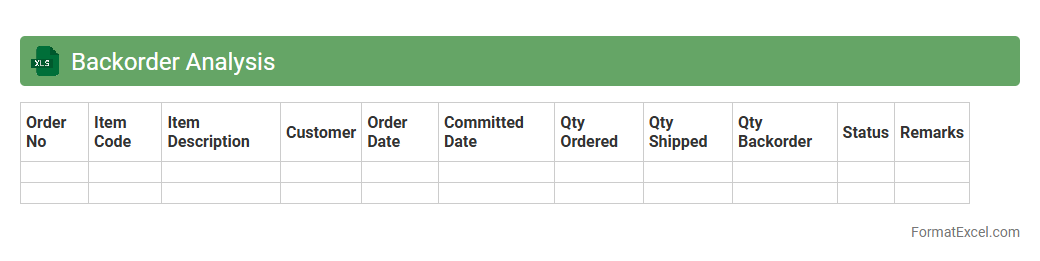
Backorder Analysis
A
Backorder Analysis Excel document is a specialized spreadsheet designed to track and evaluate pending customer orders that cannot be fulfilled immediately due to stock shortages. It helps businesses identify patterns in product demand, inventory issues, and supply chain bottlenecks, enabling efficient decision-making to reduce delays and improve customer satisfaction. By analyzing backorder data, companies can optimize inventory management, forecast demand more accurately, and enhance overall operational efficiency.
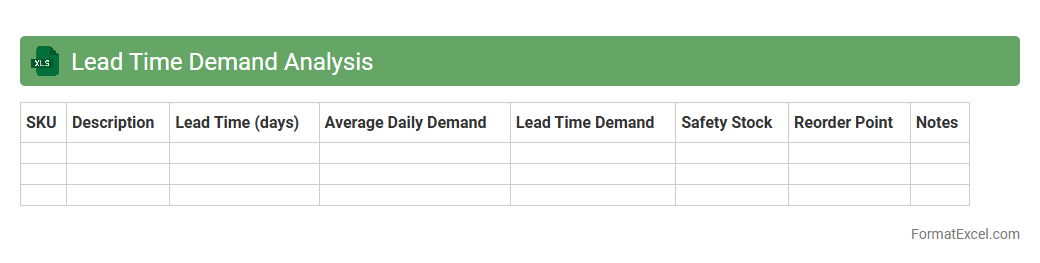
Lead Time Demand Analysis
A
Lead Time Demand Analysis Excel document calculates the expected product demand during the lead time, integrating historical sales data and lead time variability to improve inventory management. It helps businesses optimize stock levels, reducing both overstock and stockouts by providing accurate demand forecasts for the replenishment period. Utilizing this analysis supports efficient supply chain planning and enhances customer satisfaction by ensuring product availability.
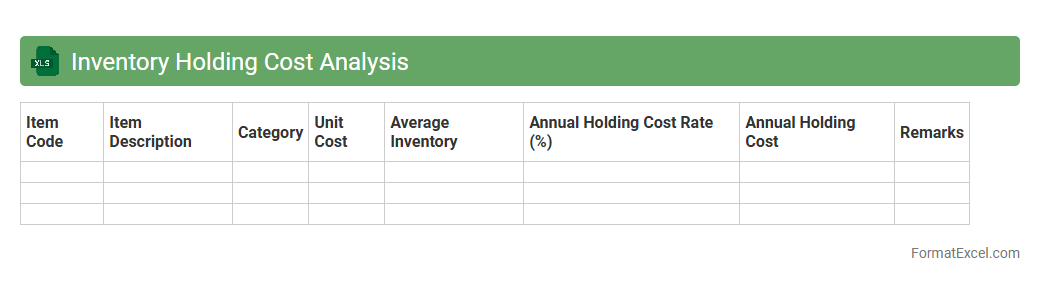
Inventory Holding Cost Analysis
Inventory Holding Cost Analysis Excel document calculates the expenses associated with storing and maintaining inventory, including warehousing, insurance, depreciation, and obsolescence costs. By providing a detailed breakdown of these costs, it enables businesses to identify inefficiencies and optimize stock levels, reducing unnecessary expenditures. This tool is essential for improving cash flow management and ensuring profitable inventory control.
Cycle Count Variance
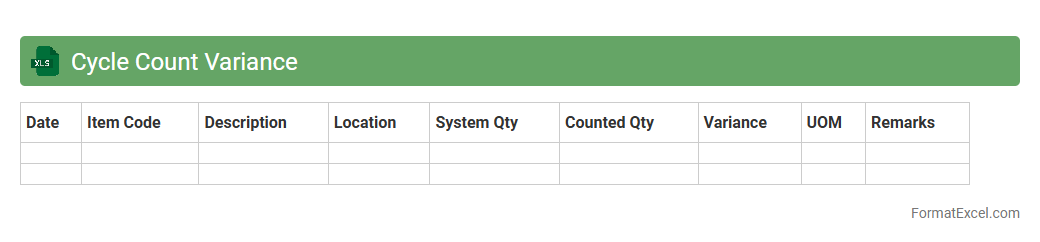
The
Cycle Count Variance Excel document is a tool designed to track and analyze discrepancies between recorded inventory quantities and actual physical counts during cycle counts. It helps identify inventory inaccuracies, enabling businesses to optimize stock levels, reduce shrinkage, and improve overall inventory management efficiency. By providing detailed variance data, this document supports informed decision-making and enhances the accuracy of inventory records.
Item Fill Rate
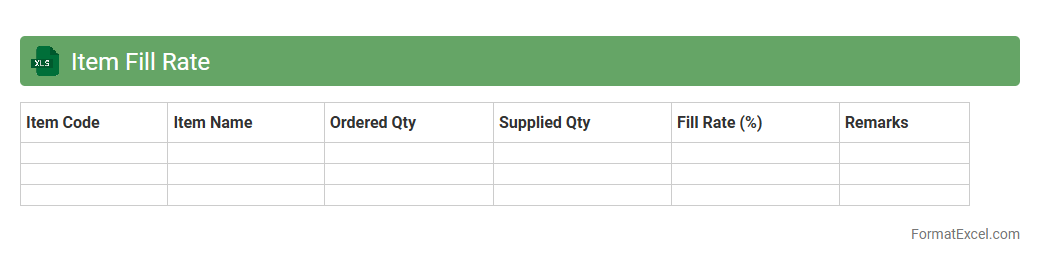
The
Item Fill Rate Excel document tracks the percentage of customer orders fulfilled from available inventory without backorders or stockouts. This tool provides critical insights into supply chain efficiency and inventory management by highlighting product availability and order fulfillment performance. Businesses use it to optimize stock levels, improve customer satisfaction, and reduce lost sales due to unfulfilled orders.
Obsolete Inventory Evaluation
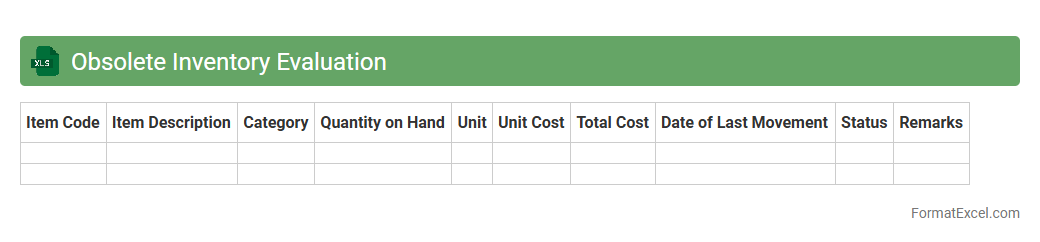
The
Obsolete Inventory Evaluation Excel document is a tool designed to identify and analyze inventory items that are no longer sellable or in demand, helping businesses efficiently manage stock and reduce holding costs. It provides detailed insights by categorizing obsolete items based on factors like aging, turnover rates, and market relevance, enabling informed decisions on write-offs and clearance strategies. This document supports financial accuracy and operational efficiency by preventing excess inventory from impacting cash flow and warehouse space.
Demand Forecast Accuracy
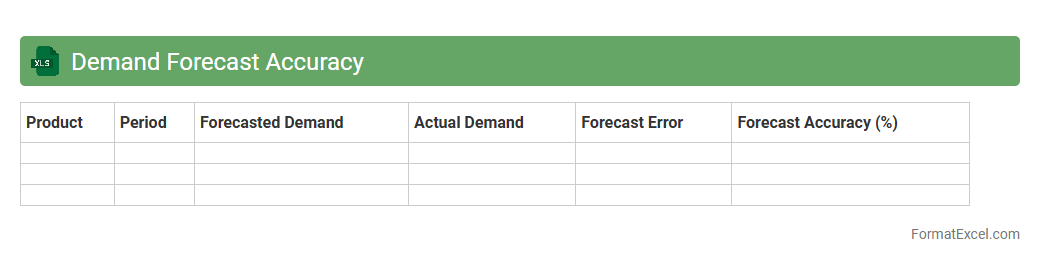
The
Demand Forecast Accuracy Excel document is a tool designed to measure and analyze the precision of sales predictions compared to actual demand. It helps businesses identify forecasting errors, optimize inventory levels, and improve supply chain efficiency. By providing clear insights through data visualization and accuracy metrics, it supports better decision-making and reduces costs associated with overstocking or stockouts.
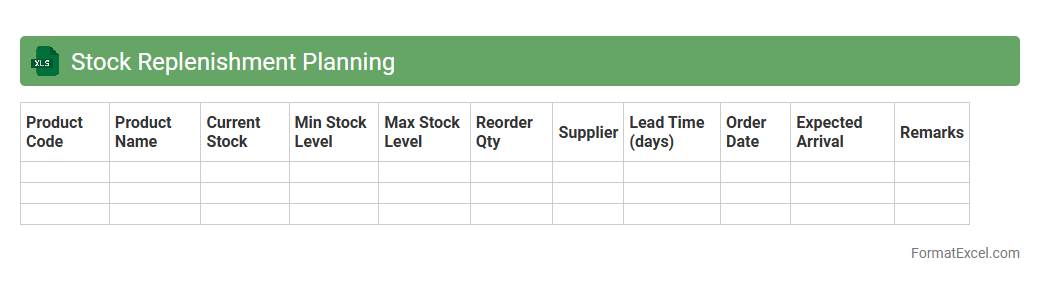
Stock Replenishment Planning
Stock Replenishment Planning Excel document is a powerful tool designed to manage inventory levels efficiently by forecasting demand and scheduling reorder points. It helps businesses avoid stockouts and overstock situations by providing accurate data on optimal order quantities and timing. This
inventory management solution enhances decision-making, reduces carrying costs, and maintains smooth supply chain operations.
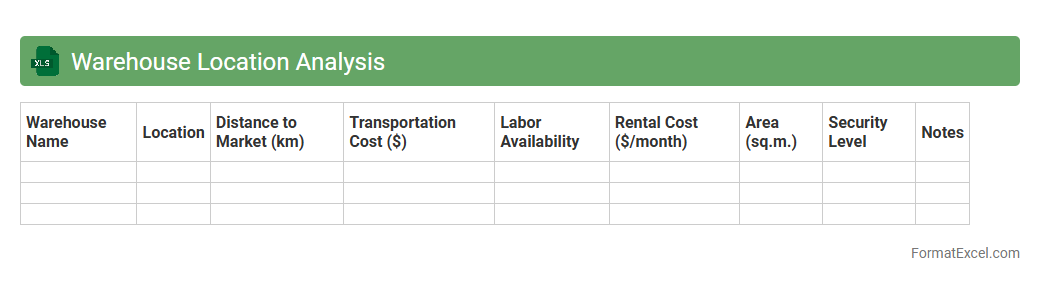
Warehouse Location Analysis
The
Warehouse Location Analysis Excel document is a tool designed to evaluate and compare potential warehouse sites based on key factors like transportation costs, proximity to customers, and facility expenses. It helps businesses optimize supply chain efficiency by identifying the most strategic locations that minimize costs and improve delivery times. Using this analysis supports informed decision-making, leading to enhanced inventory management and operational savings.
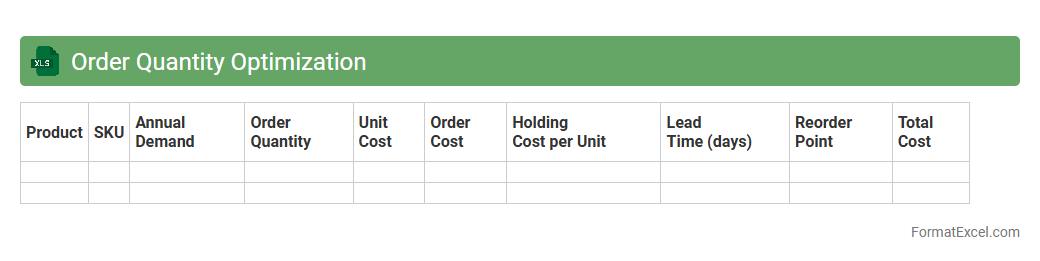
Order Quantity Optimization
Order Quantity Optimization Excel document is a powerful tool designed to calculate the ideal order size that minimizes costs while meeting demand effectively. By analyzing variables such as inventory holding costs, ordering costs, and demand rates, it helps businesses maintain optimal stock levels and avoid overstocking or stockouts. This
optimization model enhances decision-making, improves cash flow management, and increases overall supply chain efficiency.
Inventory Write-off Tracking
An
Inventory Write-off Tracking Excel document is a tool designed to record and monitor inventory items that are written off due to damage, obsolescence, theft, or loss. It helps businesses maintain accurate financial records by providing detailed insights into the value and quantity of inventory removed from stock. This tracking enhances inventory management efficiency, supports accurate accounting, and assists in identifying patterns to reduce future inventory losses.
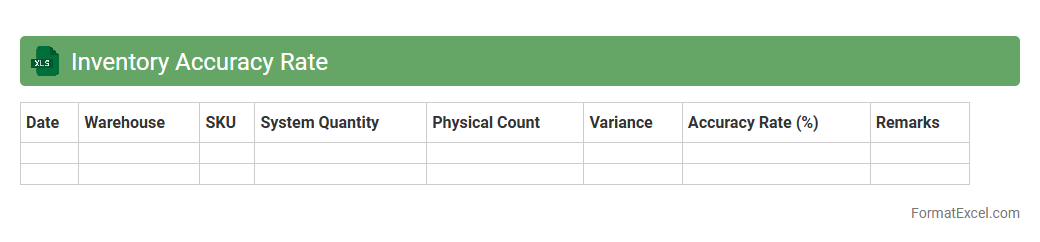
Inventory Accuracy Rate
The
Inventory Accuracy Rate Excel document is a tool designed to measure and track the precision of inventory records compared to physical stock counts. It helps businesses identify discrepancies, streamline inventory management, and optimize supply chain operations by providing clear metrics on stock accuracy. This document aids in reducing stockouts, minimizing excess inventory, and improving overall operational efficiency.
Introduction to Inventory Analysis in Excel
Inventory analysis in Excel allows businesses to track and manage stock efficiently using spreadsheet tools. It integrates data organization with automated calculations for better decision-making. The Excel platform is essential for simplifying inventory management processes.
Key Components of an Inventory Analysis Format
An effective inventory analysis format includes item details, stock quantities, reorder points, and sales data. These components help monitor inventory health and identify trends. Understanding these key components ensures accurate inventory tracking.
Setting Up the Excel Spreadsheet for Inventory Analysis
Start by creating columns like Item ID, Description, Quantity, and Reorder Level. Organize data logically to facilitate easy updates and analysis. Properly structured Excel spreadsheets form the foundation of efficient inventory management.
Essential Columns for Inventory Tracking
The critical columns include Item Name, SKU, Stock Quantity, Unit Price, and Supplier Information. Additional fields for reorder threshold and last restock date enhance tracking accuracy. These essential columns help maintain detailed inventory records.
Calculating Inventory Turnover and Stock Levels
Inventory turnover measures how fast stock is sold and replaced over a period. Use formulas to calculate turnover rates and monitor current stock levels. These calculations provide insights into inventory performance and demand trends.
Conditional Formatting for Inventory Alerts
Apply conditional formatting to highlight low stock or overstock situations automatically. This visual aid enables quick identification of items needing attention. Using conditional formatting improves response time for inventory adjustments.
Incorporating Formulas for Automated Analysis
Utilize Excel formulas such as SUM, IF, and VLOOKUP to automate inventory calculations and error checking. Automated analysis reduces manual errors and saves time. Excel's formula functions enhance data accuracy in inventory management.
Visualizing Inventory Data with Excel Charts
Create bar charts, pie charts, or line graphs to represent inventory trends and stock distribution visually. Charts help communicate data clearly to stakeholders and facilitate strategic planning. Effective use of Excel charts supports better inventory decisions.
Sample Inventory Analysis Excel Template
A well-designed template includes predefined columns, formulas, and formatting for ease of use. It serves as a ready-made tool for consistent and efficient inventory tracking. Using a sample template accelerates setup and improves accuracy.
Tips for Maintaining Accurate Inventory Records
Regularly update stock information, conduct physical counts, and validate data entries to ensure accuracy. Consistent record-keeping prevents discrepancies and supports inventory control. These best practices are vital for reliable inventory management.