Pivot Table Fields
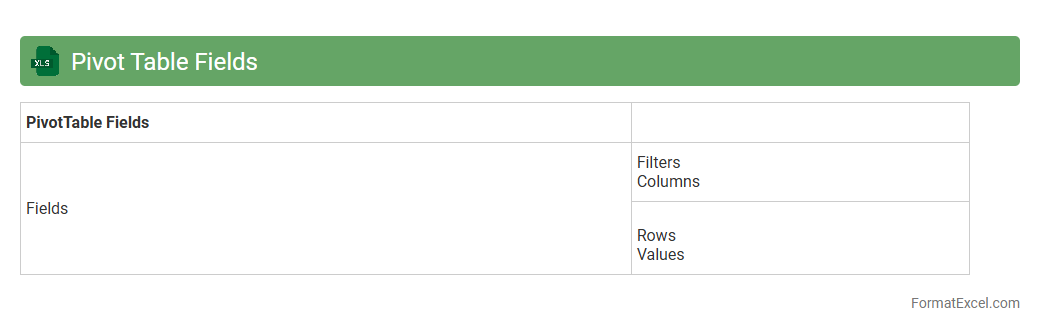
Pivot Table Fields in an Excel document allow users to dynamically organize and summarize large datasets by dragging and dropping fields into areas like Rows, Columns, Values, and Filters. This feature enables efficient data analysis by quickly generating insights, identifying trends, and comparing metrics without altering the original data. Using
Pivot Table Fields enhances decision-making processes by providing a flexible and interactive way to explore complex information.
Pivot Table Slicers
Pivot Table Slicers in Excel are
visual filtering tools that allow users to quickly and easily segment data within a Pivot Table by selecting specific values. They enhance data analysis by providing an intuitive interface to filter complex datasets, making insights more accessible without altering the underlying data. Slicers improve efficiency in reporting and decision-making by enabling real-time dynamic data exploration and comparison.
Pivot Table Filters
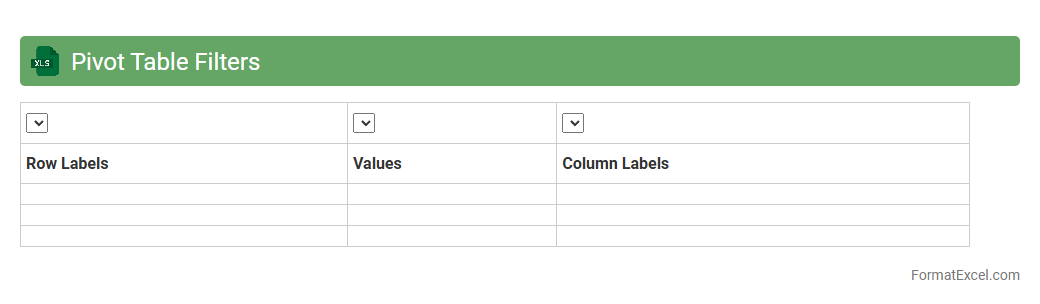
Pivot Table Filters in Excel allow users to refine and customize data views by selectively displaying information based on specific criteria. This feature enhances data analysis by enabling quick isolation of relevant subsets, improving clarity and decision-making efficiency. Utilizing
Pivot Table Filters simplifies complex datasets, making it easier to identify trends and patterns without altering the original data structure.
Pivot Table Groups
Pivot Table Groups in an Excel document allow users to organize data by categorizing related items into defined groups, making large datasets easier to analyze and interpret. This feature helps in summarizing information, identifying trends, and performing comparative analysis without altering the original data structure. Utilizing
Pivot Table Groups enhances data visualization and decision-making efficiency by streamlining complex data into manageable segments.
Pivot Table Calculated Fields
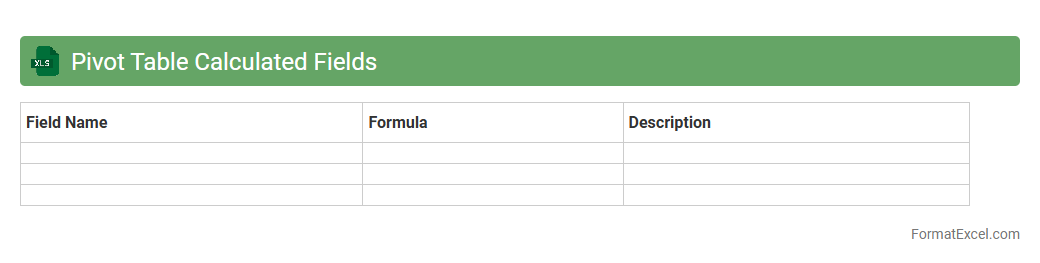
A
Pivot Table Calculated Field in Excel allows users to create custom formulas within a pivot table, enabling dynamic calculations based on the summarized data without altering the original dataset. This feature is useful for performing tailored analysis, such as calculating profit margins, growth rates, or ratios directly within the pivot table, enhancing data insights. It streamlines decision-making by providing real-time, flexible computations that adapt as the pivot table data changes.
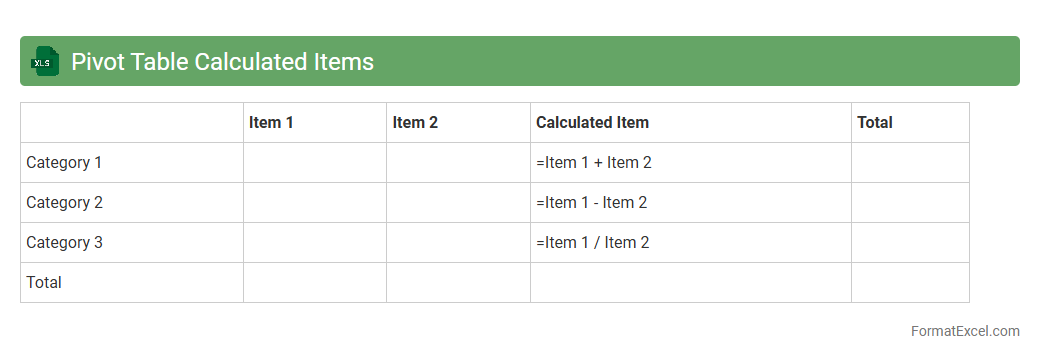
Pivot Table Calculated Items
A
Pivot Table Calculated Item in an Excel document allows users to create custom formulas within a Pivot Table by combining existing fields to perform dynamic calculations on grouped data. This feature enables advanced data analysis without altering the original dataset, enhancing decision-making through tailored insights. Calculated Items are particularly useful for comparing subsets, analyzing variances, and generating meaningful summaries in financial reports, sales data, or any multidimensional datasets.
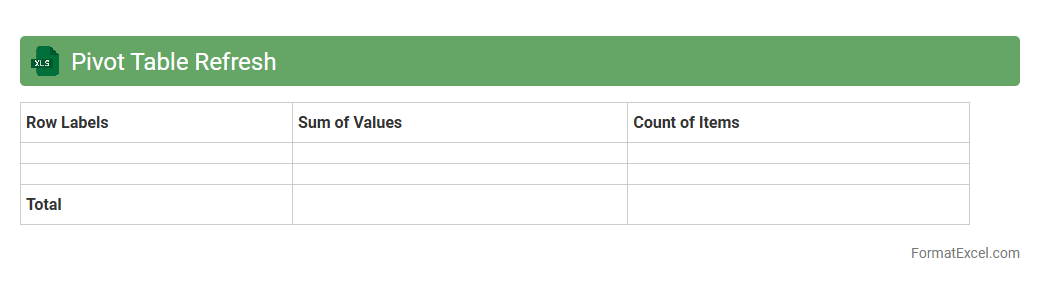
Pivot Table Refresh
Pivot Table Refresh in Excel is a process that updates the data in a
Pivot Table to reflect changes made in the original data source. It ensures that any new, modified, or deleted data is accurately represented in the summary, enabling real-time analysis and decision-making. This functionality is crucial for maintaining data integrity and providing up-to-date insights without rebuilding the Pivot Table from scratch.
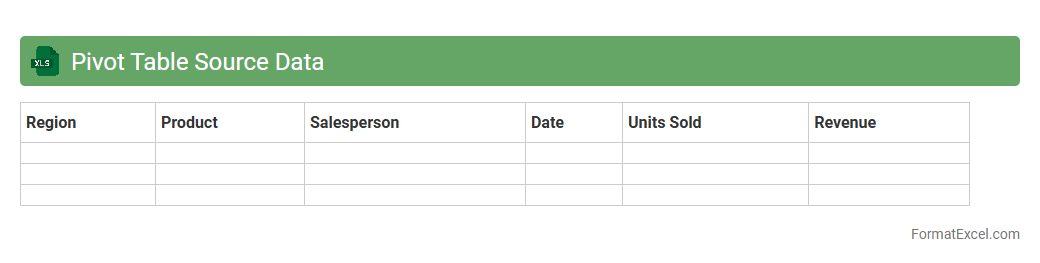
Pivot Table Source Data
Pivot Table Source Data is the
original dataset that feeds into a Pivot Table, containing rows and columns of raw information such as sales figures, dates, and categories. It allows users to organize, summarize, and analyze large volumes of data efficiently by enabling quick aggregation and filtering based on different fields. Utilizing clean and well-structured source data enhances decision-making by providing clear insights and trends through dynamic reports and charts in Excel.
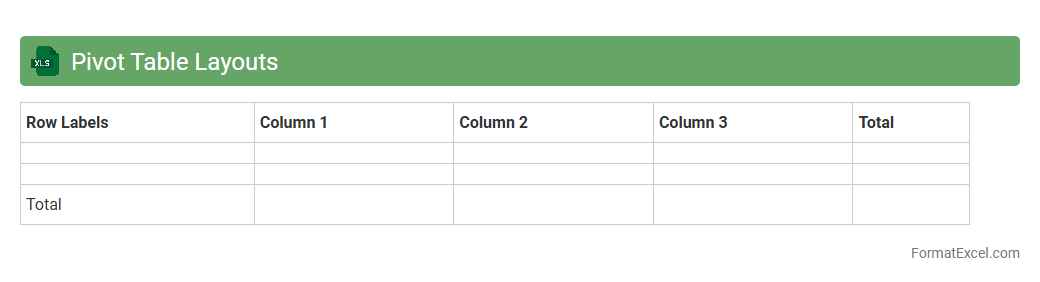
Pivot Table Layouts
A
Pivot Table Layout in an Excel document organizes data dynamically, allowing users to summarize large datasets by arranging fields in rows, columns, and values to extract meaningful insights quickly. It is useful for comparing data trends, aggregating totals, and performing detailed analysis without altering the original data source. This feature enhances decision-making by providing customizable views and interactive reports tailored to specific analytical needs.
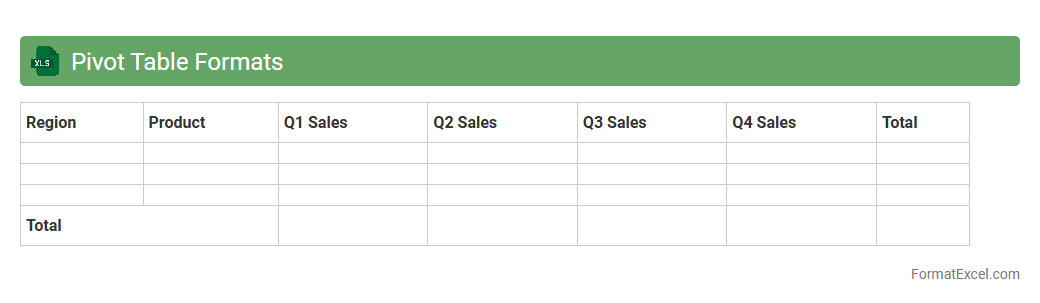
Pivot Table Formats
Pivot Table Formats in Excel are predefined styles that enhance the visual presentation and readability of pivot tables by applying consistent colors, fonts, and layouts. Using
Pivot Table Formats allows users to quickly analyze and summarize large data sets, making trends and patterns easier to identify. These formats improve decision-making efficiency by providing clear, organized views of complex information.
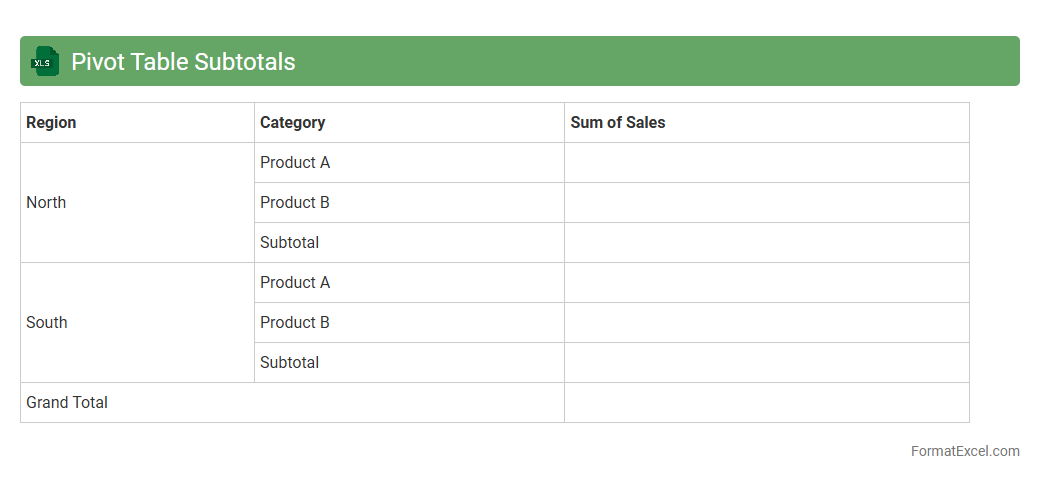
Pivot Table Subtotals
Pivot Table Subtotals in an Excel document summarize data by automatically calculating intermediate totals for each group within a dataset, enhancing data organization and analysis. This feature allows users to quickly identify patterns and insights by displaying aggregated values, such as sums or averages, for different categories without manually calculating each subtotal. Utilizing
Pivot Table Subtotals streamlines data review and decision-making processes, making complex data sets more comprehensible and actionable.
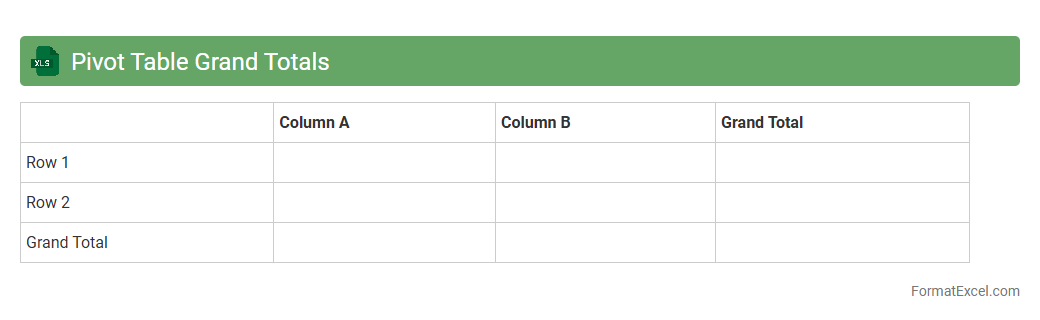
Pivot Table Grand Totals
Pivot Table Grand Totals in an Excel document summarize the overall totals for rows and columns within a pivot table, providing a quick snapshot of the aggregated data. They are essential for analyzing large datasets as they highlight total values without the need to manually sum individual entries. Using
Pivot Table Grand Totals saves time and enhances data interpretation by offering clear, concise summaries of complex information.
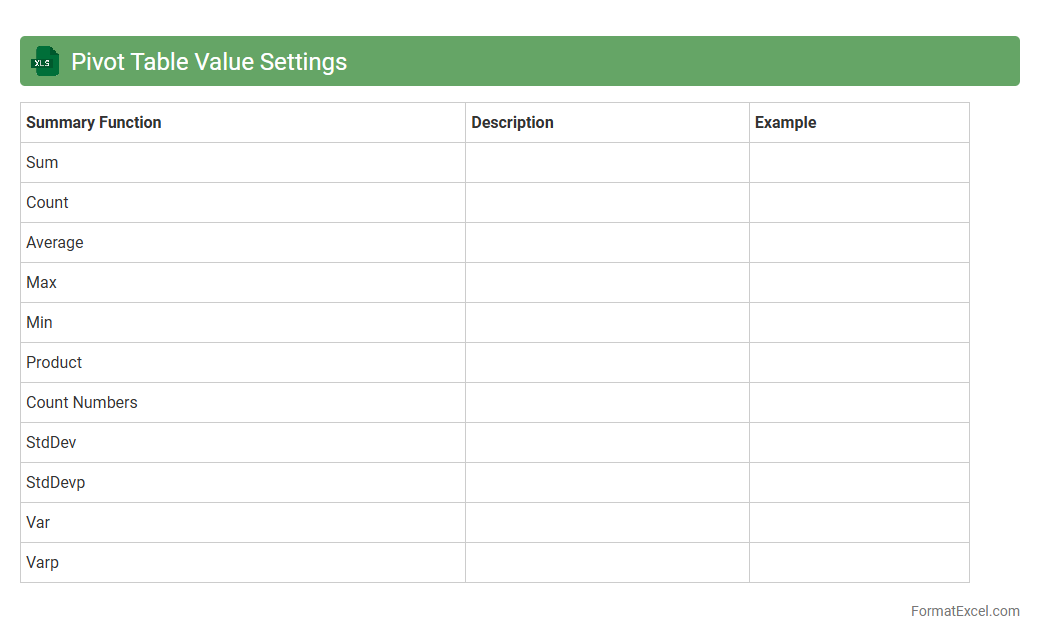
Pivot Table Value Settings
The
Pivot Table Value Settings in Excel allow users to customize how data is summarized and displayed within a pivot table, including options like sum, average, count, and percentage calculations. This feature enhances data analysis by enabling precise control over the aggregation method, facilitating clearer insights and more accurate reporting. Using value settings effectively helps transform raw data into meaningful summaries, making it easier to identify trends and make informed decisions.
Pivot Table Sorting
Pivot Table Sorting in Excel allows users to organize data dynamically by arranging the summarized information based on specific criteria such as alphabetical order, numerical values, or custom lists. This feature enhances data analysis by enabling quick identification of trends, outliers, and key insights within large datasets. Using
Pivot Table Sorting improves decision-making efficiency by presenting the most relevant data in an easily interpretable format.
Pivot Table Drill Down
A
Pivot Table Drill Down in Excel allows users to explore the underlying data that makes up a summary value in a Pivot Table by double-clicking on any cell, which generates a detailed worksheet with all relevant records. This feature is invaluable for data analysis, enabling users to quickly identify trends, anomalies, or specific transaction details without manually searching through large datasets. By providing instant access to granular data, the Pivot Table Drill Down enhances decision-making accuracy and saves time during complex reporting tasks.
Pivot Table Conditional Formatting
Pivot Table Conditional Formatting in Excel is a powerful tool that allows users to apply customized formatting rules to data within a pivot table based on specific conditions. By highlighting trends, patterns, and outliers using color scales, data bars, or icon sets, it enhances data visualization and makes complex data more understandable. This feature is especially useful for quickly identifying key metrics and making informed decisions without manually analyzing raw data.
Pivot Table Multiple Consolidation Ranges
A
Pivot Table Multiple Consolidation Ranges in Excel allows users to combine data from different ranges or worksheets into a single pivot table for comprehensive analysis. This feature is especially useful for summarizing large datasets from multiple sources, enabling quick comparison and aggregation without manually merging the data. By leveraging this tool, users can gain valuable insights and streamline reporting processes across various data sets efficiently.
Pivot Table Compatibility
A
Pivot Table Compatibility Excel document ensures seamless integration and functionality of pivot tables across different versions and platforms of Excel, preventing data misalignment and feature loss. It allows users to analyze large datasets by summarizing, sorting, reorganizing, grouping, and filtering data dynamically, providing actionable insights with minimal effort. This compatibility feature enhances collaboration and efficiency by maintaining the integrity of complex data models during sharing and editing.
Pivot Table Connections
Pivot Table Connections in an Excel document are links that connect multiple pivot tables to the same data source, enabling synchronized filtering and updating across all related tables. This feature is particularly useful for managing large datasets, as it ensures consistency and saves time by allowing changes in one pivot table to automatically reflect in others. Using
Pivot Table Connections enhances data analysis efficiency, making it easier to gain cohesive insights from complex or multi-faceted data.
Pivot Table Data Model
A
Pivot Table Data Model in an Excel document is a powerful feature that integrates multiple tables of data, allowing users to create complex, dynamic reports without needing to use traditional VLOOKUP or manual data consolidation. It organizes and summarizes large datasets efficiently, enabling swift data analysis and insightful decision-making. This model enhances data management by leveraging relationships between tables, optimizing performance and flexibility in reporting.
Pivot Table Relationships
Pivot Table Relationships in Excel enable users to create connections between multiple tables without the need to combine data into a single table. This feature allows for dynamic data analysis across different datasets by using common fields to generate comprehensive PivotTables. Leveraging
Pivot Table Relationships enhances efficiency in reporting, facilitates complex data modeling, and provides deeper insights through seamless integration of related data sources.
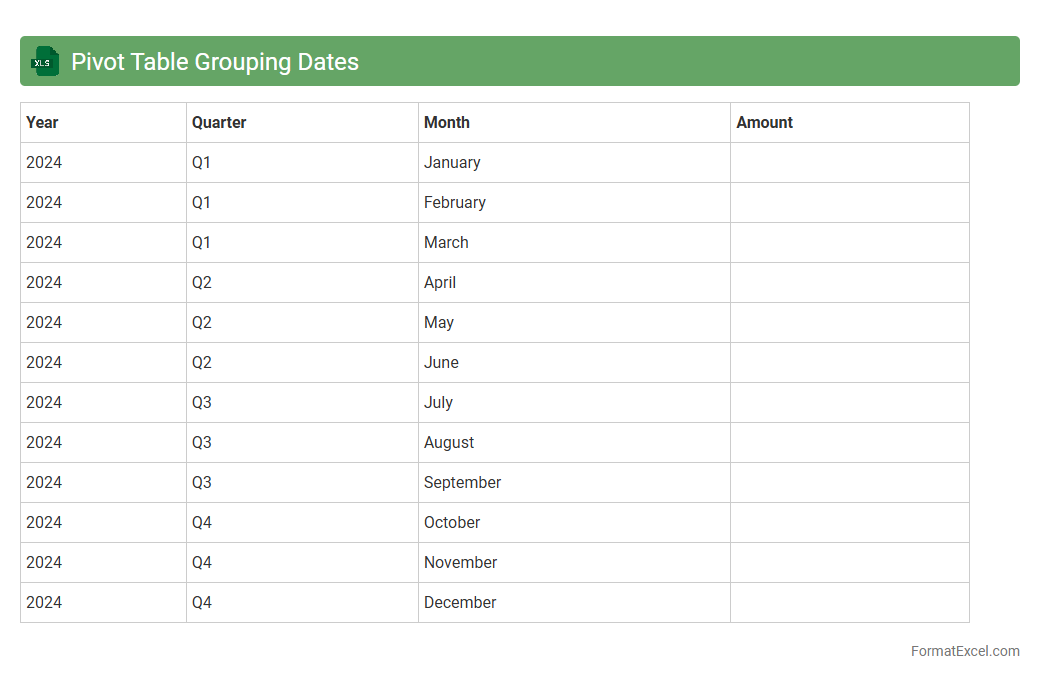
Pivot Table Grouping Dates
Pivot Table Grouping Dates in Excel allows users to organize and summarize large datasets by categorizing date values into meaningful groups such as months, quarters, or years. This feature enhances data analysis by enabling quick comparisons and trend identification over specific time periods. Using
Pivot Table Grouping Dates improves reporting efficiency and provides clearer insights for decision-making processes.
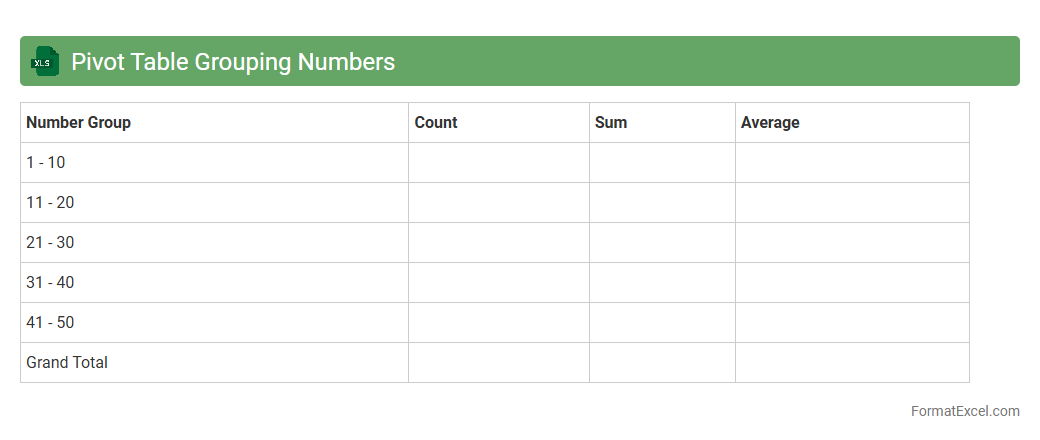
Pivot Table Grouping Numbers
Pivot Table Grouping Numbers in an Excel document allows users to organize numerical data into specified ranges or intervals, making large datasets more manageable and easier to analyze. This feature enables the creation of summarized views by grouping values such as sales figures, ages, or dates, helping to identify trends and patterns quickly. Using
Pivot Table Grouping streamlines data interpretation and supports efficient decision-making through clearer insights.
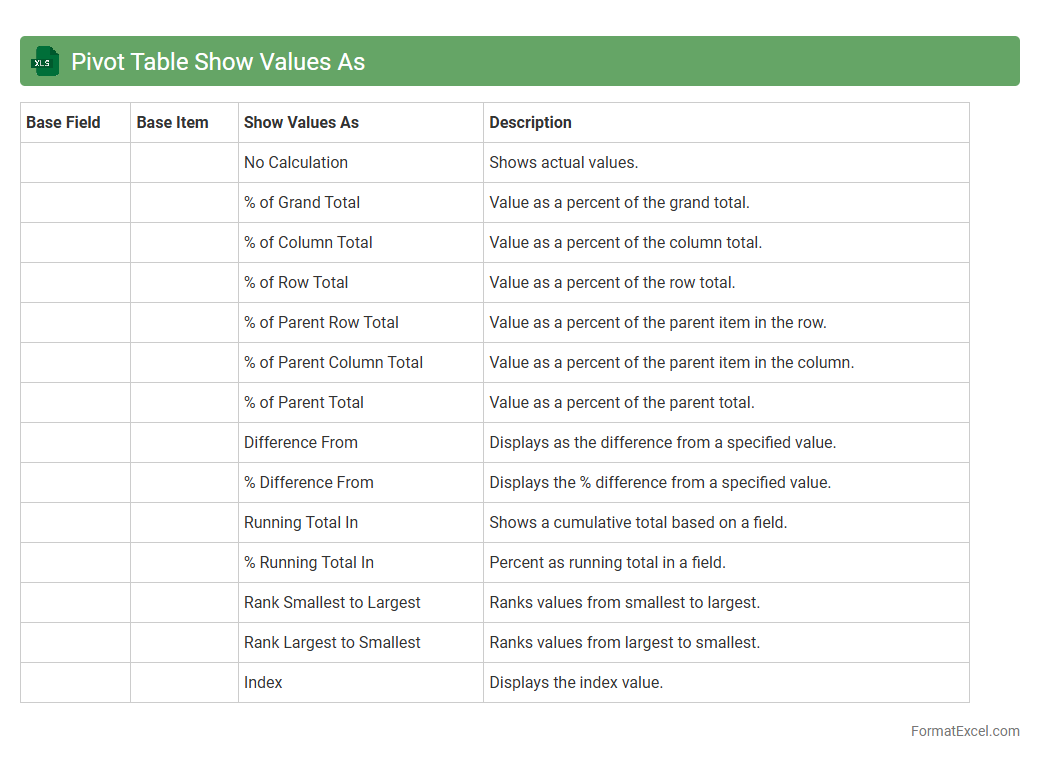
Pivot Table Show Values As
A
Pivot Table Show Values As feature in Excel allows users to display data in various summary calculations such as percentage of total, running total, difference from previous values, or rank without altering the original data. This functionality enables deeper data analysis and comparison by dynamically transforming how values are represented in the pivot table. Utilizing Show Values As helps in uncovering trends, making data-driven decisions, and enhancing financial reports or business intelligence insights efficiently.
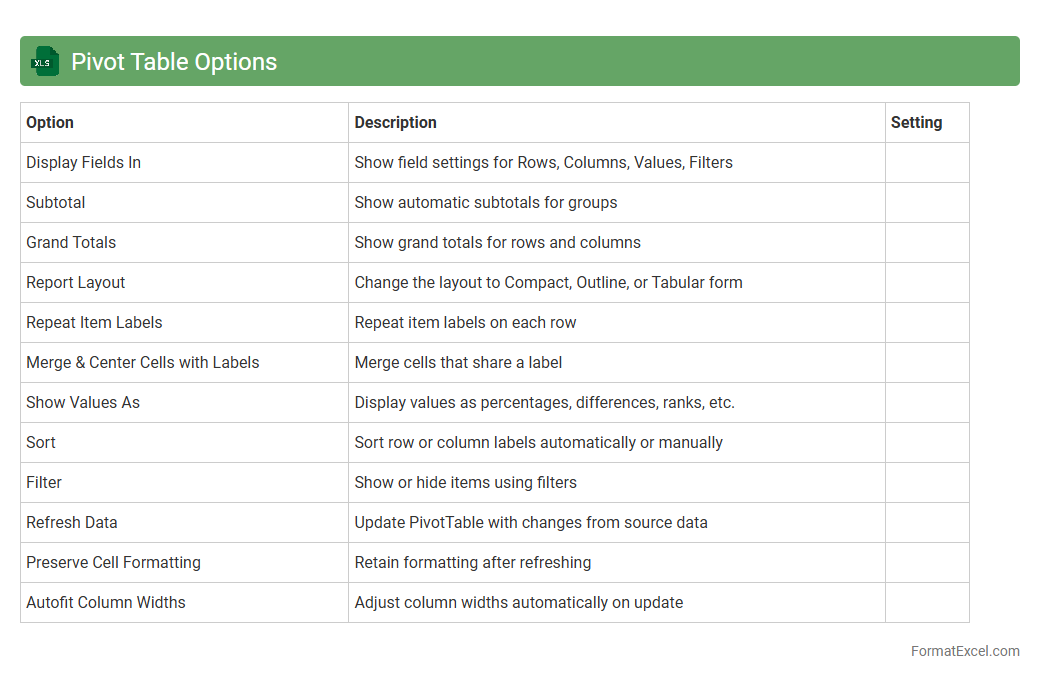
Pivot Table Options
Pivot Table Options in Excel provide a range of customizable settings that enhance data analysis by allowing users to control layout, formatting, and summary calculations within a Pivot Table. These options enable efficient management of data presentation by adjusting filters, enabling or disabling grand totals, and refreshing data dynamically. Mastering
Pivot Table Options helps users derive meaningful insights quickly, improving decision-making and reporting accuracy.
Introduction to Pivot Table Format in Excel
A Pivot Table in Excel is a powerful tool that allows users to summarize and analyze large datasets quickly. It provides a dynamic way to organize data into meaningful reports by dragging and dropping fields. Proper formatting enhances readability and helps in better data interpretation.
Understanding Pivot Table Structure
The core structure of a Pivot Table includes rows, columns, values, and filters, each serving a unique role in data analysis. Rows and columns categorize data, while values represent the summarized data points. Filters allow focusing on specific data subsets for deeper insights.
Accessing Pivot Table Formatting Options
Excel offers various formatting options accessible through the PivotTable Tools tabs, primarily the Design and Analyze ribbons. Users can modify styles, apply themes, and adjust layout settings. These tools streamline the customization process to suit reporting needs.
Changing Pivot Table Styles
Pivot Table styles provide pre-defined formatting templates that enhance visual appeal and consistency. Users can select from a variety of style presets to highlight specific data areas or create a professional look quickly. Custom styles can also be created to match branding guidelines.
Customizing Number Formats in Pivot Tables
Changing the number format in a Pivot Table ensures data values are presented clearly, such as currency, percentages, or decimals. This customization makes the report more understandable and prevents misinterpretation. Number formats are adjusted via the Value Field Settings dialog.
Modifying Row and Column Labels Appearance
Adjusting the appearance of row and column labels improves the readability of the Pivot Table report. Formatting options include font size, color, and alignment to emphasize hierarchical data structure. Consistent styling of labels helps users quickly identify data categories.
Applying Conditional Formatting to Pivot Tables
Conditional formatting highlights specific data trends or outliers within a Pivot Table. By setting rules based on values, users can visually analyze patterns effortlessly. This feature enhances decision-making by making critical data points stand out.
Formatting Pivot Table Values
Properly formatted values in a Pivot Table improve clarity and impact. Value fields can be formatted to display as totals, averages, or other summaries. Applying consistent styles to these values ensures the data is both accurate and easy to interpret.
Best Practices for Pivot Table Formatting
Effective Pivot Table formatting involves clarity, simplicity, and consistency. Use contrasting colors for rows and columns, avoid excessive styles, and ensure data labels are clear. Following best practices enhances user experience and helps communicate insights effectively.
Common Pivot Table Formatting Mistakes to Avoid
Common mistakes include overusing colors, inconsistent font sizes, and neglecting number formats. These errors can make the Pivot Table confusing and difficult to read. Avoiding such pitfalls ensures your report remains professional and functional.