Monthly Budget Variance Report
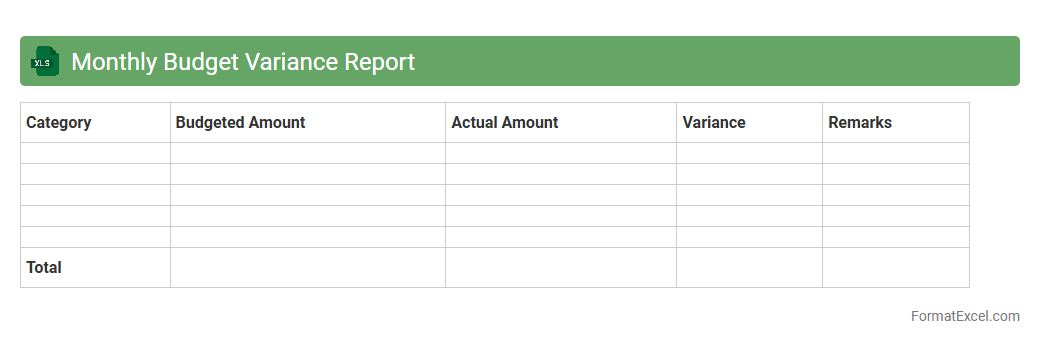
A
Monthly Budget Variance Report Excel document systematically tracks the differences between budgeted and actual expenses or revenues within a given month. It helps organizations identify areas where spending deviates from planned amounts, allowing for timely adjustments and improved financial control. By analyzing trends in budget variances, businesses can optimize resource allocation and enhance forecasting accuracy.
Sales Performance Variance
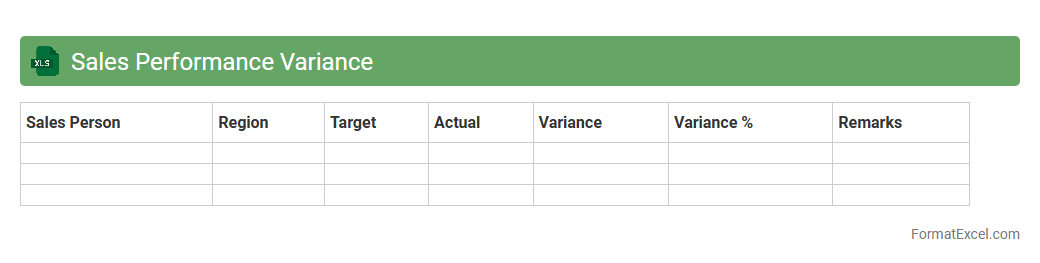
The
Sales Performance Variance Excel document tracks the difference between actual sales and sales targets, enabling businesses to analyze performance effectively. It provides insights into areas where sales exceed or fall short of expectations, supporting data-driven decision-making and strategy adjustments. This tool enhances forecasting accuracy and helps identify trends, contributing to improved sales management and revenue growth.
Expense Variance Summary
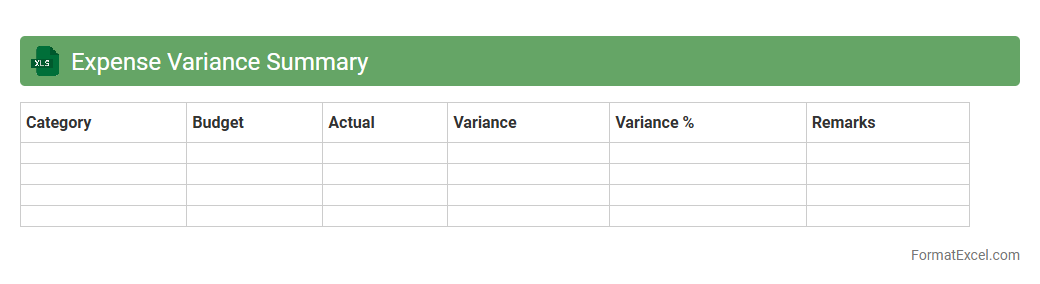
The
Expense Variance Summary Excel document provides a clear comparison between budgeted and actual expenses, highlighting discrepancies that affect financial performance. By analyzing variance data, businesses can identify overspending or savings, enabling more accurate forecasting and cost control. This tool is essential for maintaining fiscal discipline and supporting strategic decision-making within any organization.
Revenue Variance Analysis
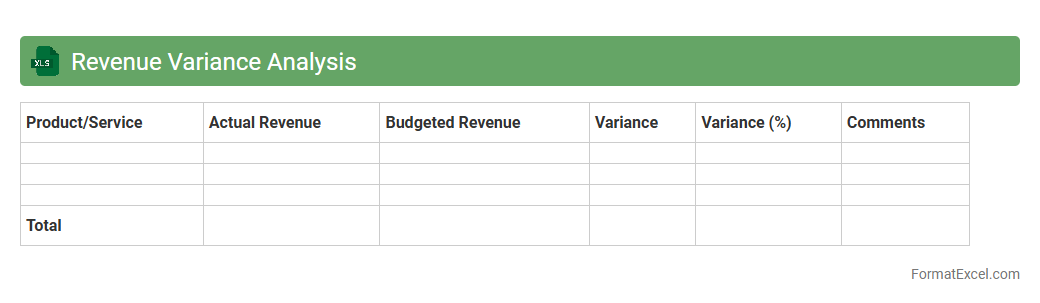
Revenue Variance Analysis Excel document is a powerful tool designed to compare actual revenue against budgeted or forecasted figures, highlighting discrepancies and enabling detailed financial insights. This analysis helps businesses identify the causes of revenue fluctuations by breaking down variances into price, volume, and mix components. Utilizing
Revenue Variance Analysis allows organizations to make informed decisions, optimize sales strategies, and improve financial forecasting accuracy.
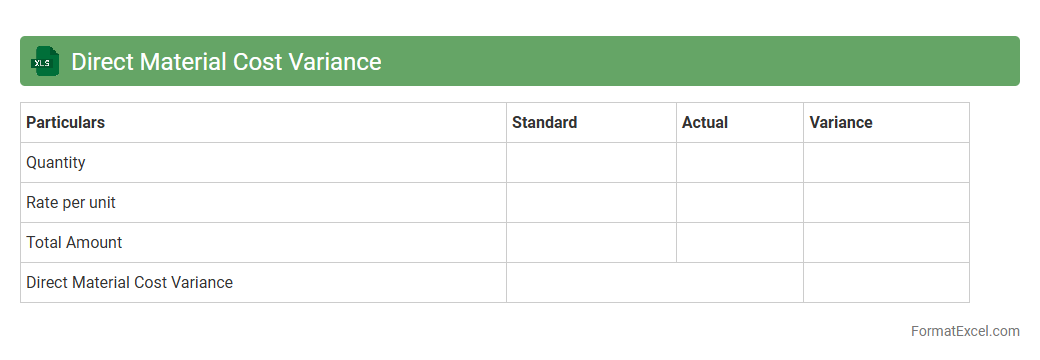
Direct Material Cost Variance
The
Direct Material Cost Variance Excel document is a powerful tool designed to analyze the difference between the standard cost and actual cost of materials used in production. It helps businesses identify cost inefficiencies, control budgeting, and improve overall cost management by highlighting variances in material expenses. Utilizing this document enables manufacturers to make informed decisions on purchasing, inventory, and process improvements, ultimately enhancing profitability.
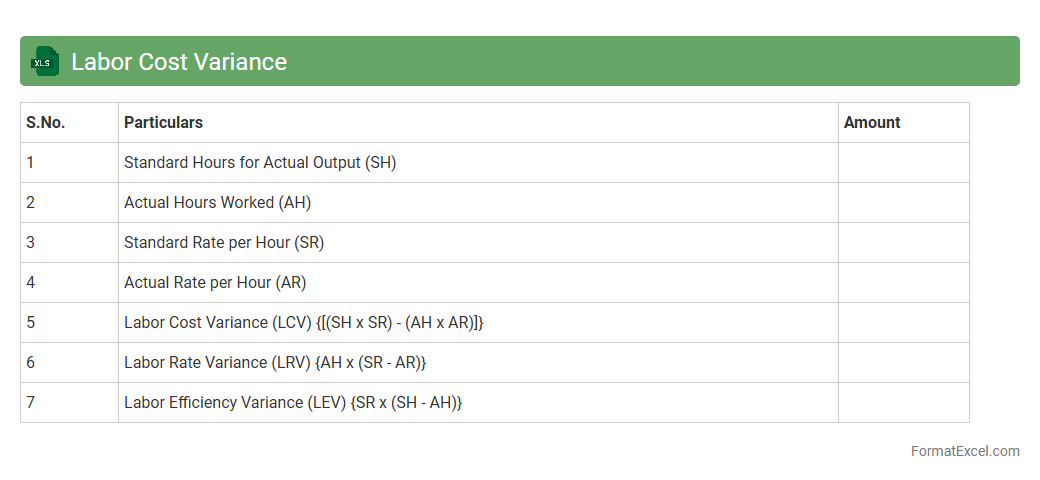
Labor Cost Variance
The
Labor Cost Variance Excel document tracks the difference between actual labor costs and standard labor costs, helping businesses identify discrepancies in workforce spending. It provides valuable insights for management to control budgets, improve payroll accuracy, and enhance operational efficiency. By analyzing this variance, companies can optimize labor allocation and reduce unnecessary expenses.
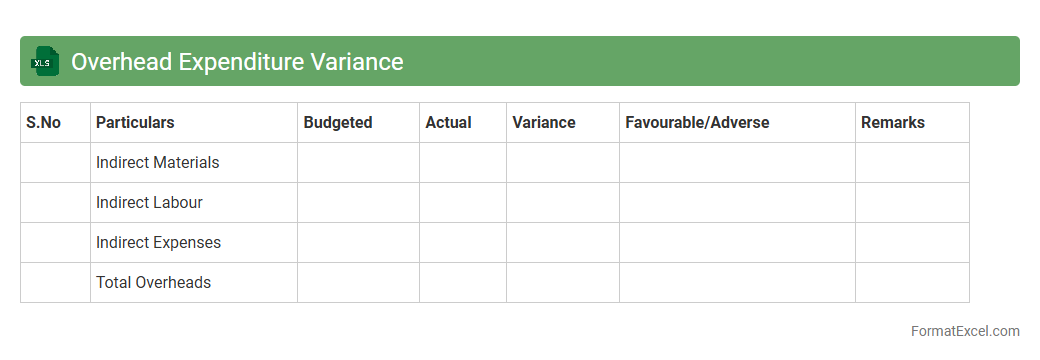
Overhead Expenditure Variance
The
Overhead Expenditure Variance Excel document is a financial tool that tracks and analyzes the differences between actual overhead costs and budgeted overhead expenses. It enables businesses to identify cost control issues by highlighting areas where spending exceeds or falls below the planned budget. This variance analysis helps improve budgeting accuracy, optimize resource allocation, and enhance overall financial performance.
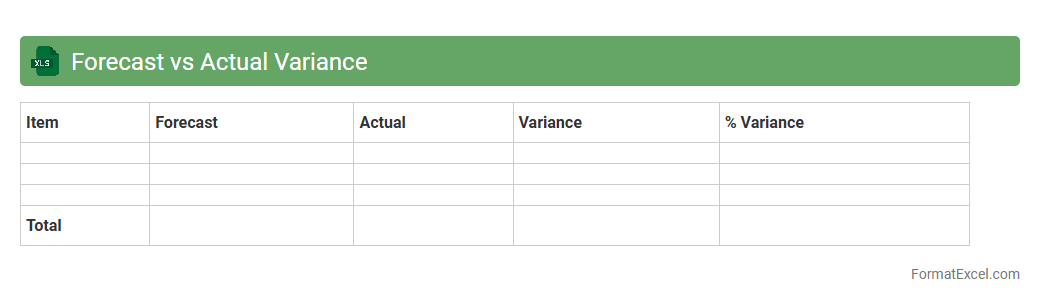
Forecast vs Actual Variance
A
Forecast vs Actual Variance Excel document is a tool used to compare projected financial or operational metrics against the real outcomes. It highlights discrepancies between expected and actual performance, allowing businesses to identify trends, manage budgets, and make informed decisions. This variance analysis is essential for improving accuracy in future forecasts and optimizing resource allocation.
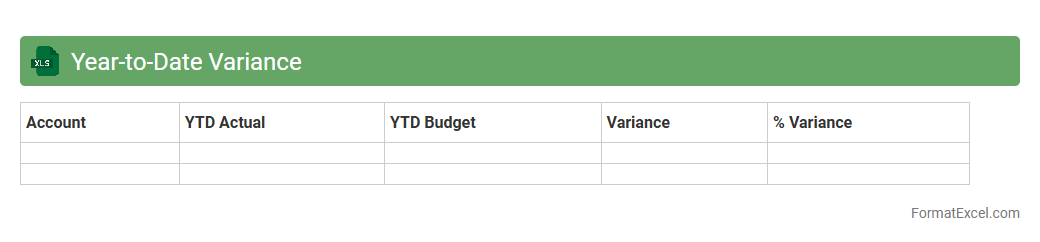
Year-to-Date Variance
The
Year-to-Date Variance Excel document tracks the difference between actual and budgeted financial figures from the start of the year to the current date, highlighting deviations in revenue, expenses, or profits. It allows businesses to monitor performance against targets, identify trends, and make informed decisions to control costs and optimize budgets. This tool is essential for financial analysis, forecasting accuracy, and strategic planning throughout the fiscal year.
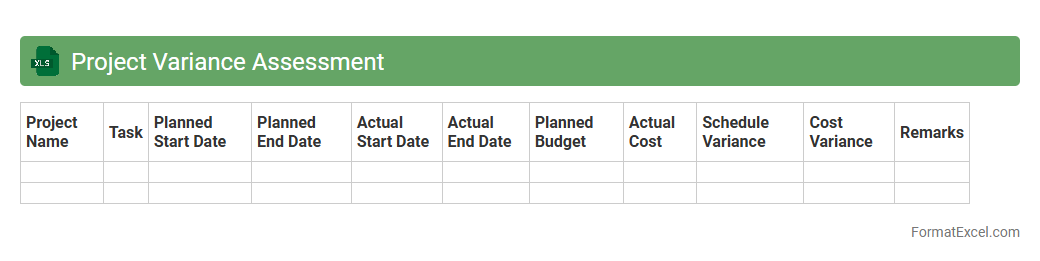
Project Variance Assessment
The
Project Variance Assessment Excel document is a tool designed to track and analyze differences between planned and actual project performance metrics such as time, cost, and resource allocation. It helps project managers identify deviations early, enabling prompt corrective actions to keep the project on schedule and within budget. By providing clear visibility into variance data, this document improves decision-making and enhances project control.
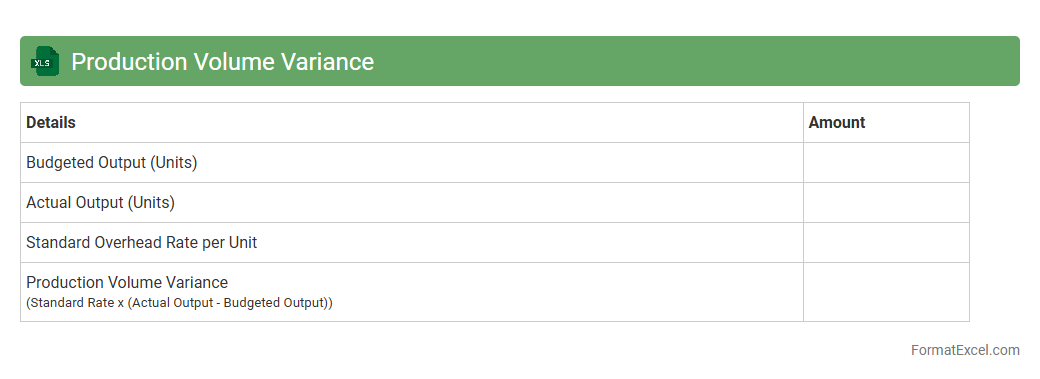
Production Volume Variance
The
Production Volume Variance Excel document calculates the difference between the budgeted production volume and the actual production volume, helping businesses identify cost discrepancies. This tool enables accurate tracking of fixed overhead costs related to production, facilitating better budget control and financial analysis. By analyzing these variances, companies can improve operational efficiency and make informed decisions for resource allocation.
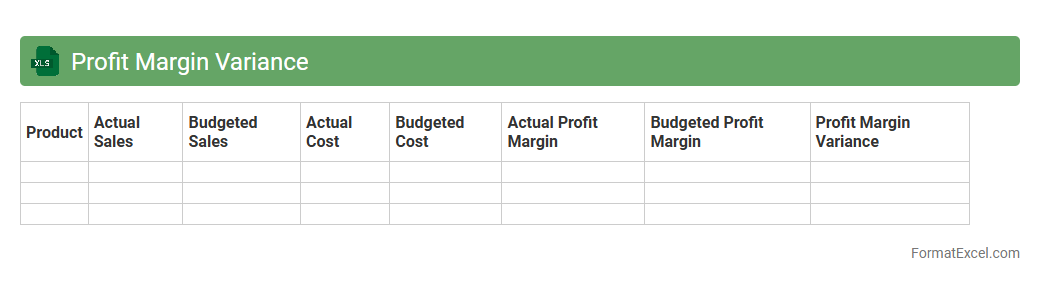
Profit Margin Variance
A
Profit Margin Variance Excel document is a financial analysis tool that compares actual profit margins against budgeted or expected margins, highlighting discrepancies. This variance analysis helps businesses identify areas where costs or revenues deviate, enabling informed decision-making to improve profitability. By tracking profit margin changes over time, companies can optimize pricing strategies, control expenses, and enhance overall financial performance.
Price Variance Analysis
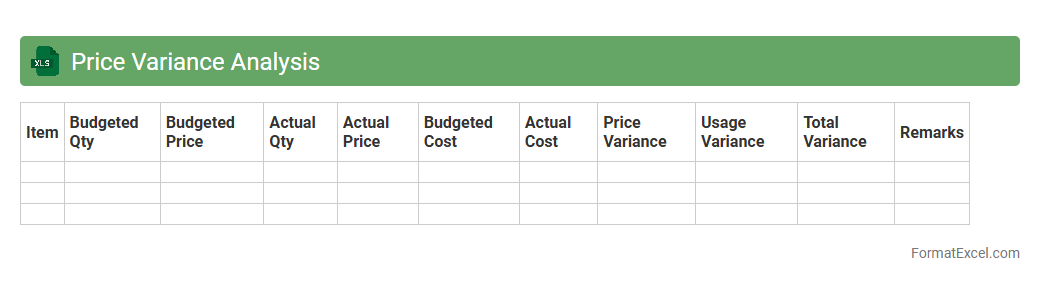
Price Variance Analysis Excel document is a powerful tool designed to compare the actual cost of materials or products against the standard or expected costs, highlighting discrepancies in pricing. This analysis helps businesses identify inefficiencies, control costs, and make informed purchasing decisions by pinpointing areas where prices deviate from the budget. The
Price Variance Analysis Excel document streamlines data organization and enhances accuracy in tracking cost fluctuations over time.
Spending Variance Tracker
The
Spending Variance Tracker Excel document is a financial tool designed to monitor and compare actual expenses against budgeted amounts, helping identify discrepancies quickly. It allows users to analyze spending patterns and manage cash flow effectively by highlighting areas where costs exceed or fall below expectations. This tool is essential for maintaining budget control, improving financial planning accuracy, and supporting informed decision-making.
Balance Sheet Variance
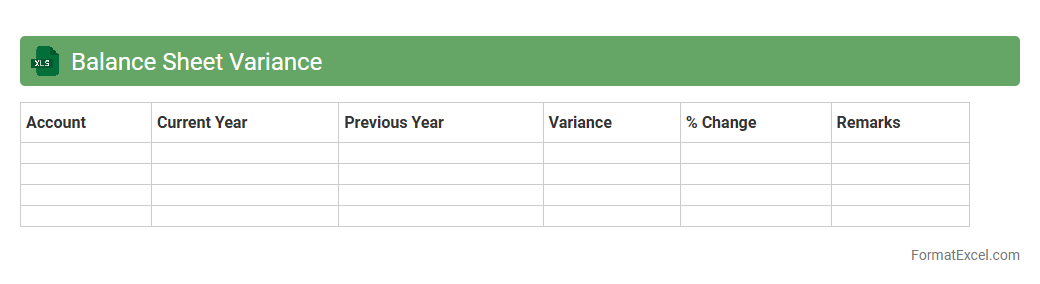
A
Balance Sheet Variance Excel document is a financial tool used to compare actual balance sheet figures against budgeted or prior period amounts, highlighting differences for analysis. It enables organizations to identify discrepancies in assets, liabilities, and equity, facilitating accurate financial control and decision-making. By providing clear insights into variances, this document supports improved budgeting, forecasting, and overall financial management.
Service Delivery Variance
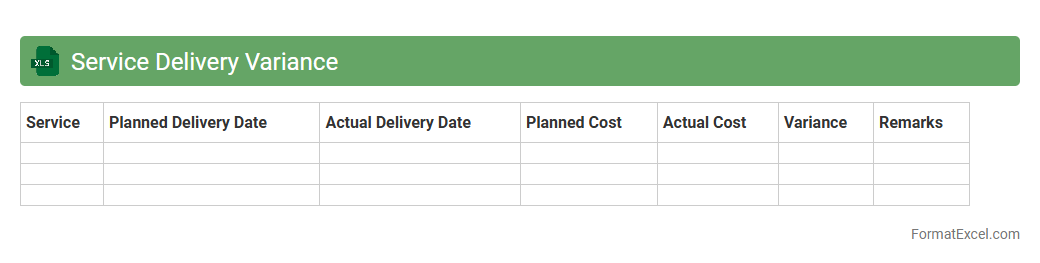
The
Service Delivery Variance Excel document tracks deviations between planned and actual service performance metrics, enabling precise identification of gaps in delivery quality or timelines. It is useful for analyzing key performance indicators (KPIs), facilitating data-driven decision-making, and improving operational efficiency by highlighting areas that require corrective action. This tool supports continuous improvement efforts by providing a clear, visual representation of service inconsistencies.
Departmental Variance Dashboard
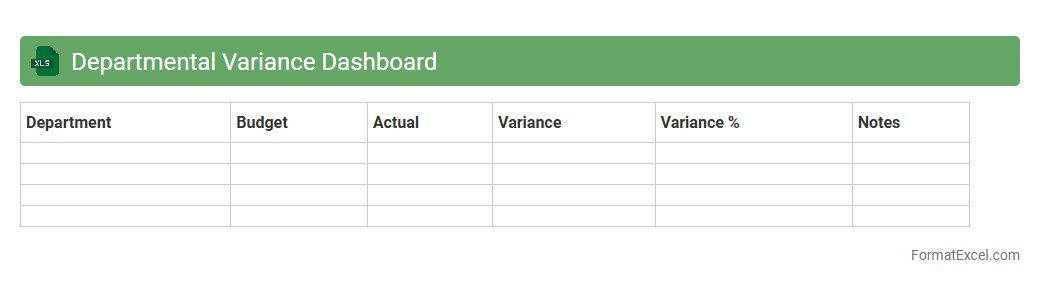
The
Departmental Variance Dashboard Excel document is a powerful tool designed to track and analyze financial and operational variances across different departments within an organization. It consolidates budgeted versus actual performance data, enabling managers to quickly identify discrepancies and understand underlying causes. This dashboard enhances decision-making by providing clear visual insights, promoting accountability, and facilitating timely corrective actions to optimize departmental performance.
Product Line Variance
The
Product Line Variance Excel document is a financial analysis tool designed to track and compare actual versus budgeted costs and revenues across different product lines. It helps identify discrepancies in production efficiency, sales performance, and cost management, enabling businesses to pinpoint areas requiring attention and optimize resource allocation. By analyzing variance data, companies can make informed decisions that enhance profitability and operational effectiveness.
Variance by Region
The
Variance by Region Excel document tracks and analyzes differences in key performance metrics across various geographic locations, highlighting areas where results deviate from expectations. It enables businesses to identify trends, spot underperforming regions, and allocate resources more effectively for targeted improvements. This insight supports strategic decision-making and optimizes regional performance management.
Standard Cost Variance
A
Standard Cost Variance Excel document is a financial tool used to compare actual costs against predetermined standard costs in production or operations. It helps identify discrepancies between expected and real expenditures, allowing businesses to analyze cost control efficiency and make informed budgeting decisions. Utilizing this document improves financial accuracy, enhances operational performance, and supports strategic planning by highlighting cost-saving opportunities.
Income Statement Variance
An
Income Statement Variance Excel document is a financial tool that compares actual income statement figures against budgeted or prior period results, highlighting differences in revenue, expenses, and profits. It helps businesses quickly identify areas of overperformance or underperformance, enabling more accurate financial analysis and decision-making. By streamlining variance tracking, this document supports budgeting accuracy, cost control, and strategic planning.
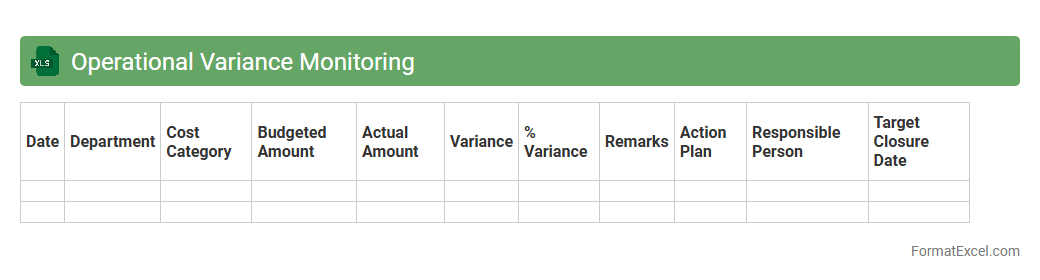
Operational Variance Monitoring
Operational Variance Monitoring Excel document is a
powerful tool designed to track and analyze discrepancies between planned and actual performance metrics in business operations. It enables timely identification of variances in costs, productivity, or timelines, allowing organizations to implement corrective actions and optimize resource allocation. This real-time visibility supports data-driven decision-making and fosters continuous improvement in operational efficiency.
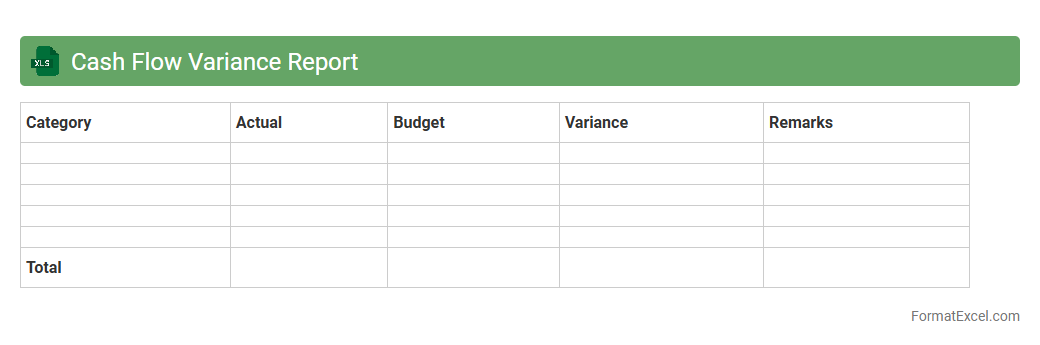
Cash Flow Variance Report
The
Cash Flow Variance Report Excel document tracks discrepancies between projected and actual cash flows, enabling businesses to monitor liquidity effectively. It highlights variances in inflows and outflows, allowing for timely adjustments in financial planning. Utilizing this report assists in improving cash management, forecasting accuracy, and overall financial stability.
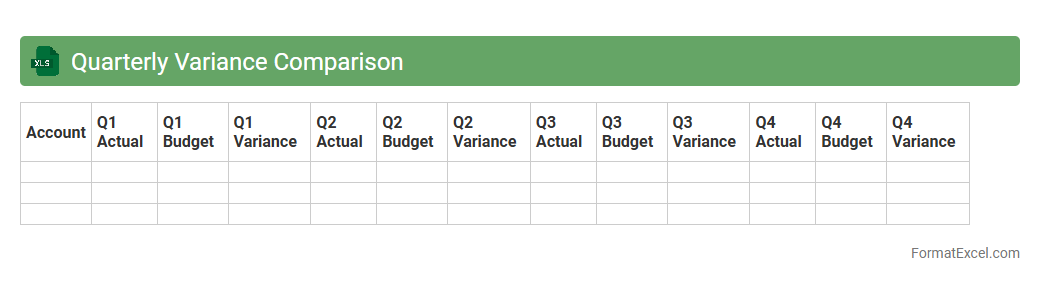
Quarterly Variance Comparison
The
Quarterly Variance Comparison Excel document tracks deviations between projected and actual financial or operational metrics across consecutive quarters. It enables businesses to analyze performance trends, identify areas of concern, and make data-driven decisions to optimize future outcomes. Using this tool improves budget accuracy and enhances strategic planning through clear, quantifiable insights.
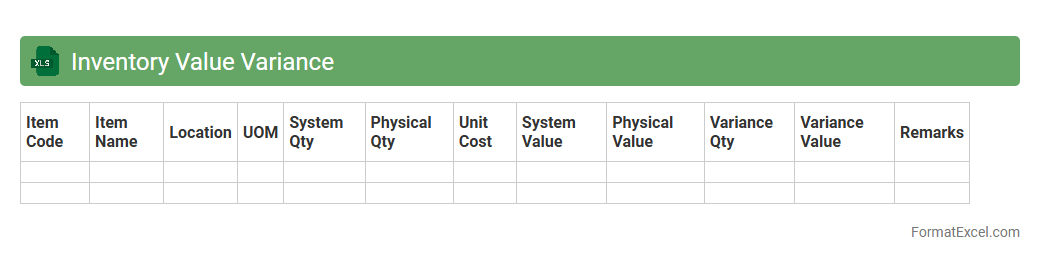
Inventory Value Variance
The
Inventory Value Variance Excel document tracks differences between recorded inventory costs and actual physical inventory values, enabling precise financial control and loss prevention. It helps identify discrepancies due to errors, theft, or damage, facilitating timely corrective actions and improving inventory management accuracy. Utilizing this document supports better budgeting, cost analysis, and strategic decision-making for maintaining optimal stock levels.
Introduction to Variance Analysis in Excel
Variance analysis in Excel is a powerful tool used to compare actual financial performance against budgeted or forecasted figures. It helps identify discrepancies and understand the causes of differences. Mastering variance analysis enables businesses to make data-driven decisions.
Importance of Variance Analysis for Businesses
Variance analysis is crucial for monitoring business performance and controlling costs effectively. It highlights areas where businesses exceed or fall short of expectations, allowing timely management actions. Understanding financial variances improves strategic planning and resource allocation.
Key Components of a Variance Analysis Format
A standard variance analysis format includes budgeted amounts, actual amounts, variance values, and percentage variances. It also categorizes variances as favorable or unfavorable for quick assessment. These components form the backbone of a comprehensive variance report.
Step-by-Step Guide to Setting Up the Excel Template
Start by creating columns for budget, actual, and variance figures. Next, use formulas to calculate differences and percentage variances. Applying formatting and conditional highlighting enhances the Excel variance template readability.
Common Formulas Used in Variance Analysis
Key Excel formulas include simple subtraction for variance (Actual - Budget) and percentage variance calculation ((Variance / Budget) * 100). Additional functions like SUM and IF help aggregate and analyze data effectively. Mastery of these variance formulas ensures accurate analysis.
Sample Variance Analysis Format in Excel
A sample format typically lists budgeted amounts, actual amounts, variance in dollars, and variance in percent side by side. Use tables to organize data neatly with headers and totals. This sample sheet guides efficient data interpretation.
Visualizing Variances with Excel Charts
Charts like bar graphs and line charts visualize variances clearly for better comprehension. Conditional formatting can be combined with charts for quick insights. Effective use of Excel charts enhances variance reporting impact.
Tips for Accurate Data Entry and Analysis
Ensure data consistency by double-checking source figures before inputting into Excel. Use data validation tools to prevent errors during entry. Accurate data input is essential for trustworthy variance analysis results.
Automating Variance Calculations with Excel Functions
Excel functions like IFERROR, SUMIF, and VLOOKUP can automate variance calculations and error handling. Automation reduces manual efforts and minimizes errors. Leveraging Excel automation boosts efficiency in variance tracking.
Best Practices for Presenting Variance Analysis Results
Present variance analysis clearly with summarized key findings and visual aids. Highlight significant variances and explain reasons behind them. Adhering to clear presentation standards makes the analysis actionable and insightful.