Cash Flow Statement
A
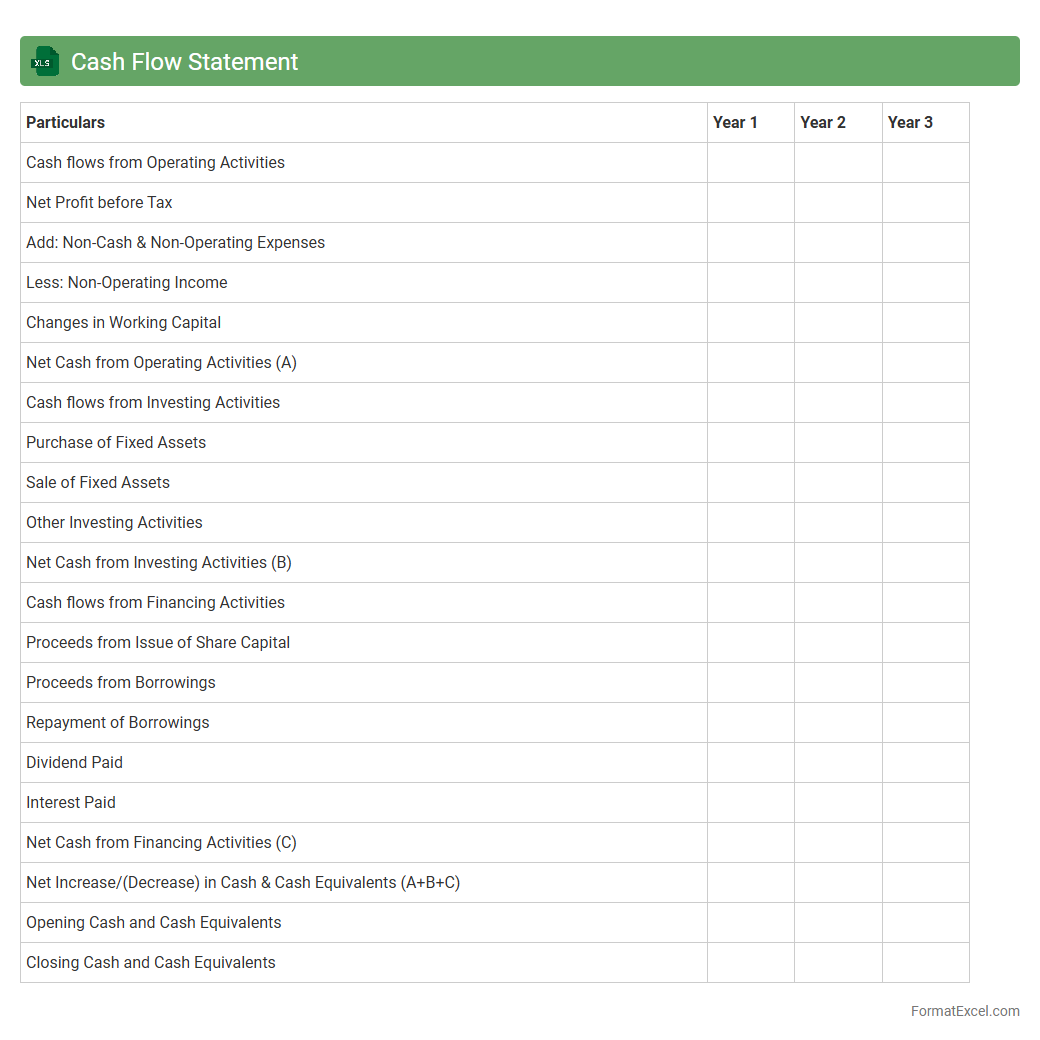
Cash Flow Statement Excel document is a financial tool that tracks the inflows and outflows of cash within a business over a specific period, categorizing cash activities into operating, investing, and financing sections. It helps analyze liquidity, ensuring that a company has enough cash to meet its obligations and make informed financial decisions. Using Excel for this purpose allows for easy customization, data visualization, and real-time updates, enhancing the accuracy and efficiency of cash management.
Cash Flow Forecast
A
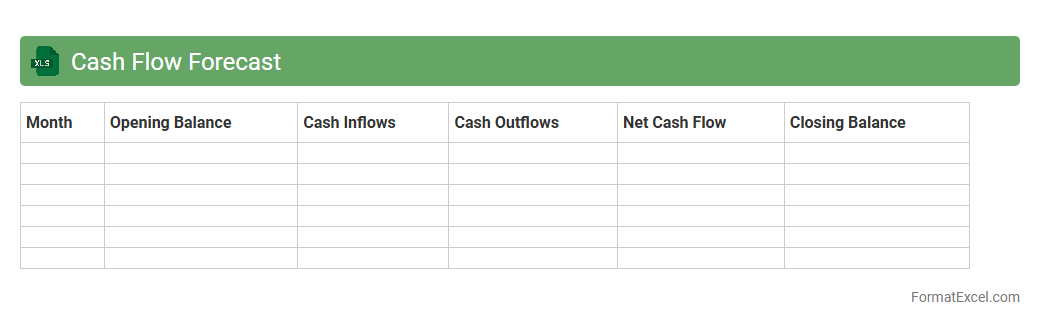
Cash Flow Forecast Excel document is a financial tool that projects the inflows and outflows of cash over a specific period, helping businesses anticipate liquidity needs and manage expenses effectively. It allows the identification of potential cash shortages or surpluses, enabling proactive decision-making to maintain solvency and optimize operational planning. By providing a clear visualization of expected cash movement, this forecast supports budgeting accuracy, investor communication, and strategic financial management.
Operating Cash Flow
An
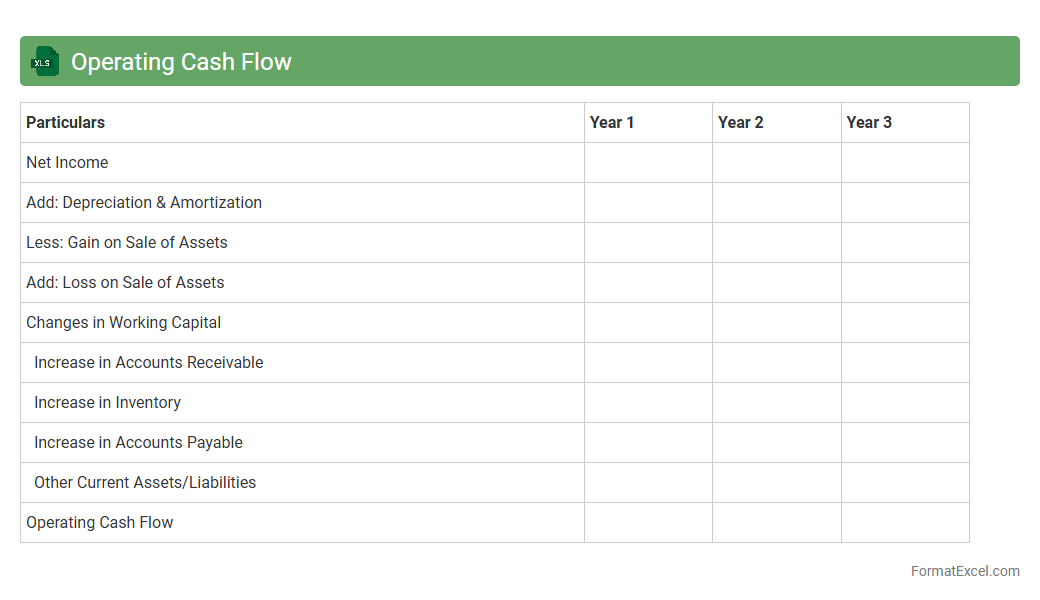
Operating Cash Flow Excel document is a financial tool designed to track and analyze the cash generated from a company's core business operations. It helps users assess the company's liquidity, operational efficiency, and ability to generate cash to meet short-term obligations. This document is invaluable for investors, managers, and analysts who need precise and organized data to make informed financial decisions.
Investing Cash Flow
An
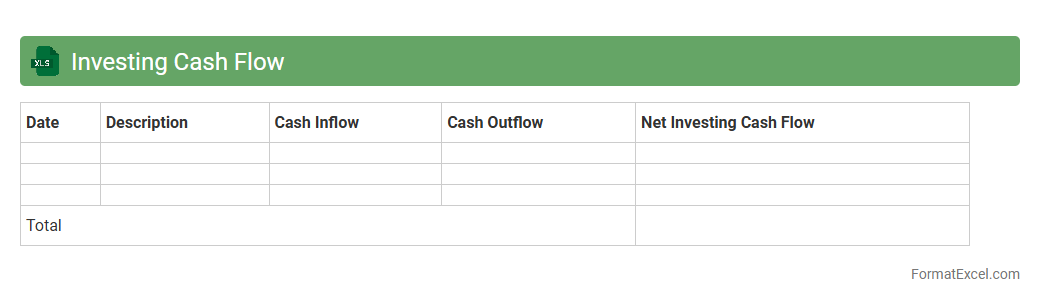
Investing Cash Flow Excel document tracks cash transactions related to a company's investment activities, such as purchases or sales of property, equipment, or securities. It helps users analyze how much cash is being used for investments, providing insights into a company's growth strategy and financial health. This tool is essential for investors, financial analysts, and business managers to make informed decisions based on cash flow trends and investment returns.
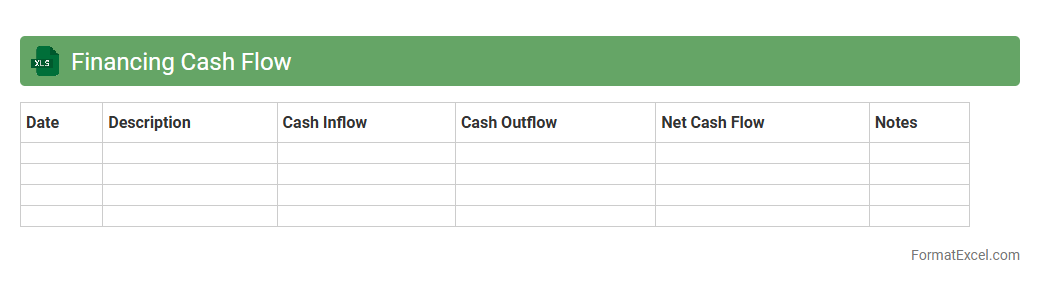
Financing Cash Flow
A
Financing Cash Flow Excel document is a financial tool designed to track and analyze cash inflows and outflows related to financing activities such as loans, equity issuance, and dividends. It helps businesses and investors understand how a company raises capital and manages debt, providing insight into its financial health and strategy. This document is essential for making informed decisions about budgeting, investment, and risk management by clearly presenting financing cash flow trends and projections.
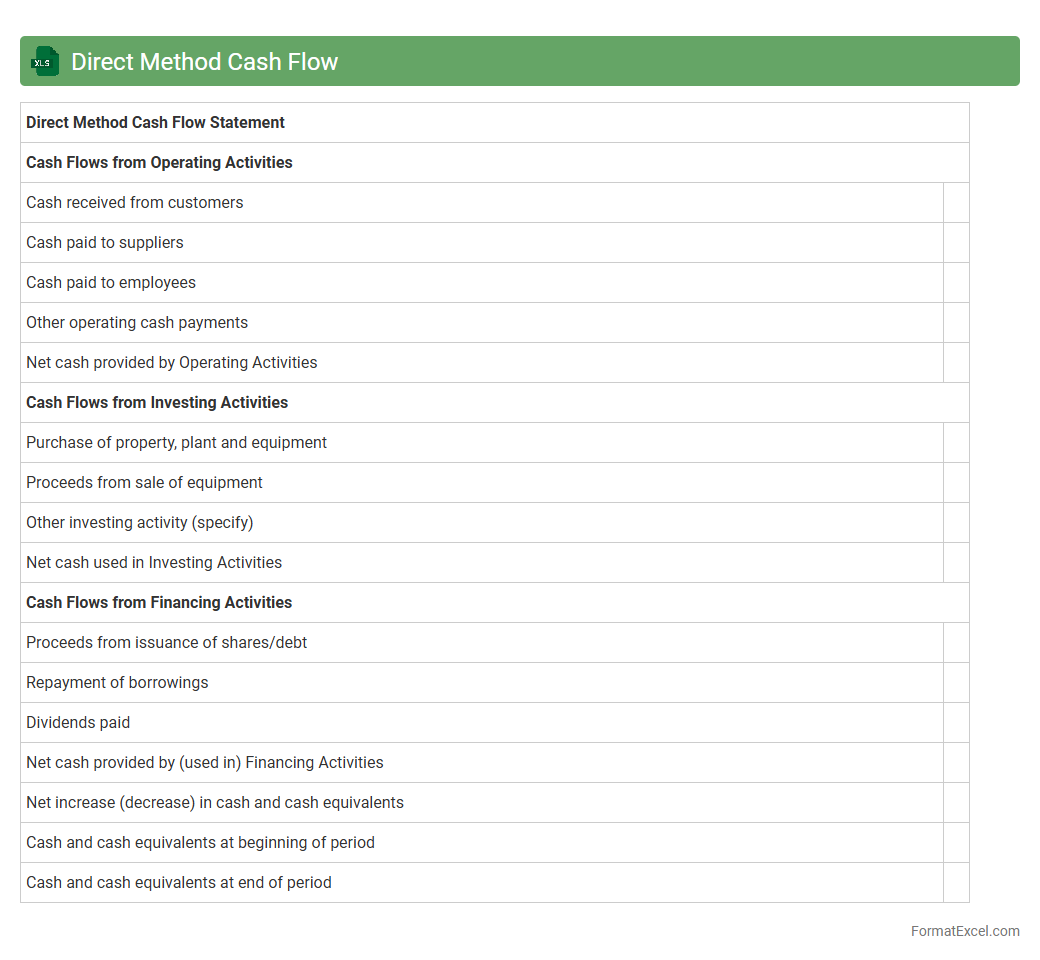
Direct Method Cash Flow
The
Direct Method Cash Flow Excel document provides a detailed breakdown of cash inflows and outflows from operating activities, presenting actual cash transactions such as receipts from customers and payments to suppliers. This method enhances clarity by showing precise cash movements, making it easier to assess a company's liquidity and operational efficiency. It is useful for financial analysts and managers seeking accurate cash tracking for budgeting, forecasting, and decision-making purposes.
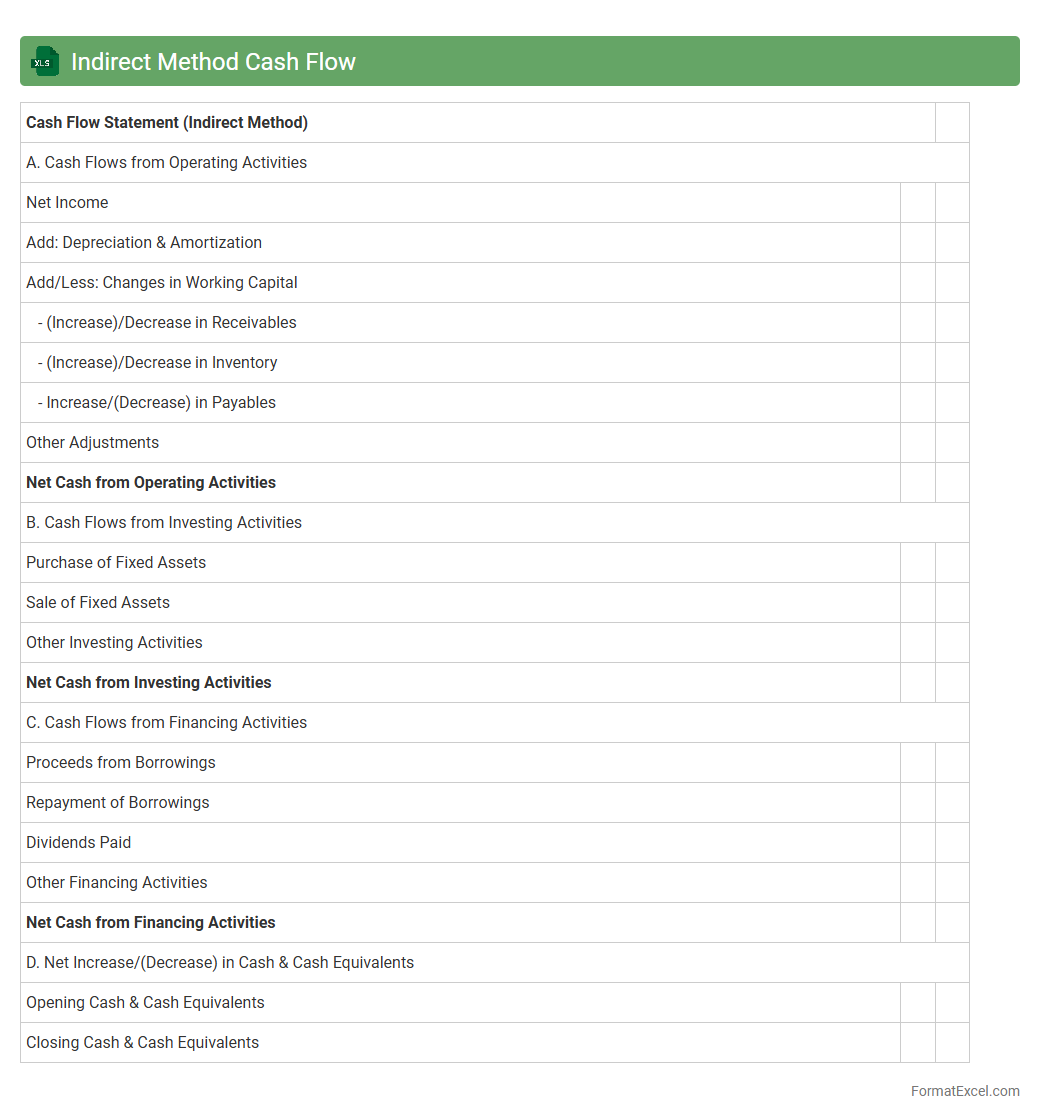
Indirect Method Cash Flow
The
Indirect Method Cash Flow Excel document is a financial tool that helps reconcile net income to net cash flow from operating activities by adjusting for non-cash transactions and changes in working capital. It simplifies the analysis of cash flow by converting accrual-based accounting data into cash-based figures, providing clearer insight into a company's liquidity and cash management. This document is useful for stakeholders to assess operational efficiency and make informed financial decisions.
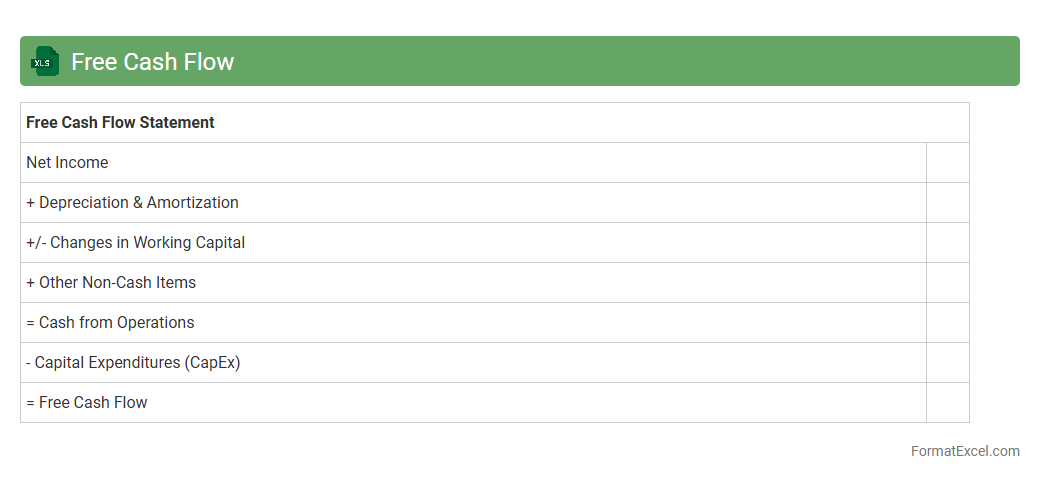
Free Cash Flow
A
Free Cash Flow Excel document is a spreadsheet tool designed to calculate and analyze the cash generated by a business after deducting capital expenditures from operating cash flow. It helps investors and financial analysts assess a company's financial health, liquidity, and ability to generate cash for dividends, debt repayment, or growth. By providing clear insights into a company's cash flow status, this document supports better decision-making and strategic planning.
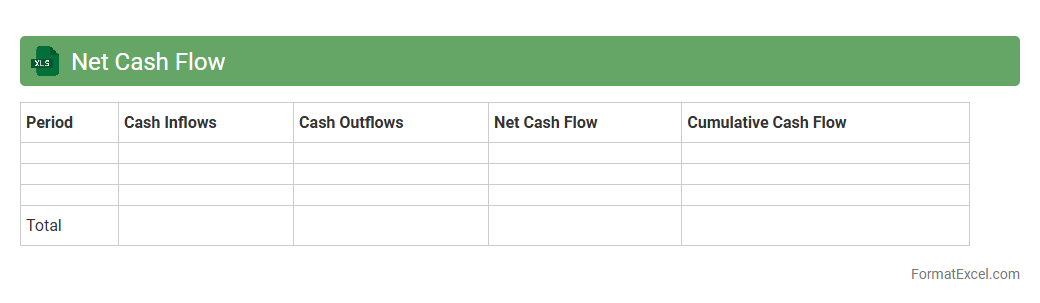
Net Cash Flow
A
Net Cash Flow Excel document is a financial tool used to track and analyze the inflows and outflows of cash within a specific period, helping businesses monitor liquidity. It organizes data on revenue, expenses, and investments to provide a clear picture of the company's financial health, allowing for better budgeting and forecasting. By using this document, users can identify cash shortages or surpluses, enabling informed decision-making to optimize financial performance.
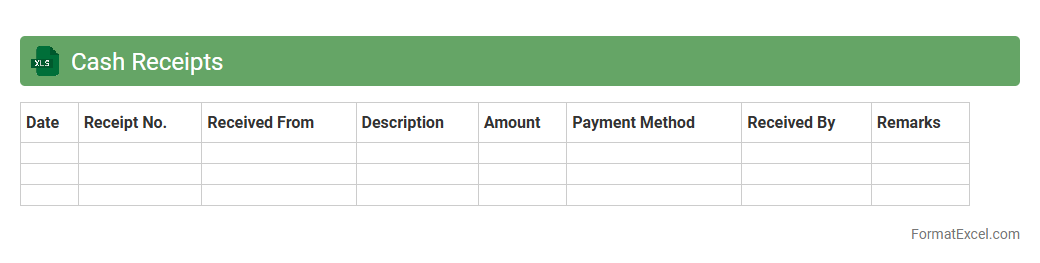
Cash Receipts
A
Cash Receipts Excel document is a financial tool used to record and track all cash inflows within a business or organization, ensuring accurate accounting and cash management. It helps in monitoring daily cash transactions, reconciling accounts, and maintaining transparent financial records for audits and reporting. By organizing data in a structured spreadsheet format, it facilitates better cash flow analysis and decision-making.
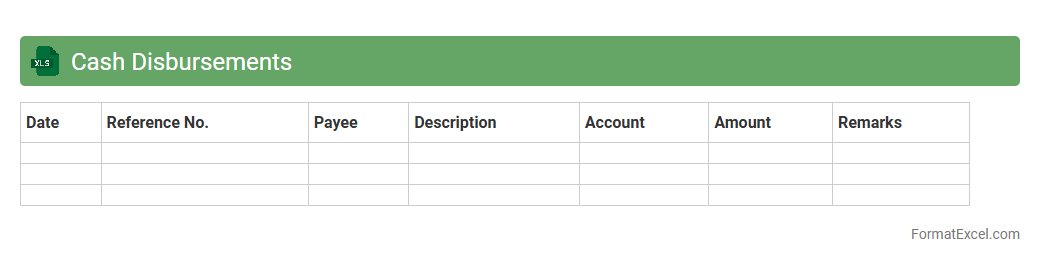
Cash Disbursements
A
Cash Disbursements Excel document is a tool used to record and track all outgoing payments made by a business, including expenses, vendor payments, and other financial transactions. This document helps maintain accurate financial records, monitor cash flow, and ensure timely payments, which are crucial for budgeting and financial analysis. Using Excel's features like formulas and pivot tables enhances data organization and provides valuable insights into spending patterns.
Cash Flow from Customers
A
Cash Flow from Customers Excel document tracks all incoming cash payments from clients, providing a detailed overview of revenue inflows over time. It helps businesses monitor liquidity, forecast future cash positions, and identify trends in customer payment behavior. This tool is essential for improving cash management, ensuring timely access to funds, and supporting informed financial decision-making.
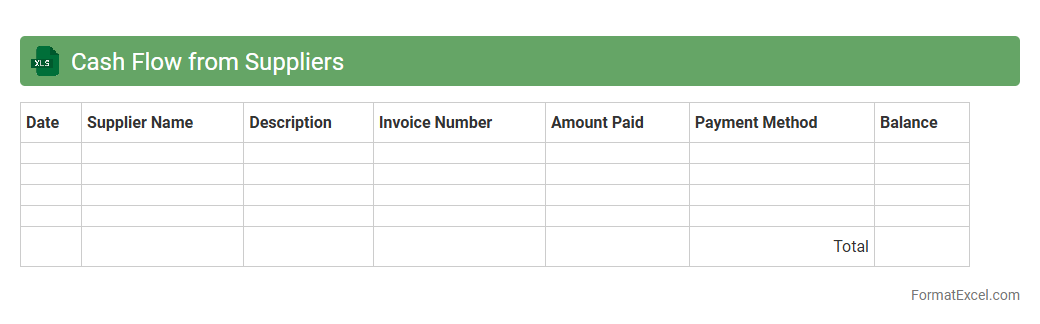
Cash Flow from Suppliers
Cash Flow from Suppliers Excel document tracks all incoming payments and credit terms from suppliers, providing a clear overview of cash outflows related to procurement activities. This
financial tool helps businesses manage working capital effectively, ensuring timely payments and optimizing supplier relationships. By analyzing this data, companies can improve budgeting accuracy and maintain a healthy cash flow cycle.
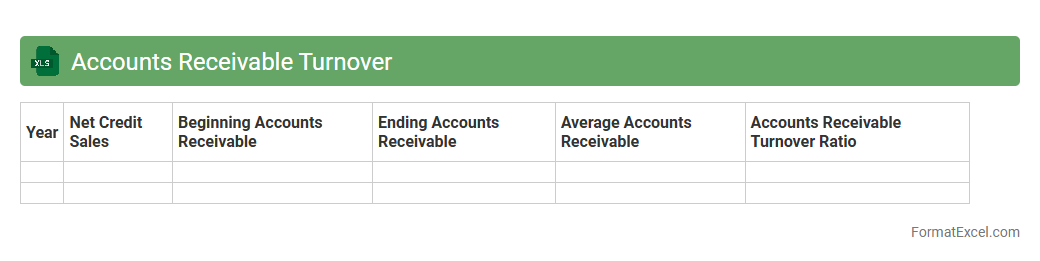
Accounts Receivable Turnover
An
Accounts Receivable Turnover Excel document calculates how efficiently a company collects its outstanding credit sales by measuring the number of times receivables are converted into cash during a period. It is useful for monitoring cash flow health, identifying collection issues, and optimizing credit policies to improve financial stability. This Excel tool streamlines data input and provides clear visualizations for faster decision-making and accurate financial analysis.
Accounts Payable Turnover
An
Accounts Payable Turnover Excel document is a financial tool used to calculate the frequency at which a company pays off its suppliers within a given period, typically a year. This document helps businesses track their payment efficiency by analyzing the ratio of purchases to average accounts payable, providing insights into cash flow management and supplier relationship health. Utilizing this Excel tool enables organizations to optimize their working capital and ensure timely payments, which can lead to improved credit terms and stronger vendor partnerships.
Working Capital Changes
A
Working Capital Changes Excel document tracks variations in current assets and liabilities over time, providing clear insights into a company's short-term financial health. It helps identify fluctuations in cash flow, accounts receivable, accounts payable, and inventory levels, enabling better cash management and operational planning. By analyzing these changes, businesses can optimize liquidity, avoid funding gaps, and enhance decision-making for growth and stability.
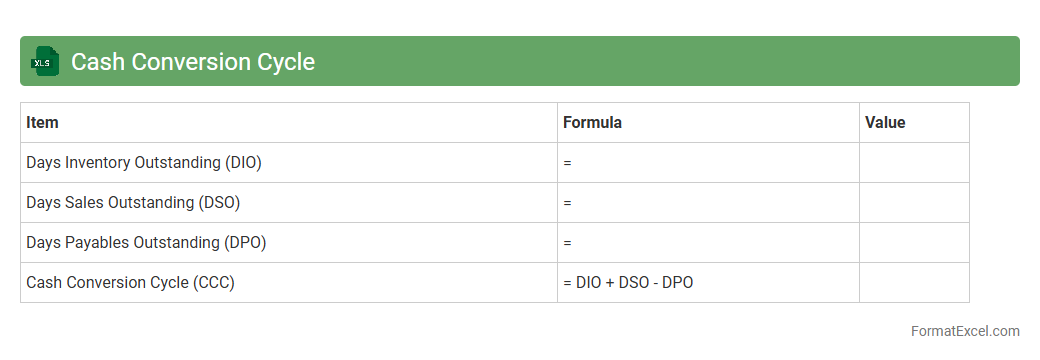
Cash Conversion Cycle
The
Cash Conversion Cycle (CCC) Excel document is a financial tool designed to measure the time taken by a company to convert its investments in inventory and other resources into cash flows from sales. It helps businesses analyze operational efficiency by tracking days inventory outstanding, days sales outstanding, and days payable outstanding in a structured, easy-to-use spreadsheet format. Utilizing this document facilitates better cash flow management, enabling companies to optimize working capital and improve liquidity.
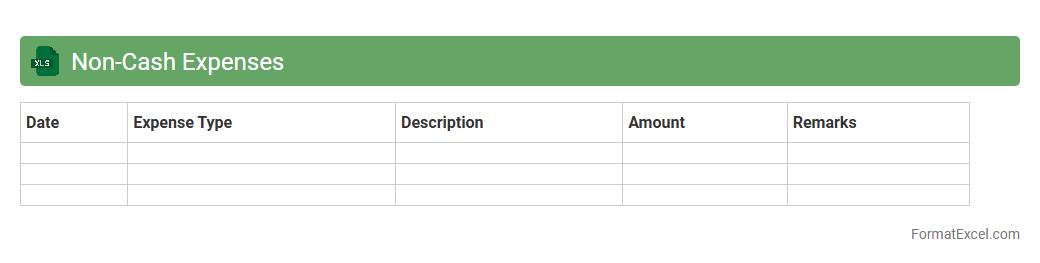
Non-Cash Expenses
A
Non-Cash Expenses Excel document is a financial tool designed to track and analyze expenses that do not involve direct cash payments, such as depreciation, amortization, and stock-based compensation. It helps businesses accurately reflect these expenses on financial statements, ensuring more precise profit and loss reporting without impacting cash flow. Utilizing this document enables better budgeting, forecasting, and financial decision-making by providing clear visibility into non-cash impacts on overall financial health.
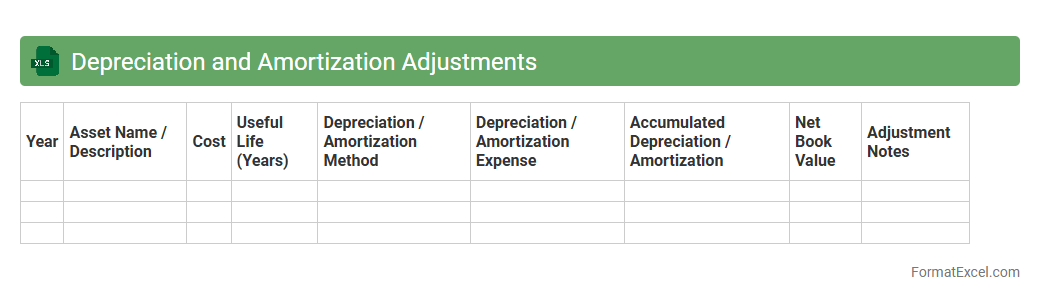
Depreciation and Amortization Adjustments
A
Depreciation and Amortization Adjustments Excel document provides a detailed framework for tracking and recalculating the depreciation of tangible assets and amortization of intangible assets over time. It helps businesses accurately allocate expenses to the correct accounting periods, improving financial reporting and tax compliance. Utilizing this document enhances asset management efficiency and supports informed decision-making regarding capital investments.
Unlevered Cash Flow
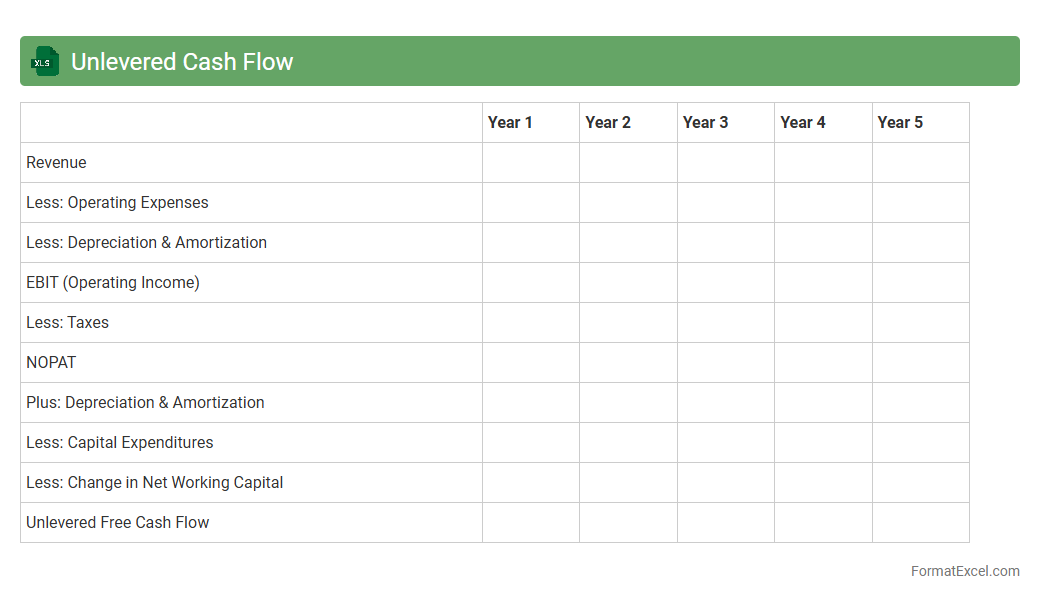
An
Unlevered Cash Flow Excel document is a financial model that calculates the cash generated by a business before accounting for debt payments, presenting a clear view of operating performance. This tool helps investors and analysts evaluate a company's value and profitability independent of its capital structure, aiding in more accurate valuation and investment decisions. It streamlines scenario analysis and forecasting, making it essential for strategic financial planning and mergers and acquisitions.
Levered Cash Flow
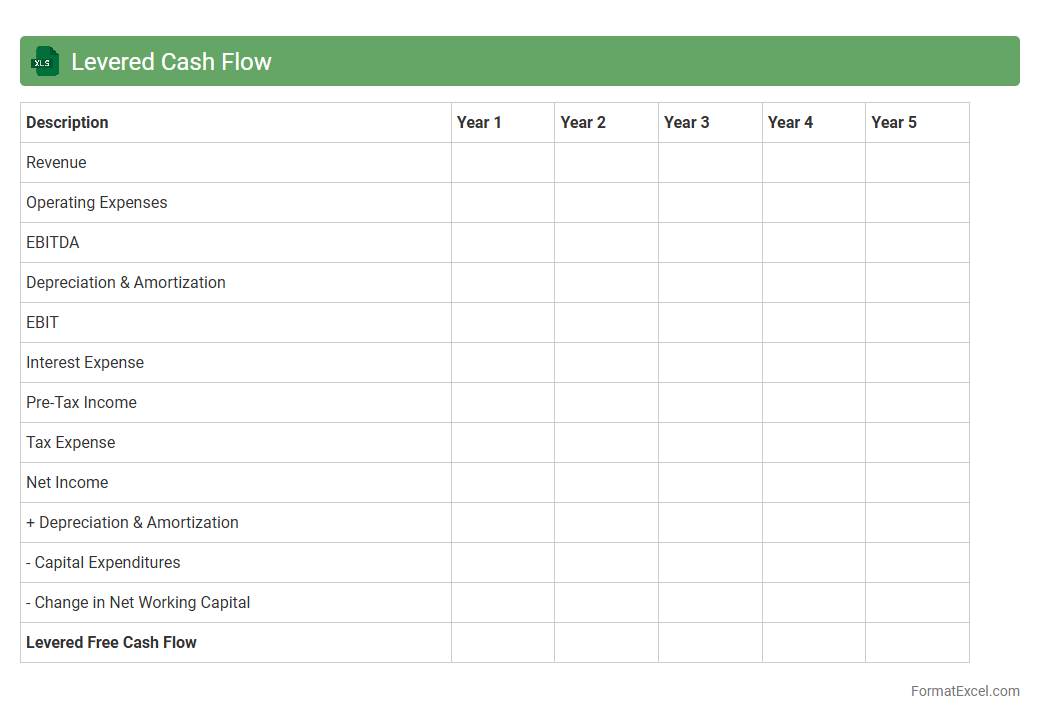
A
Levered Cash Flow Excel document calculates the net cash flow available to equity shareholders after meeting all financial obligations, including debt payments. It is useful for investors and financial analysts to assess a company's ability to generate cash for debt servicing and equity dividends. This tool aids in making informed decisions about investment risk, company valuation, and capital structure management.
EBITDA vs Operating Cash Flow
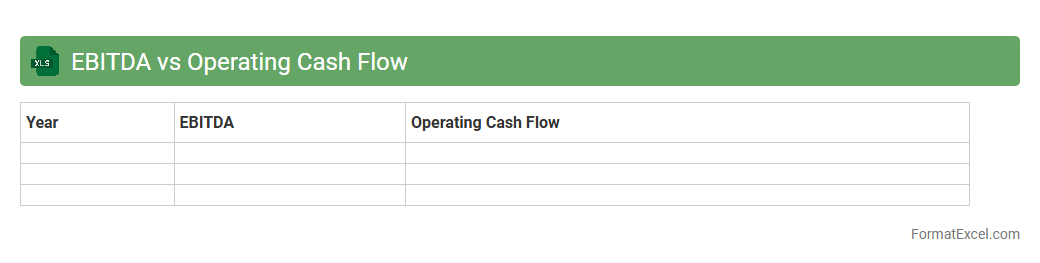
An
EBITDA vs Operating Cash Flow Excel document compares a company's earnings before interest, taxes, depreciation, and amortization (EBITDA) with its operating cash flow to evaluate financial performance and liquidity. This analysis highlights differences between accounting profits and actual cash generated, helping identify potential cash flow issues or strengths. Excel's functions and visualizations facilitate dynamic data interpretation, supporting better decision-making in budgeting, forecasting, and financial analysis.
Cash Flow Variance Analysis
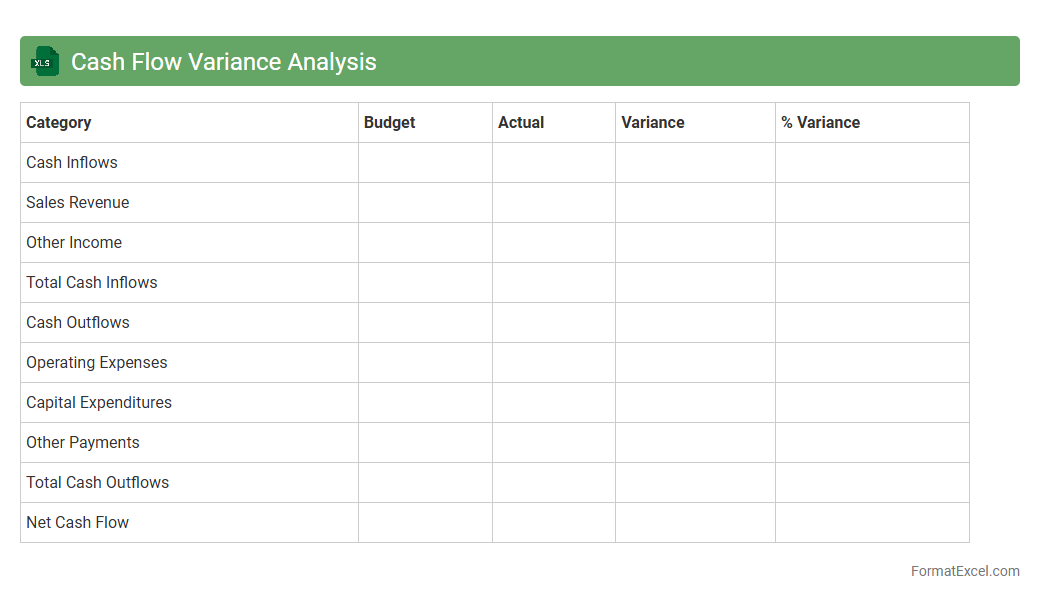
Cash Flow Variance Analysis in an Excel document allows businesses to systematically compare actual cash flows against budgeted amounts, identifying discrepancies and trends. This tool helps improve financial planning by highlighting
cash flow variances, enabling timely adjustments to ensure liquidity and operational efficiency. By leveraging detailed variance reports, organizations can optimize their cash management strategies and make informed decisions.
Monthly Cash Flow Tracking
A
Monthly Cash Flow Tracking Excel document systematically records income and expenses, providing clear visibility into financial inflows and outflows each month. It helps identify spending patterns, optimize budgeting, and ensure sufficient liquidity to meet obligations. By analyzing monthly cash flow, individuals and businesses can make informed financial decisions and improve overall fiscal health.
Projected Cash Shortfall Analysis
A
Projected Cash Shortfall Analysis Excel document calculates future periods when a business may face insufficient cash flow to meet its obligations, based on forecasted revenues, expenses, and cash balances. It helps identify timing and magnitude of potential cash deficits, enabling proactive planning such as securing short-term financing or adjusting spending. This tool enhances financial decision-making by providing clear insights into cash flow risks and supporting effective working capital management.
Introduction to Cash Flow Analysis
Cash flow analysis examines the inflows and outflows of cash within a business over a specific period. This process helps determine a company's liquidity and operational efficiency. Understanding cash flow is crucial for effective financial management and planning.
Importance of Cash Flow Analysis
Managing cash flow ensures a business can meet its obligations and avoid insolvency. Proper cash flow analysis highlights potential financial bottlenecks before they become critical. It enables better investment decisions and supports sustainable growth.
Key Components of a Cash Flow Statement
A cash flow statement includes operating, investing, and financing activities. Each section categorizes cash inflows and outflows to provide a comprehensive financial overview. Identifying these components clearly improves the accuracy of your analysis.
Setting Up Your Excel Spreadsheet
Organize your cash flow data in structured columns and rows for clarity. Label sections such as dates, descriptions, cash inflows, and outflows for effective tracking. Using Excel's table feature can enhance data management and readability.
Sample Cash Flow Analysis Format in Excel
A standard format lists opening balances, cash receipts, payments, and closing balances sequentially. This format aids in visualizing how cash moves through the business over time. Incorporating totals and subtotals in your Excel sheet improves transparency.
Step-by-Step Guide to Inputting Data
Begin by entering opening cash balances and categorizing cash transactions. Input cash inflows as positive values and outflows as negatives for clear distinction. Keep the data consistent and regularly updated for precision.
Using Excel Formulas for Cash Flow Calculations
Excel formulas like SUM and IF are essential for totaling and conditionally analyzing cash flows. Using SUM to calculate net cash flow simplifies accurate aggregation. Conditional formulas help identify negative cash trends that require attention.
Tips for Visualizing Cash Flow Data in Excel
Leverage charts such as line graphs and bar charts to represent cash flow trends visually. Using conditional formatting will highlight critical values, aiding quick analysis. Visual tools make complex data easier to interpret and act upon.
Common Mistakes in Cash Flow Analysis
Inaccurate data entry and ignoring timing differences between cash and accrual accounting can distort analysis. Neglecting non-operating cash flows also leads to incomplete insights. Avoiding these pitfalls ensures reliable and actionable cash flow reports.
Downloadable Cash Flow Analysis Excel Templates
Using pre-designed templates saves time and guides proper data entry structure. Look for templates that include automated formulas and visualization options for efficiency. These downloadable templates are valuable tools for both beginners and professionals.