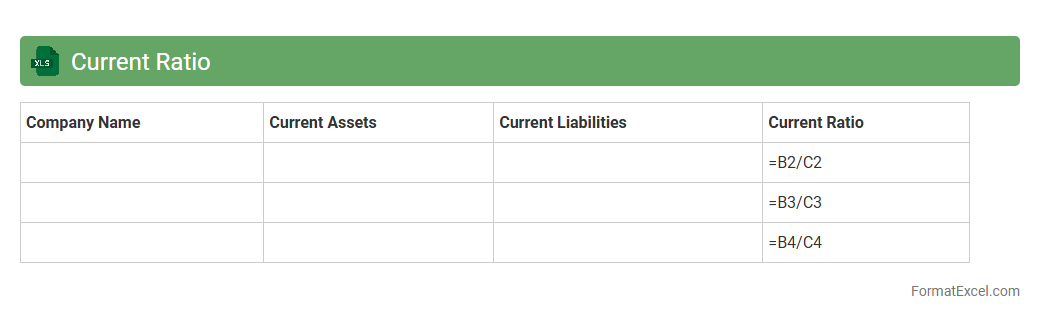
Current Ratio
The
Current Ratio Excel document is a financial tool designed to calculate and analyze a company's liquidity by comparing current assets to current liabilities. It helps businesses and investors assess the capacity to cover short-term obligations, ensuring financial stability and operational efficiency. Utilizing this document enables accurate monitoring and decision-making based on real-time financial data.
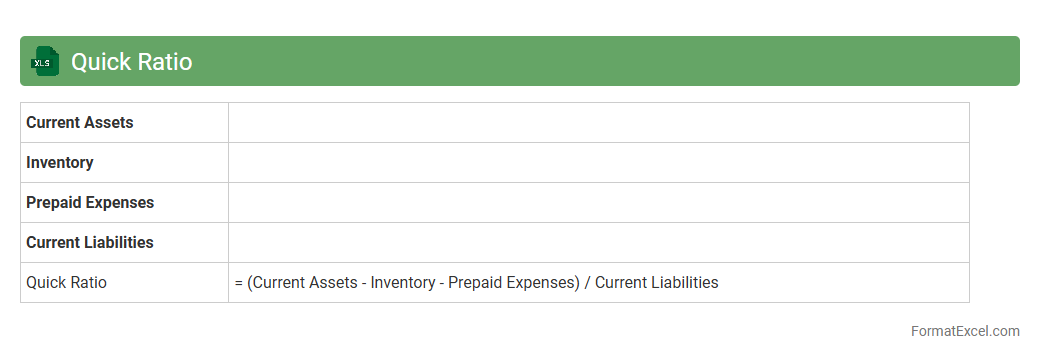
Quick Ratio
The
Quick Ratio Excel document is a financial tool designed to calculate a company's liquidity by measuring its ability to cover short-term liabilities with its most liquid assets. It efficiently helps businesses assess their financial health by excluding inventory from current assets, providing a clearer picture of immediate solvency. Utilizing this document enables users to make informed decisions regarding cash flow management and short-term financial stability.
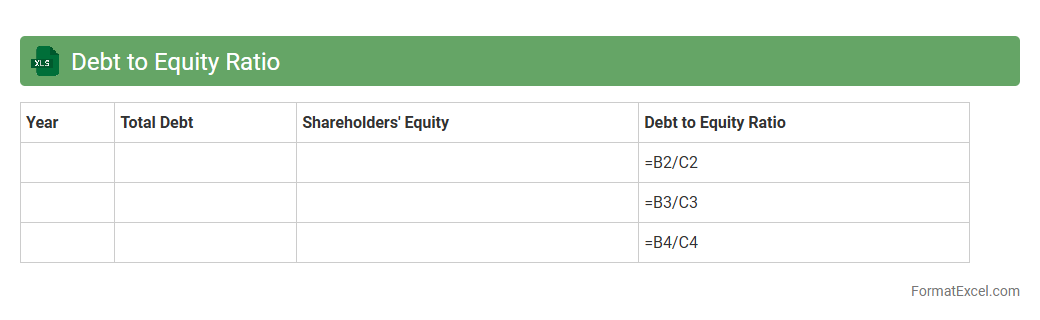
Debt to Equity Ratio
A
Debt to Equity Ratio Excel document is a structured spreadsheet tool designed to calculate and analyze the financial leverage of a business by comparing its total liabilities to shareholders' equity. This ratio helps investors and managers assess the risk level and financial stability of the company, indicating how much debt is used to finance assets relative to equity. Using this Excel document streamlines data input, simplifies complex calculations, and provides clear visualizations for informed decision-making and financial planning.
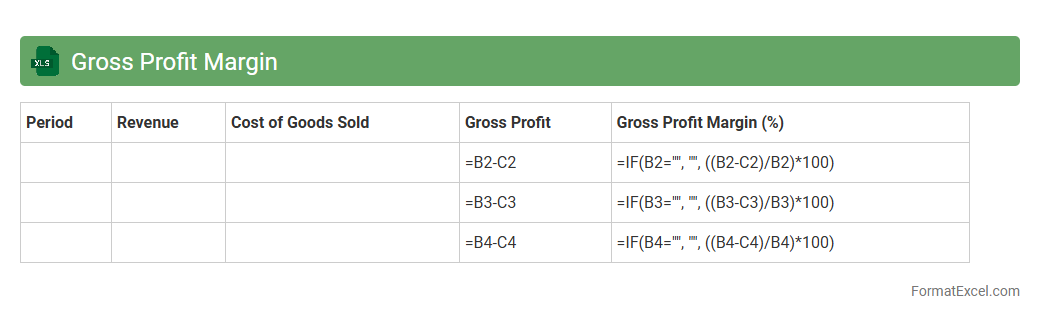
Gross Profit Margin
A
Gross Profit Margin Excel document is a financial tool that calculates the percentage of revenue remaining after subtracting the cost of goods sold (COGS) from total sales, helping businesses assess profitability. It provides clear visualizations and formulas to track profitability trends over time, enabling better decision-making in pricing and cost control. This document is useful for identifying areas to improve operational efficiency and enhancing overall financial performance.
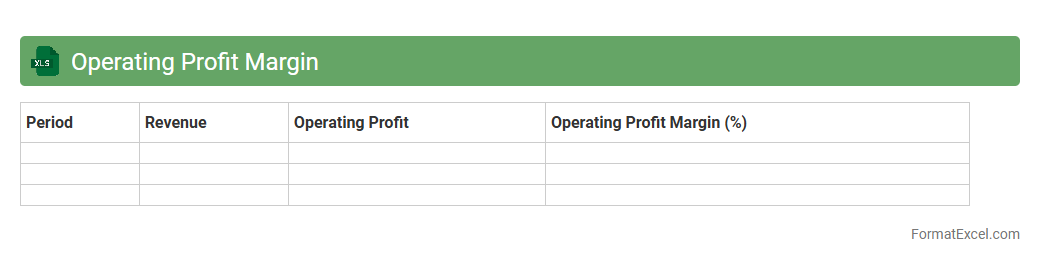
Operating Profit Margin
An
Operating Profit Margin Excel document calculates the percentage of profit a company makes from its core business operations, excluding costs like taxes and interest. It helps users analyze financial efficiency by comparing operating income to net sales, enabling informed decisions on cost management and profitability. This tool is essential for investors, managers, and analysts to monitor business performance and identify areas for improvement.
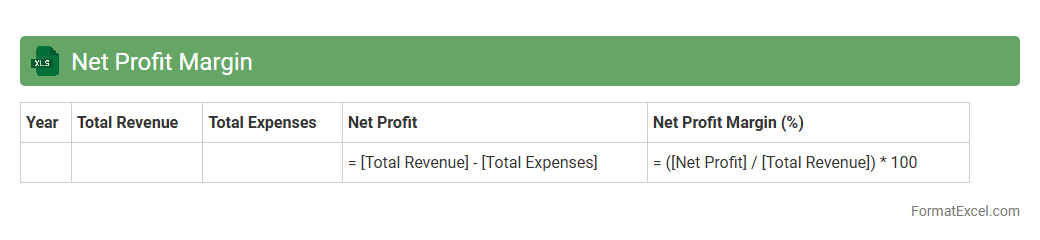
Net Profit Margin
The
Net Profit Margin Excel document is a financial tool that calculates the ratio of net profit to total revenue, providing a clear measure of a company's profitability. It helps businesses analyze operational efficiency, cost management, and overall financial health by offering visualized data and customizable formulas. Using this document enables informed decision-making, improves budgeting strategies, and tracks profit performance over time.
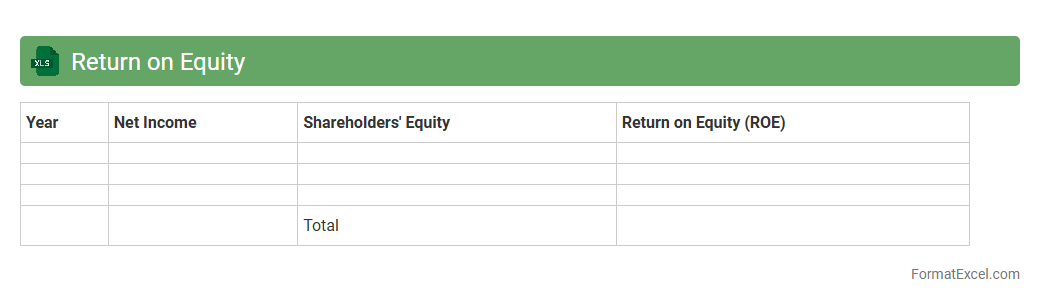
Return on Equity
A
Return on Equity (ROE) Excel document is a financial tool used to calculate and analyze the profitability of a company relative to shareholders' equity. This document helps investors and managers assess the efficiency of equity capital by tracking net income against shareholder investment, enabling data-driven decisions. It provides a clear, organized format for monitoring performance trends, forecasting future returns, and making strategic investment choices.
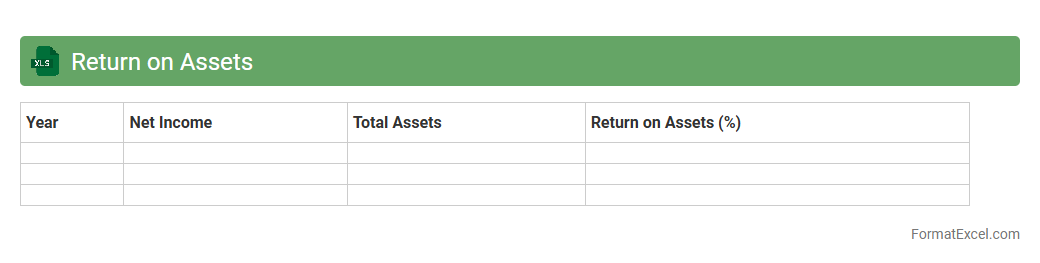
Return on Assets
A
Return on Assets (ROA) Excel document calculates the profitability of a company relative to its total assets, providing insights into how efficiently assets generate earnings. This spreadsheet allows users to input financial data such as net income and total assets, automatically computing ROA ratios to track performance trends over time. Businesses and investors leverage this tool to make informed decisions, optimize asset utilization, and benchmark operational efficiency against industry standards.
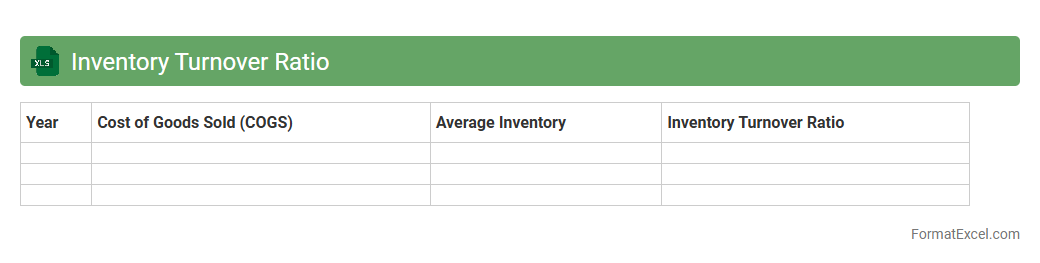
Inventory Turnover Ratio
The
Inventory Turnover Ratio Excel document is a tool designed to calculate and analyze the efficiency of inventory management by measuring how many times inventory is sold and replaced over a specific period. This document helps businesses identify trends in stock movement, optimize inventory levels, reduce holding costs, and improve cash flow management. By providing clear insights into turnover rates, it enables data-driven decisions to enhance supply chain operations and profitability.
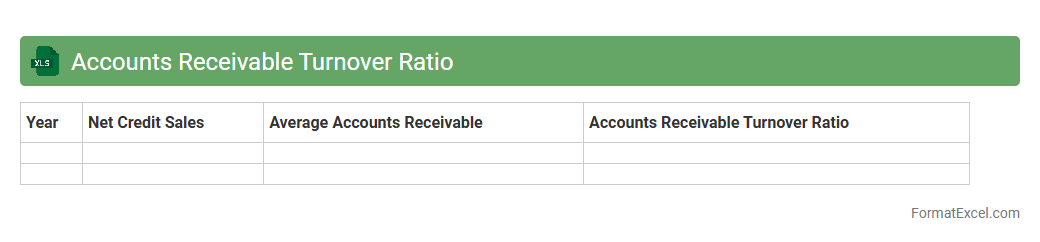
Accounts Receivable Turnover Ratio
The
Accounts Receivable Turnover Ratio Excel document calculates how efficiently a company collects its outstanding credit sales within a specific period. This metric helps businesses assess liquidity by measuring the number of times accounts receivable are converted into cash, highlighting potential cash flow issues or credit policy effectiveness. Using this Excel tool enables accurate tracking, quick data analysis, and informed decision-making to improve financial management.
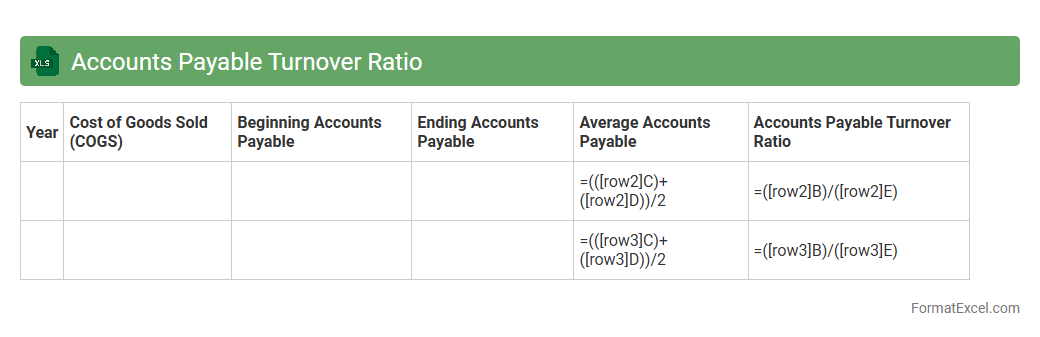
Accounts Payable Turnover Ratio
The
Accounts Payable Turnover Ratio Excel document is a financial tool that calculates how quickly a company pays off its suppliers within a specific period. It helps businesses assess their payment efficiency, manage cash flow, and maintain strong vendor relationships by identifying payment trends and potential liquidity issues. This ratio, when tracked regularly using Excel, allows companies to make informed decisions on optimizing working capital and negotiating better credit terms.
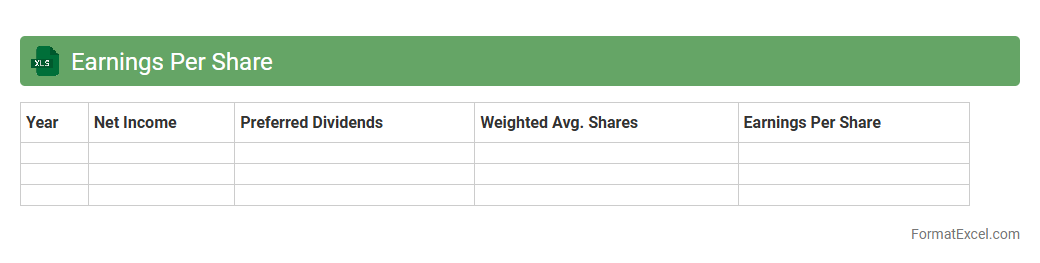
Earnings Per Share
An
Earnings Per Share (EPS) Excel document is a financial tool that tracks and calculates a company's profit allocated to each outstanding share of common stock, facilitating investor analysis. It allows users to input net income and number of shares to automatically compute EPS, providing a clear measure of corporate profitability. This document is essential for investors and analysts to assess company performance and make informed investment decisions.
Interest Coverage Ratio
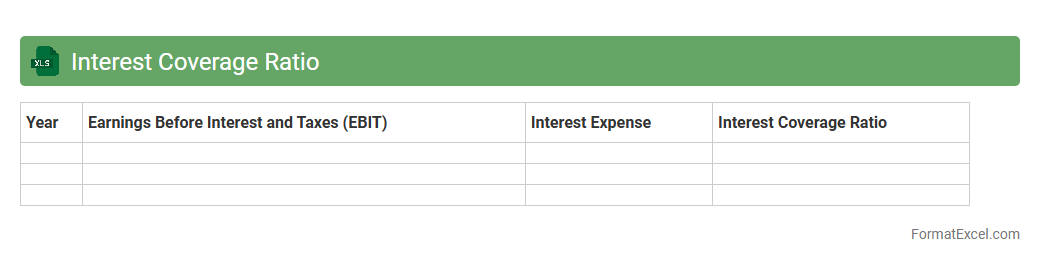
The
Interest Coverage Ratio Excel document calculates a company's ability to pay interest on its outstanding debt by comparing earnings before interest and taxes (EBIT) to interest expenses. This ratio is essential for investors and creditors to assess financial stability and risk before making lending or investment decisions. Using Excel allows for quick updates, scenario analysis, and visualization of trends to ensure accurate financial planning and risk management.
Dividend Payout Ratio
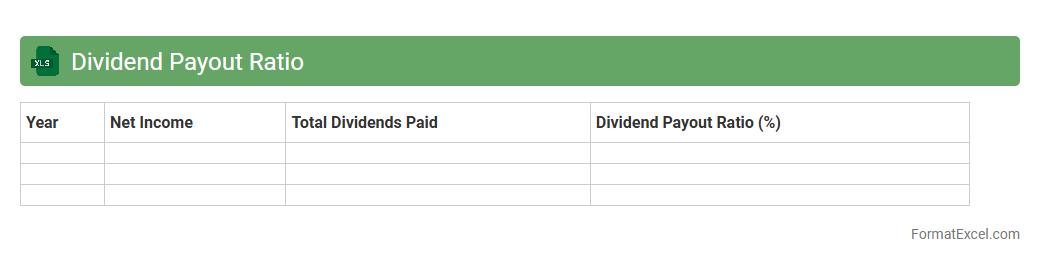
A
Dividend Payout Ratio Excel document is a spreadsheet tool designed to calculate and analyze the proportion of earnings a company distributes to shareholders as dividends. It helps investors assess a company's dividend sustainability and growth potential by comparing dividends paid to net income. This document supports financial planning by providing clear insights into dividend policies, aiding in investment decisions and portfolio management.
Price to Earnings Ratio
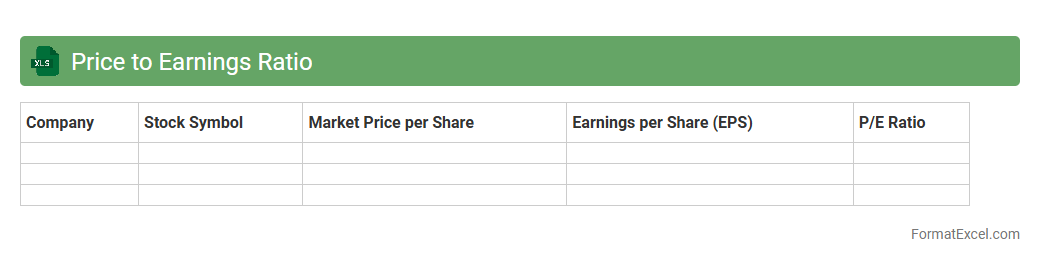
The
Price to Earnings Ratio (P/E Ratio) Excel document is a financial tool that calculates the ratio of a company's current share price to its earnings per share (EPS) using organized data and formulas. This document helps investors and analysts assess whether a stock is overvalued, undervalued, or fairly priced by comparing market price with company profitability. Utilizing the P/E Ratio in Excel streamlines decision-making by providing clear insights into investment value and potential growth opportunities.
Asset Turnover Ratio
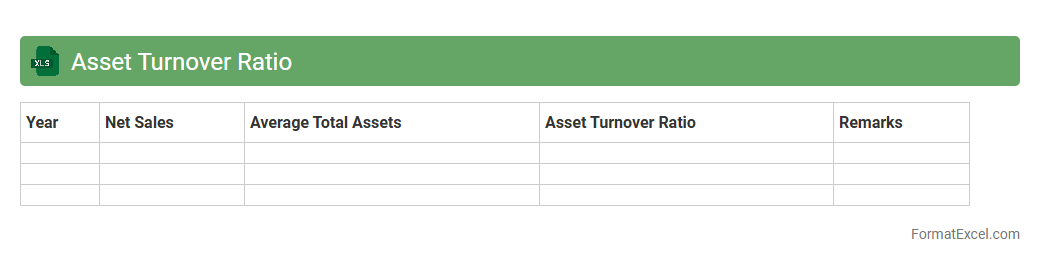
An
Asset Turnover Ratio Excel document is a financial tool designed to calculate and analyze how efficiently a company uses its assets to generate sales revenue. It provides a clear visualization of asset efficiency by leveraging formulas and data sets to compute turnover ratios, enabling businesses to identify trends and make informed decisions. This document is useful for investors, analysts, and managers seeking to optimize asset utilization and improve operational performance.
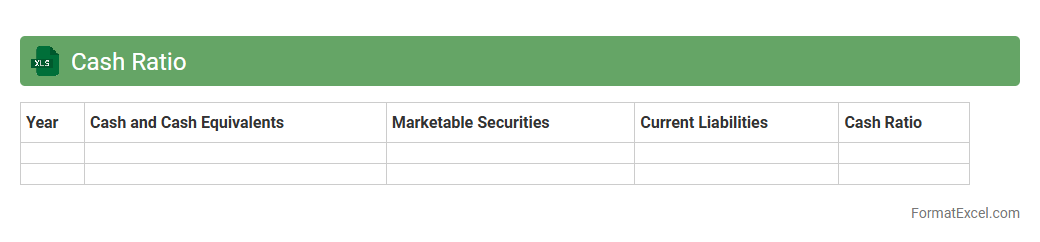
Cash Ratio
A
Cash Ratio Excel document is a financial tool designed to calculate and analyze a company's liquidity by comparing its cash and cash equivalents to its current liabilities. It helps businesses and investors quickly assess the firm's ability to cover short-term obligations without selling inventory or relying on receivables. This document streamlines financial decision-making by providing clear, organized cash flow insights essential for risk management and strategic planning.
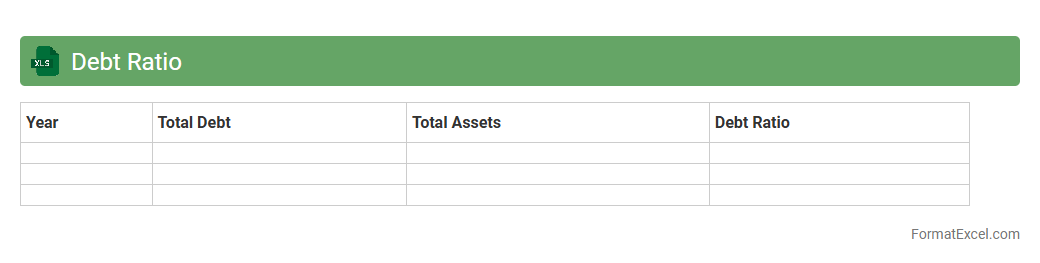
Debt Ratio
A
Debt Ratio Excel document is a financial tool that calculates the ratio of a company's total liabilities to its total assets, providing insight into its leverage and financial stability. This document helps businesses and investors assess the level of debt risk, enabling informed decisions on creditworthiness and investment potential. By organizing data in Excel, users can easily update figures, perform scenario analysis, and visualize trends to monitor financial health over time.
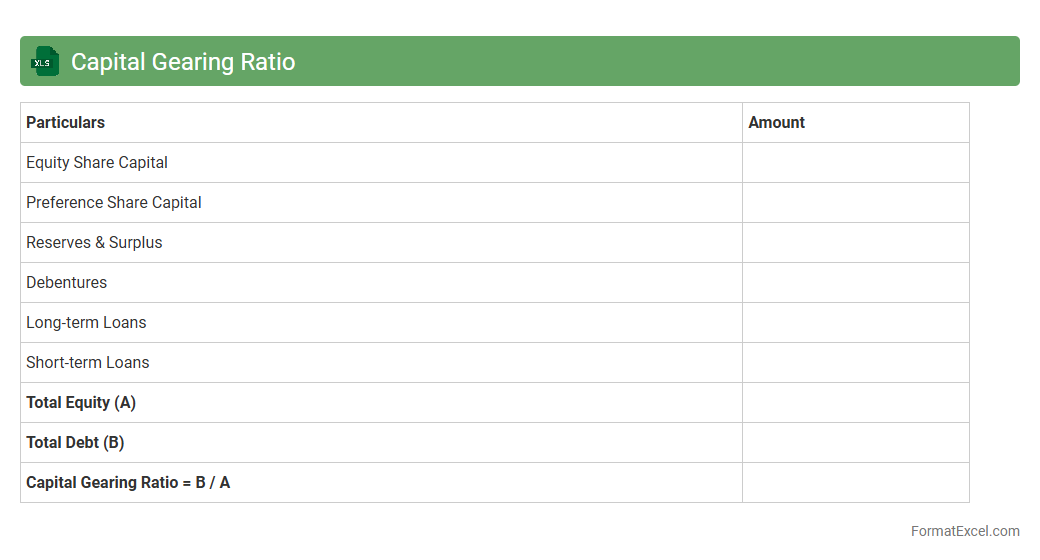
Capital Gearing Ratio
Capital Gearing Ratio Excel document is a financial tool designed to calculate and analyze the proportion of a company's debt to its equity, highlighting the balance between borrowed funds and shareholder investments. This spreadsheet helps businesses assess financial risk by providing clear insights into their leverage, enabling informed decisions on financing and investment strategies. Using the
Capital Gearing Ratio in Excel simplifies complex calculations, offering a practical way to monitor capital structure and ensure sustainable growth.
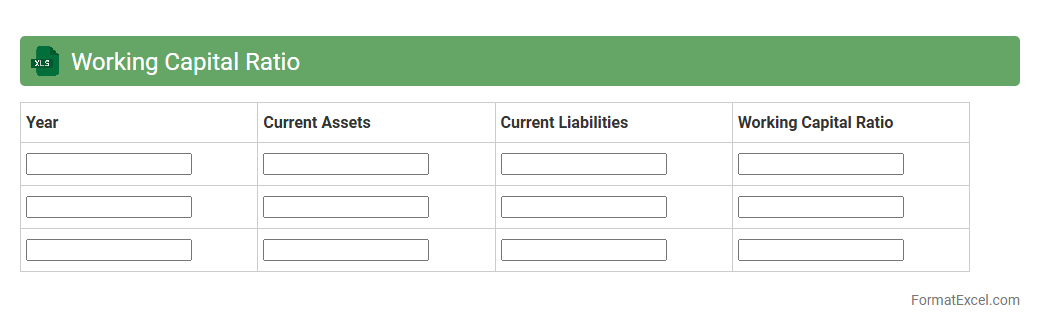
Working Capital Ratio
The
Working Capital Ratio Excel document is a financial tool used to measure a company's short-term liquidity by comparing current assets to current liabilities. It helps businesses evaluate their ability to cover immediate debts and operational expenses, ensuring financial stability. By analyzing this ratio, companies can make informed decisions on cash flow management and optimize their resource allocation.
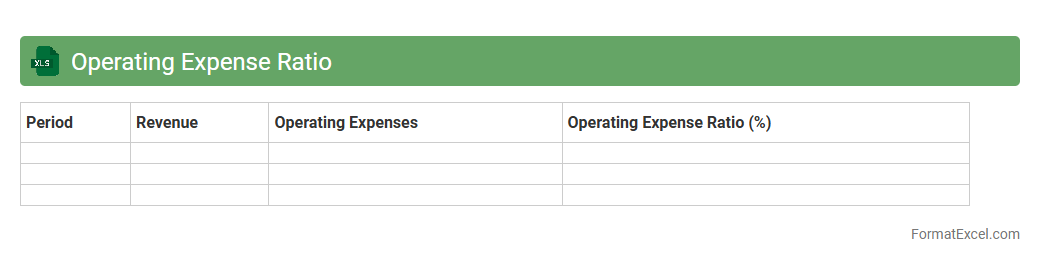
Operating Expense Ratio
An
Operating Expense Ratio (OER) Excel document calculates the proportion of operating expenses to total revenue, providing a clear view of cost efficiency. This tool is essential for businesses to monitor and control expenses, enhancing profitability analysis and budgeting accuracy. Using Excel enables easy customization, data visualization, and quick updating for ongoing financial management.
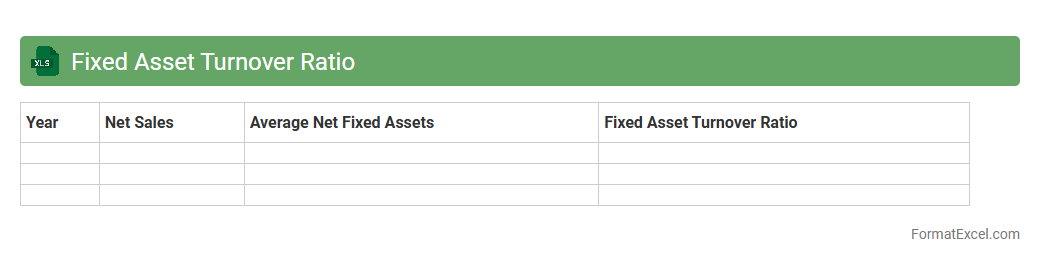
Fixed Asset Turnover Ratio
The
Fixed Asset Turnover Ratio Excel document calculates the efficiency of a company in generating sales from its fixed assets by dividing net sales by average net fixed assets. This ratio helps businesses assess how well their investments in property, plant, and equipment are being utilized to produce revenue. Using this Excel tool enables quick analysis, supports financial decision-making, and aids in benchmarking asset performance against industry standards.
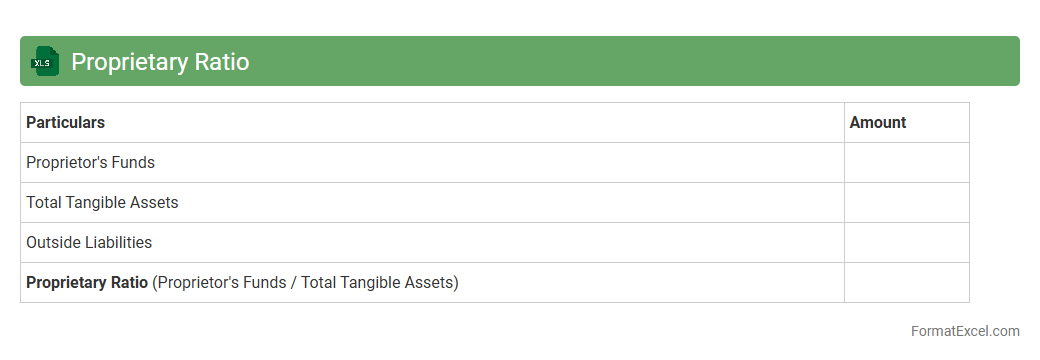
Proprietary Ratio
The
Proprietary Ratio Excel document is a financial tool used to calculate the ratio of shareholders' equity to total assets, indicating the company's financial stability and ownership structure. It helps investors and management assess the extent to which a company is financed by its shareholders rather than debt, providing insights into financial risk and solvency. This document simplifies analysis by automatically processing data and generating results, improving decision-making efficiency.
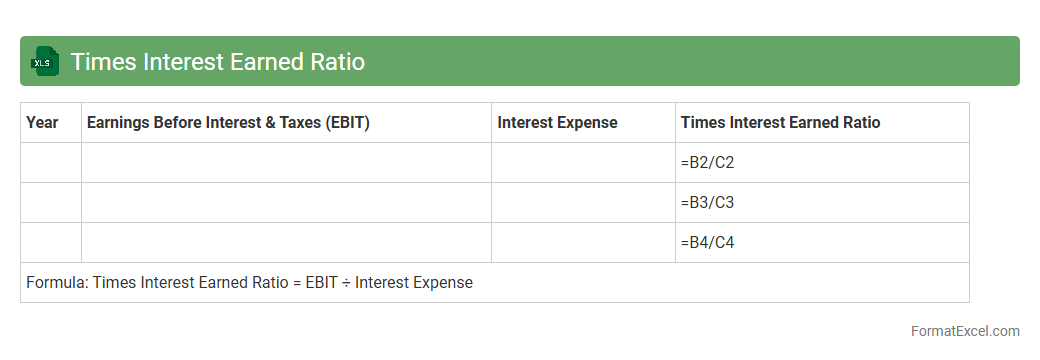
Times Interest Earned Ratio
The
Times Interest Earned Ratio Excel document calculates a company's ability to meet its debt obligations by comparing its earnings before interest and taxes (EBIT) to its interest expenses. This financial metric helps assess the risk level of lending to or investing in a business by showing how many times the company can cover interest payments with its operating income. Using this Excel tool allows for quick, accurate analysis and supports informed decision-making in financial planning and credit evaluation.
Dividend Yield Ratio
The
Dividend Yield Ratio Excel document calculates the percentage return on investment from dividends relative to the stock price, helping investors assess income generation potential. It uses data such as annual dividends per share and current market price to provide a clear, quantitative measure for comparing different stocks. This tool is essential for investors seeking steady income, enabling informed decisions in portfolio management and risk assessment.
Introduction to Ratio Analysis Format in Excel
Ratio analysis in Excel involves organizing financial data into structured formats to evaluate a company's performance. This method simplifies complex financial information into measurable metrics. Excel provides a versatile platform for dynamic and interactive financial analysis.
Importance of Ratio Analysis in Financial Reporting
Ratio analysis plays a crucial role in financial reporting by offering clear insights into a firm's operational efficiency, liquidity, and profitability. It helps stakeholders make informed decisions based on quantitative financial indicators. Accurate ratio analysis enhances transparency and accountability.
Key Financial Ratios to Include in Excel
Essential financial ratios to include are liquidity ratios (like current ratio), profitability ratios (such as return on equity), and solvency ratios (debt to equity ratio). These key metrics provide a well-rounded view of financial health. Including a diverse set of ratios ensures comprehensive analysis.
Setting Up Data Tables for Ratio Analysis
Data tables should be organized with clear headings, consistent formatting, and input cells separated from calculated cells. Proper table design facilitates easy updating and reduces errors in data management. Structured tables serve as the backbone for effective ratio calculations.
Designing a User-Friendly Excel Layout
A user-friendly layout employs clean formats, color coding, and logical navigation to improve readability. Group related ratios and use labeling to guide users through the analysis. Well-designed sheets make complex financial data accessible to diverse users.
Step-by-Step Guide to Calculating Ratios in Excel
Start by inputting raw financial data, then use simple formulas to compute each ratio systematically. Ensure cell references are correct and consistent to avoid inaccuracies in calculations. Document the methodology alongside calculations for clarity.
Automating Ratio Calculations with Excel Formulas
Excel formulas like SUM, AVERAGE, and cell referencing enable automated calculation of financial ratios. Using named ranges and dynamic formulas enhances efficiency and reduces manual errors. Automation allows real-time updates as data changes.
Visualizing Ratio Analysis with Charts and Graphs
Charts and graphs convert numerical ratios into visual insights that are easier to interpret. Bar charts, line graphs, and pie charts are popular tools for highlighting financial trends and comparisons. Visualizations support more impactful presentations of ratio analysis.
Common Mistakes to Avoid in Excel Ratio Analysis
Avoid errors such as incorrect cell references, mixing raw and calculated data in the same cells, and failing to update formulas with new data. Overlooking data validation and inconsistent formatting can lead to misleading results. Careful review is critical to maintaining accuracy.
Downloadable Sample Ratio Analysis Excel Template
Using a pre-built Excel template saves time and ensures a comprehensive structure for ratio analysis. Templates include sample data, formulas, and charts to guide users through the process of financial evaluation. Downloadable resources enhance learning and implementation efficiency.