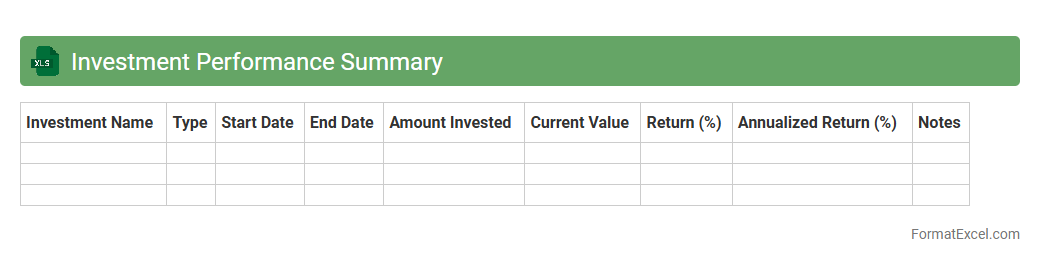
Investment Performance Summary
An
Investment Performance Summary Excel document provides a detailed overview of portfolio returns, asset allocations, and risk metrics in a structured format. This tool enables investors to track investment growth, compare performance against benchmarks, and make data-driven decisions for portfolio optimization. By consolidating historical data and visual insights, it enhances transparency and strategic financial planning.
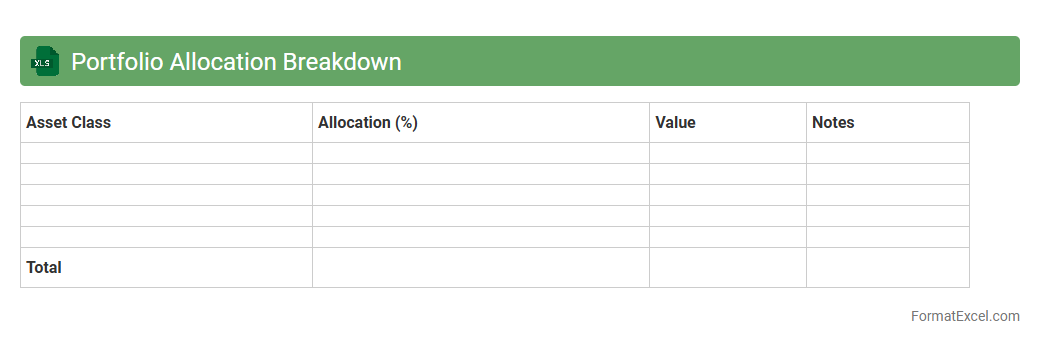
Portfolio Allocation Breakdown
A
Portfolio Allocation Breakdown Excel document organizes and visualizes investment distributions across various asset classes, sectors, or individual holdings. It helps investors assess diversification, identify overexposure risks, and make informed decisions to optimize returns and manage risk effectively. Using clear charts and breakdown tables, this tool enhances financial planning and portfolio monitoring.
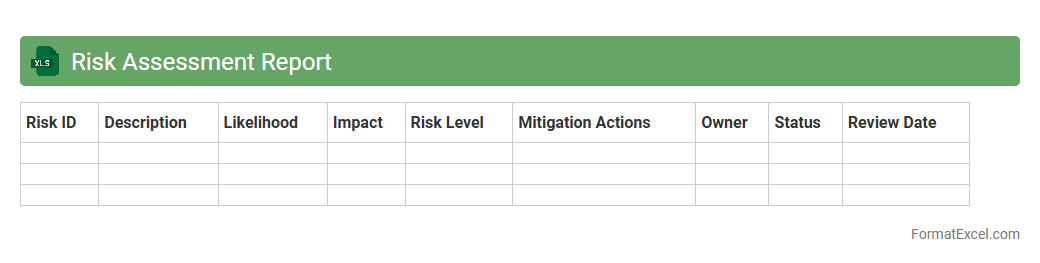
Risk Assessment Report
A
Risk Assessment Report Excel document systematically identifies, analyzes, and evaluates potential risks within a project or organization using organized spreadsheets. It allows users to quantify risks, prioritize them based on severity and likelihood, and develop mitigation strategies efficiently. This tool enhances decision-making and ensures proactive risk management, ultimately minimizing potential negative impacts on operations and goals.
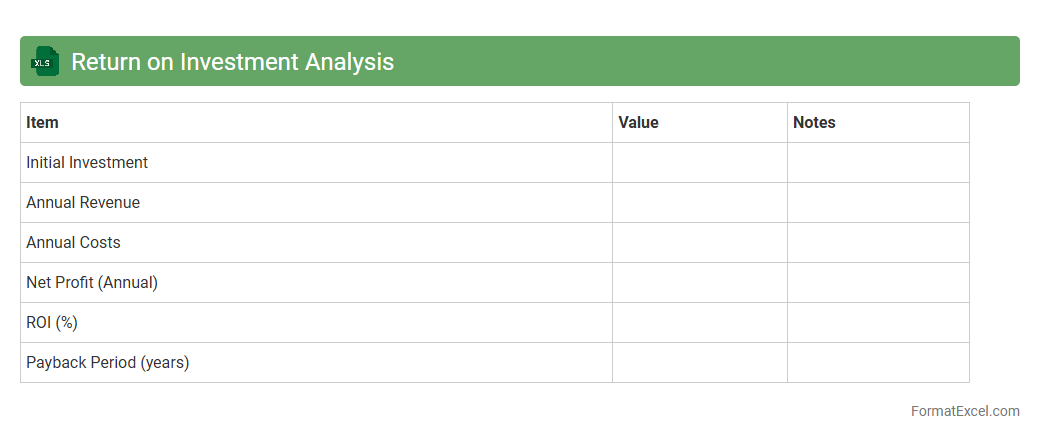
Return on Investment Analysis
A
Return on Investment (ROI) Analysis Excel document is a spreadsheet tool designed to calculate and evaluate the profitability of an investment by comparing the net profit to the initial cost. It provides a clear visual representation of financial returns, enabling users to make data-driven decisions on resource allocation and project feasibility. This tool is essential for businesses and investors seeking to maximize profit, minimize risk, and strategically plan future investments.
Asset Correlation Matrix
An
Asset Correlation Matrix Excel document displays the correlation coefficients between different asset classes or securities, enabling investors to assess how assets move in relation to each other. This tool is crucial for portfolio diversification, as it helps identify non-correlated or negatively correlated assets that can reduce overall portfolio risk. Utilizing this matrix supports more informed decision-making by revealing relationships that impact risk management and investment strategy optimization.
Dividend Income Tracker
A
Dividend Income Tracker Excel document is a specialized spreadsheet designed to monitor and manage dividend payments from investments in stocks or mutual funds. It helps investors keep detailed records of dividend dates, amounts, yield percentages, and reinvestment activities, enabling efficient portfolio analysis. This tool enhances financial planning by providing clear visibility into passive income streams and supporting strategic decision-making for maximizing returns.
Capital Gains Report
A
Capital Gains Report Excel document systematically records and calculates the profits or losses from the sale of assets such as stocks, real estate, or mutual funds. It helps investors and taxpayers track transactions, determine taxable gains, and ensure accurate tax filing by organizing purchase dates, sale dates, acquisition costs, and sale prices. This report is essential for efficient financial planning and compliance with tax regulations.
Sector Allocation Overview
The
Sector Allocation Overview Excel document provides a detailed breakdown of investments across various industry sectors, enabling clearer insights into portfolio diversification. It helps investors and portfolio managers identify concentration risks and balance asset distribution efficiently. This structured overview supports informed decision-making by highlighting sector weightings and performance trends over time.
Performance Attribution Analysis
Performance Attribution Analysis Excel document is a powerful tool used to break down and quantify the sources of investment portfolio returns. It helps investors and portfolio managers understand how different asset classes, sectors, or individual securities contribute to overall performance by comparing actual returns against a benchmark.
Performance Attribution Analysis enables data-driven decisions, enhances portfolio transparency, and optimizes investment strategies for improved risk-adjusted returns.
Benchmark Comparison Table
A
Benchmark Comparison Table Excel document organizes and displays key performance metrics of multiple entities side-by-side, allowing for straightforward evaluation of data such as sales figures, productivity rates, or quality scores. This tool is essential for identifying best practices, spotting performance gaps, and making informed decisions based on quantifiable benchmarks. By facilitating clear visualization and easy customization of criteria, the table streamlines performance analysis and strategic planning processes.
Sharpe Ratio Calculation
The
Sharpe Ratio Calculation Excel document is a financial tool designed to measure the risk-adjusted return of an investment by calculating the ratio between excess return and volatility. This document helps investors and analysts evaluate portfolio performance by quantifying how much return is earned per unit of risk, facilitating better investment decisions. By using this Excel file, users can input their investment data to systematically assess and compare the efficiency of different portfolios or assets.
Internal Rate of Return Report
An
Internal Rate of Return (IRR) Report Excel document is a financial tool designed to calculate and present the IRR for various investment projects or cash flow streams. It helps determine the profitability and efficiency of investments by providing a clear percentage return, aiding decision-makers in comparing project viability. Using this Excel report streamlines analysis, supports investment planning, and enhances financial forecasting accuracy for businesses and investors.
Alpha and Beta Analysis
Alpha and Beta Analysis in Excel is a
financial risk assessment tool used to evaluate the performance of investment portfolios by measuring returns relative to market benchmarks. This analysis helps identify the excess return (Alpha) generated by active management and the sensitivity of the portfolio to market movements (Beta). Utilizing these metrics aids investors in making informed decisions, optimizing portfolio allocation, and understanding systematic risk exposure.
Cash Flow from Investments
The
Cash Flow from Investments Excel document tracks inflows and outflows related to asset purchases, sales, and other investment activities, providing a clear picture of a company's investment performance. It helps investors and managers analyze how capital expenditures and investment income affect overall cash position, supporting better financial decision-making. By organizing this data in Excel, users can easily update, visualize trends, and forecast future cash flows linked to investment activities.
Expense Ratio Summary
The
Expense Ratio Summary Excel document provides a detailed overview of the costs associated with various investment funds, helping investors compare management fees and operational expenses efficiently. It consolidates expense ratios, enabling quick assessment of fund performance relative to fees, which is essential for optimizing investment decisions. This document enhances financial planning by offering clear insights into cost structures, ensuring better portfolio management.
Investment Valuation Tracker
The
Investment Valuation Tracker Excel document is a powerful financial tool designed to monitor the performance and value of various investment assets over time. It allows users to input data such as purchase price, current market value, dividends, and relevant financial metrics, enabling accurate tracking and analysis of portfolio growth. This tracker helps investors make informed decisions by providing clear insights into ROI, risk assessment, and asset allocation efficiency.
Geographic Exposure Report
A
Geographic Exposure Report Excel document provides a detailed analysis of an organization's financial or operational risks and opportunities based on geographic locations. It helps companies identify concentration risks, assess market potential, and optimize resource allocation by visualizing exposure across different regions. This report is crucial for informed decision-making in risk management, strategic planning, and compliance monitoring.
Top Holdings Overview
The
Top Holdings Overview Excel document provides a detailed summary of the largest asset positions within a portfolio, highlighting key investments and their respective values. This tool enables investors and analysts to quickly assess concentration risks, diversification levels, and portfolio allocation efficiency. By presenting data in a clear, organized format, it supports informed decision-making and strategic portfolio management.
Liquidity Assessment Table
The
Liquidity Assessment Table Excel document is a structured financial tool designed to evaluate a company's short-term ability to meet its obligations by analyzing current assets and liabilities. This table helps businesses identify potential cash flow issues early, enabling timely decisions to maintain financial stability. By providing a clear overview of liquidity ratios and trends, it supports effective risk management and operational planning.
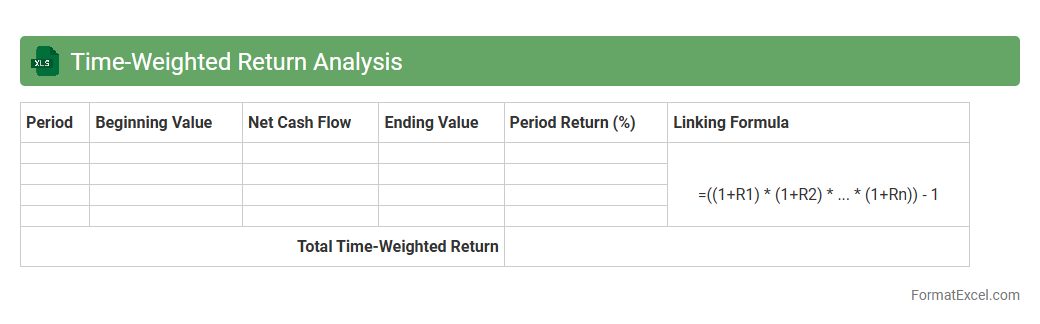
Time-Weighted Return Analysis
The
Time-Weighted Return Analysis Excel document calculates investment performance by eliminating the impact of cash flows, providing a precise measure of portfolio growth over time. It is useful for investors and portfolio managers to evaluate the true performance of their investments, independent of external contributions or withdrawals. This analysis helps in comparing fund managers, assessing strategies, and making informed decisions based on consistent performance metrics.
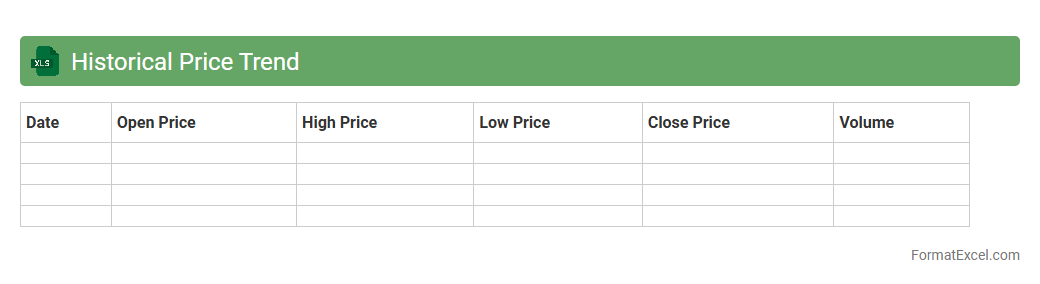
Historical Price Trend
The
Historical Price Trend Excel document compiles past pricing data to identify patterns and fluctuations over time, enabling better forecasting and strategic planning. It allows analysts and businesses to evaluate price movements, detect seasonal trends, and make data-driven decisions to optimize costs or profits. This tool is essential for market research, budgeting, and investment analysis, providing a clear visualization of pricing dynamics.
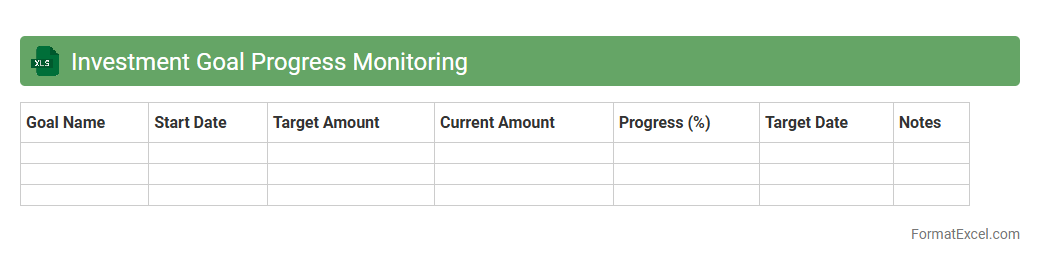
Investment Goal Progress Monitoring
The
Investment Goal Progress Monitoring Excel document tracks and evaluates the performance of your investment portfolio against predetermined financial objectives. It provides real-time visualization of asset allocation, return rates, and milestone achievements, enabling informed decision-making. This tool enhances financial discipline by ensuring systematic progress toward goals like retirement, education, or wealth accumulation.
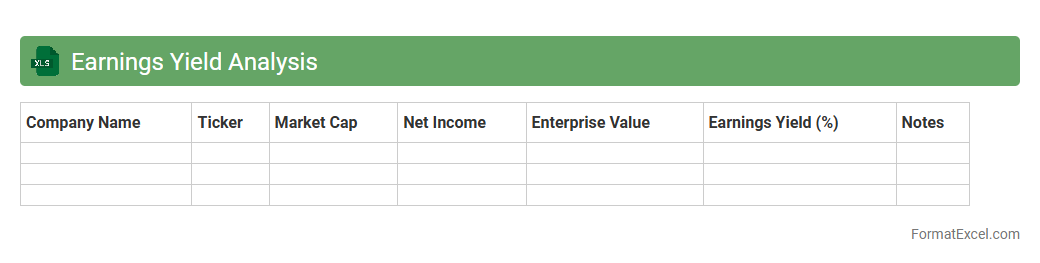
Earnings Yield Analysis
Earnings Yield Analysis Excel document calculates the earnings yield by dividing a company's earnings per share (EPS) by its current share price, allowing investors to assess the profitability relative to market valuation. This tool helps in identifying undervalued stocks by comparing the earnings yield to bond yields or industry averages, providing insights into investment opportunities. The
Earnings Yield metric is crucial for making informed decisions in equity valuation and portfolio management.
Drawdown Analysis
Drawdown Analysis Excel document is a powerful tool used to measure and visualize the peak-to-trough decline in an investment or portfolio's value over a specified period. It helps investors and financial analysts understand the risk and volatility by identifying the maximum loss before a new peak is achieved. Using this
Drawdown Analysis enables better risk management and informed decision-making by highlighting potential vulnerabilities in investment strategies.
Scenario Analysis Summary
A
Scenario Analysis Summary Excel document consolidates various business scenarios and their projected outcomes into a single, organized format, enabling clear comparison and assessment. It is useful for identifying potential risks and opportunities by modeling different variables and their impact on financial performance or operational metrics. This tool enhances strategic decision-making by providing actionable insights based on data-driven forecasts.
Introduction to Investment Analysis in Excel
Investment analysis involves evaluating potential investment opportunities to determine their profitability and risk. Excel serves as a powerful tool for performing detailed financial assessments due to its flexibility and robust features. Understanding the basics of investment analysis in Excel is essential for making informed decisions.
Key Components of an Excel Investment Analysis
The key components include data input, financial projections, ratio calculations, and scenario analysis. Accurate organization of financial data ensures reliable outcomes from the model. Mastering these components enhances the accuracy of investment evaluations.
Setting Up the Excel Spreadsheet
Create a structured layout dividing input data, processing calculations, and output summaries. Use tables and named ranges to maintain clarity and enable quick updates. A well-organized spreadsheet improves readability and user efficiency.
Inputting and Organizing Financial Data
Input all relevant data such as revenues, costs, and investment amounts carefully. Organize data in consistent formats and separate sheets if necessary for accuracy. Proper organization minimizes errors and simplifies analysis.
Profit and Loss Projection Templates
Use templates to project future revenues and expenses over a period. These templates help estimate net income and assess potential profitability. Implementing standardized templates accelerates forecasting tasks.
Cash Flow Analysis Tools
Cash flow analysis tracks inflows and outflows to determine liquidity over time. Dedicated Excel templates can automate this process and highlight critical cash positions. Effective cash flow tracking is vital to avoid financial shortfalls.
Ratio and Sensitivity Analysis in Excel
Calculate key financial ratios such as ROI, NPV, and IRR to assess investment viability. Sensitivity analysis tests how changes in assumptions impact results, enabling risk evaluation. These advanced calculations enhance the depth of analysis.
Visualizing Investment Metrics with Charts
Charts like line graphs and bar charts illustrate trends and comparisons effectively. Visualizing data helps stakeholders quickly grasp financial insights. Employing charts makes presentations more compelling and understandable.
Interpretation of Analytical Results
Review results to identify investment strengths and weaknesses. Compare projections against benchmarks to determine feasibility. Clear interpretation guides smarter investment choices.
Tips for Effective Investment Analysis Reporting in Excel
Summarize key findings, use clean formatting, and include visual aids for clarity. Keep reports concise and focused on actionable insights. Effective reporting ensures decision-makers grasp the essential information promptly.