Break Even Point Calculation
The
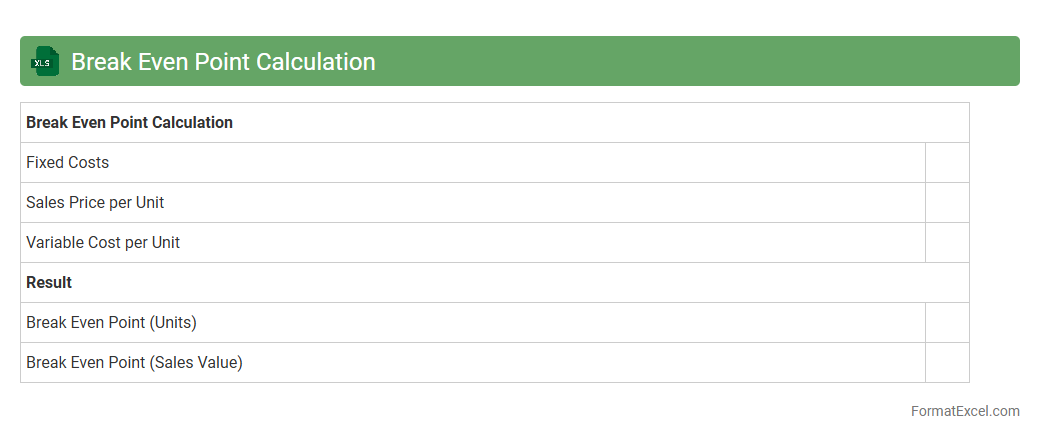
Break Even Point Calculation Excel document is a financial tool used to determine the point at which total revenues equal total costs, resulting in neither profit nor loss. It helps businesses identify the minimum sales volume needed to cover fixed and variable costs, enabling better decision-making regarding pricing, budgeting, and cost control. By providing clear visualization and easy adjustments of key variables, this Excel sheet supports strategic planning and financial forecasting.
Break Even Units
The
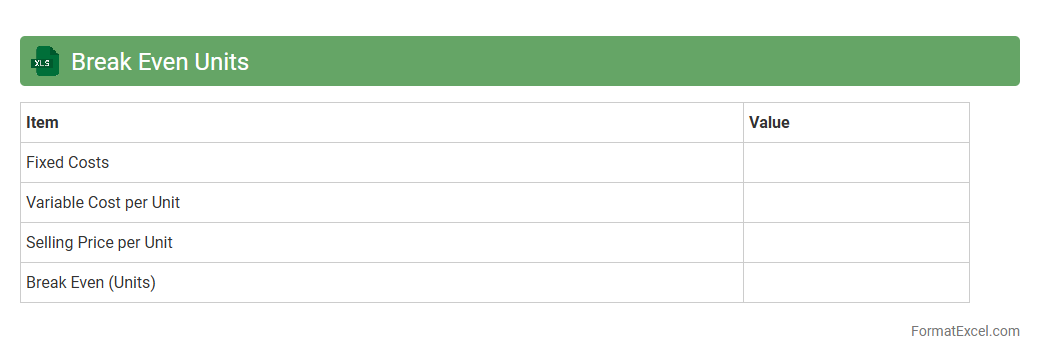
Break Even Units Excel document is a financial tool that calculates the number of units a business must sell to cover total costs, including fixed and variable expenses. It helps identify the sales volume needed to achieve zero profit or loss, enabling accurate budgeting and pricing strategies. Businesses use this document to make informed decisions, optimize production levels, and improve profitability forecasts.
Break Even Sales Revenue
The
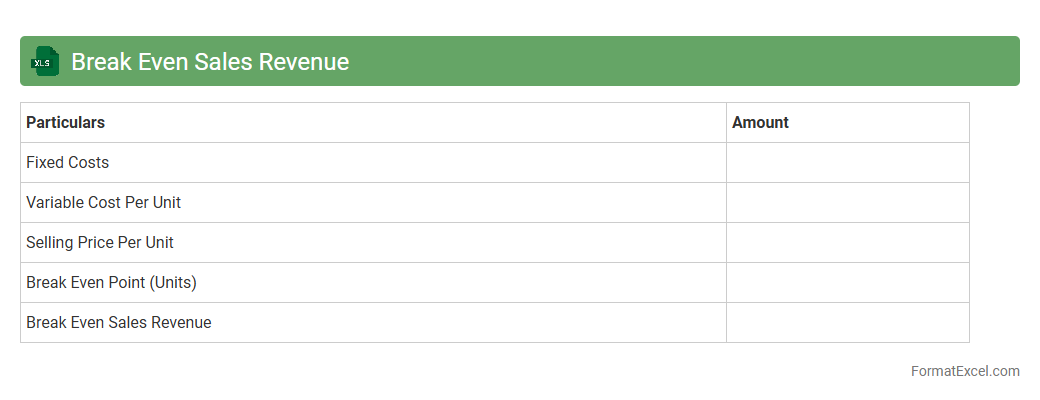
Break Even Sales Revenue Excel document calculates the exact sales amount needed to cover all fixed and variable costs, ensuring no profit or loss. This tool provides businesses with crucial insight to set realistic sales targets and make informed financial decisions. By analyzing this data, companies can optimize pricing strategies and manage expenses effectively to achieve profitability.
Fixed Costs Analysis
A
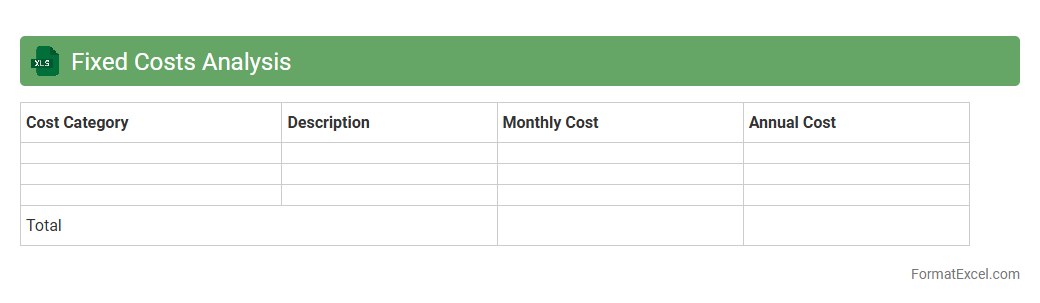
Fixed Costs Analysis Excel document is a financial tool designed to track and evaluate expenses that remain constant regardless of production or sales volume. It helps businesses identify, categorize, and manage fixed costs such as rent, salaries, and insurance, enabling more accurate budgeting and forecasting. Utilizing this document improves cost control and supports strategic decision-making by highlighting the impact of fixed costs on profitability.
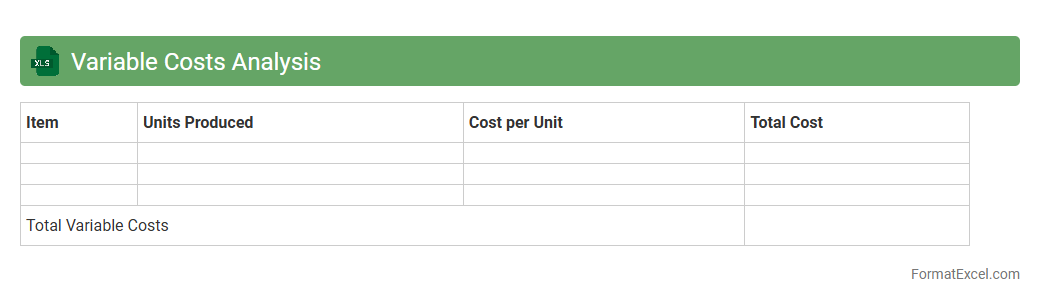
Variable Costs Analysis
Variable Costs Analysis in an Excel document involves tracking and evaluating costs that change directly with production volume or business activity levels. This analysis helps businesses identify and manage expenses such as raw materials, labor, and utilities, facilitating accurate budgeting and cost control. Using a
Variable Costs Analysis Excel file enables real-time data manipulation and visualization, improving decision-making and financial forecasting.
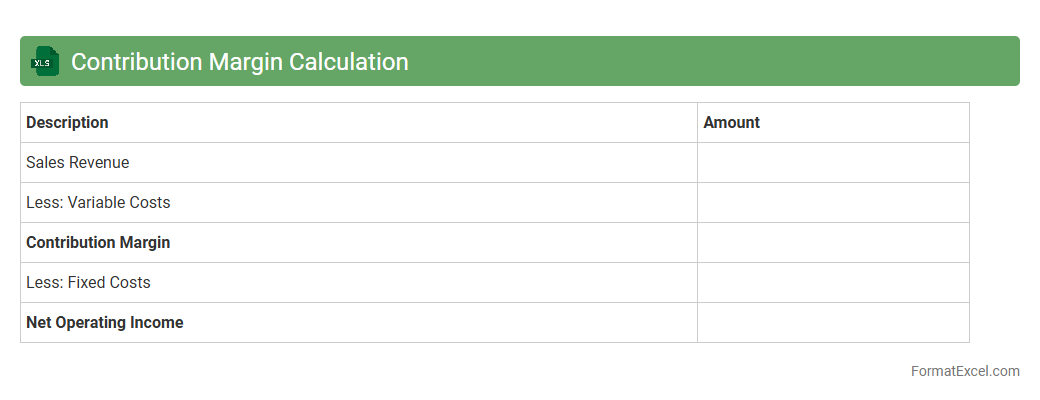
Contribution Margin Calculation
The
Contribution Margin Calculation Excel document is a financial tool designed to analyze the profitability of products or services by calculating the difference between sales revenue and variable costs. It helps businesses identify how much revenue contributes to fixed costs and profit after covering variable expenses, allowing for better pricing, budgeting, and decision-making. Utilizing this document enhances understanding of cost behavior and supports strategic planning to maximize overall profitability.
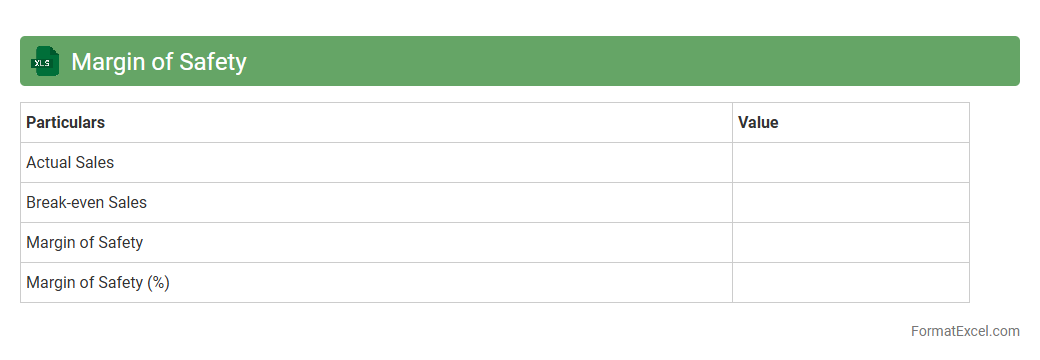
Margin of Safety
A
Margin of Safety Excel document is a financial tool designed to calculate the difference between the expected sales and the break-even sales, helping businesses identify the buffer available before incurring losses. It assists managers and investors in assessing risk by showing how much sales can decline before the company reaches its break-even point. By providing clear visibility into this critical metric, it supports informed decision-making and strategic planning to enhance financial stability.
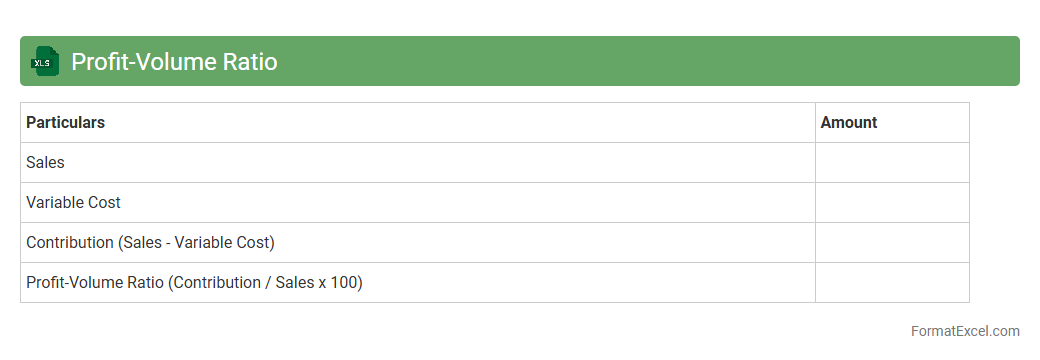
Profit-Volume Ratio
The
Profit-Volume Ratio (PVR) Excel document calculates the relationship between profit and sales volume, providing insights into a company's profitability by showing how much profit is generated per unit of sales. This tool is useful for analyzing cost behavior, break-even points, and margin of safety, enabling businesses to make informed decisions on pricing, budgeting, and sales strategies. By using this Excel sheet, companies can quickly assess the impact of changes in sales volume on profits, thereby optimizing operational efficiency and financial planning.
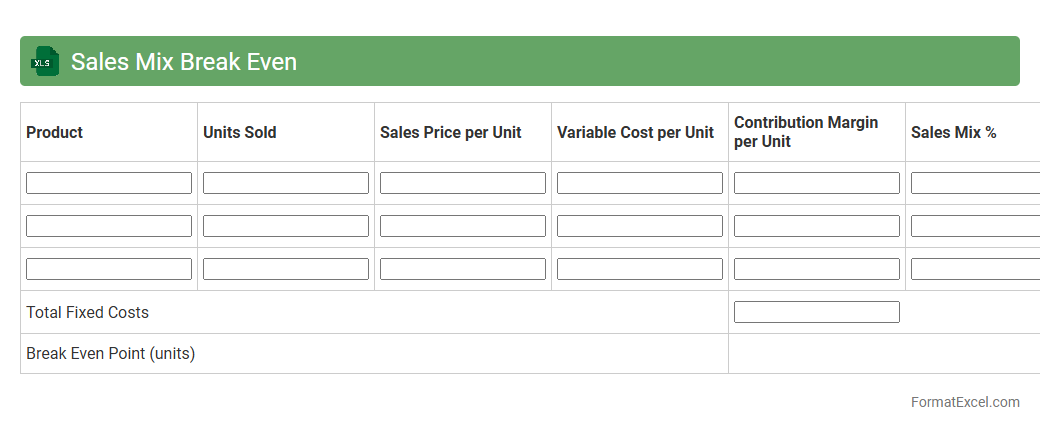
Sales Mix Break Even
A
Sales Mix Break Even Excel document is a financial analysis tool that calculates the break-even point by considering multiple products or services with different profit margins and sales volumes. It helps businesses determine the optimal sales combination needed to cover fixed and variable costs while maximizing profitability. This document is useful for strategic decision-making, enabling companies to optimize product portfolios and set realistic sales targets.
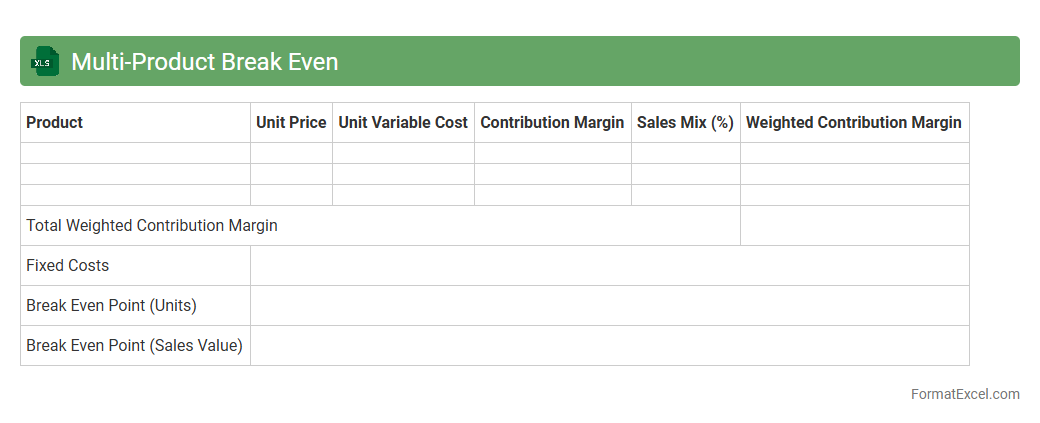
Multi-Product Break Even
A
Multi-Product Break Even Excel document calculates the sales volume at which total revenues equal total costs across multiple products, helping businesses determine the minimum sales needed to avoid losses. It uses variables such as fixed costs, variable costs, and sales price per product to provide a comprehensive financial overview. This tool enables informed decision-making by identifying profitable product mixes and optimizing resource allocation.
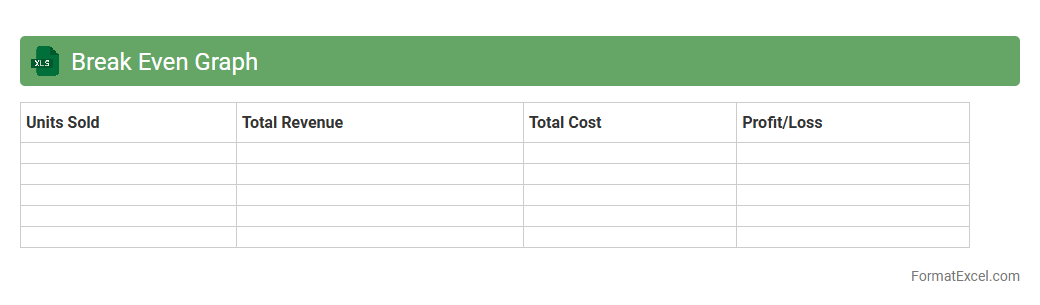
Break Even Graph
A
Break Even Graph in an Excel document visually represents the point at which total costs equal total revenue, indicating no profit or loss. It is useful for businesses to analyze cost structures, set pricing strategies, and make informed financial decisions. The graph helps identify the minimum sales volume required to cover costs and achieve profitability.
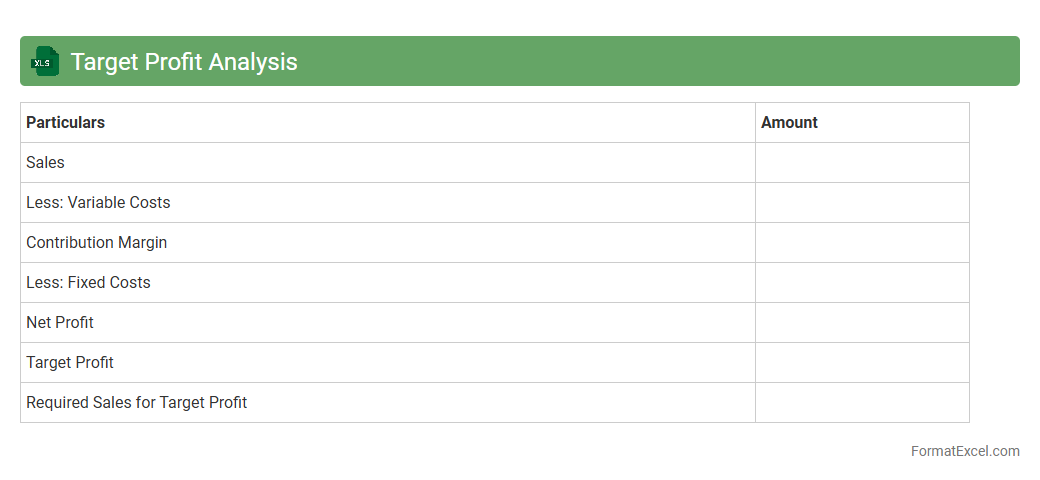
Target Profit Analysis
Target Profit Analysis in an Excel document is a powerful financial tool designed to calculate the sales volume needed to achieve a specific profit goal. It uses key variables such as fixed costs, variable costs per unit, and desired profit to provide precise break-even and target profit points. Utilizing
Target Profit Analysis helps businesses make informed pricing, budgeting, and sales strategies to optimize profitability and manage financial risks effectively.
Sensitivity Analysis
Sensitivity Analysis in an
Excel document involves exploring how changes in input variables impact the output of a model, enabling users to identify key drivers and assess risks. This tool allows for the adjustment of assumptions and parameters to see potential outcomes, improving decision-making and financial forecasting. By providing a clear visualization of variable influences, sensitivity analysis supports risk management and strategic planning in various business and research contexts.
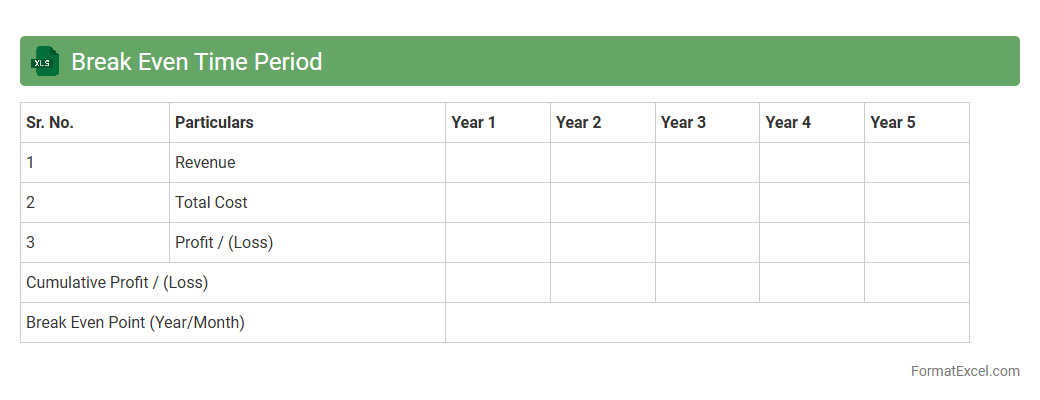
Break Even Time Period
The
Break Even Time Period Excel document calculates the time required for an investment to recover its initial costs through generated returns. It is crucial for financial planning and decision-making, allowing users to assess the viability and risk of projects by pinpointing when a business or investment will start to generate profit. This tool enhances budget management and supports strategic forecasting in both personal finance and corporate environments.
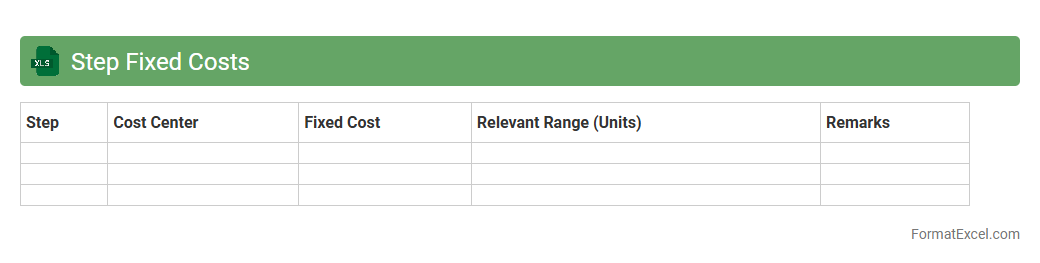
Step Fixed Costs
The
Step Fixed Costs Excel document is a financial tool designed to help businesses track and analyze fixed costs that change at specific activity levels or intervals. It enables users to input cost data and visualize how expenses increase in steps as production or operational activity rises. This document is useful for budgeting, forecasting, and decision-making by providing clear insights into cost behavior and helping optimize resource allocation.
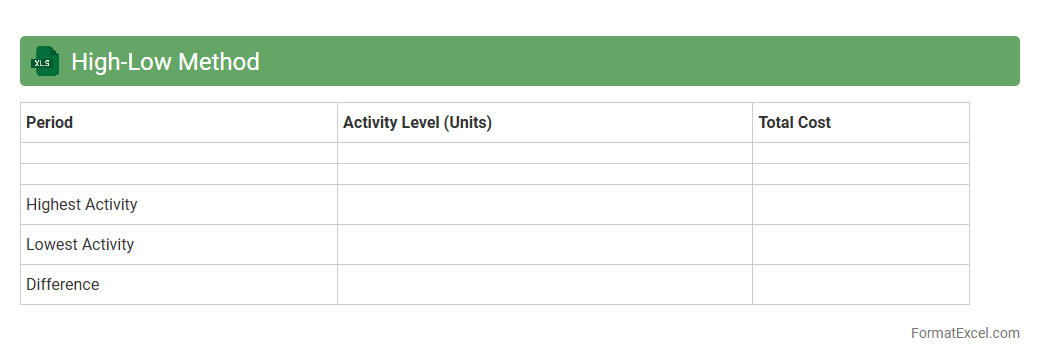
High-Low Method
The
High-Low Method Excel document is a tool used to analyze cost behavior by separating variable and fixed costs based on the highest and lowest activity levels. It helps businesses estimate expenses and forecast budgets accurately by identifying cost functions from historical data. This method is especially useful for managers to make informed financial decisions and improve cost control.
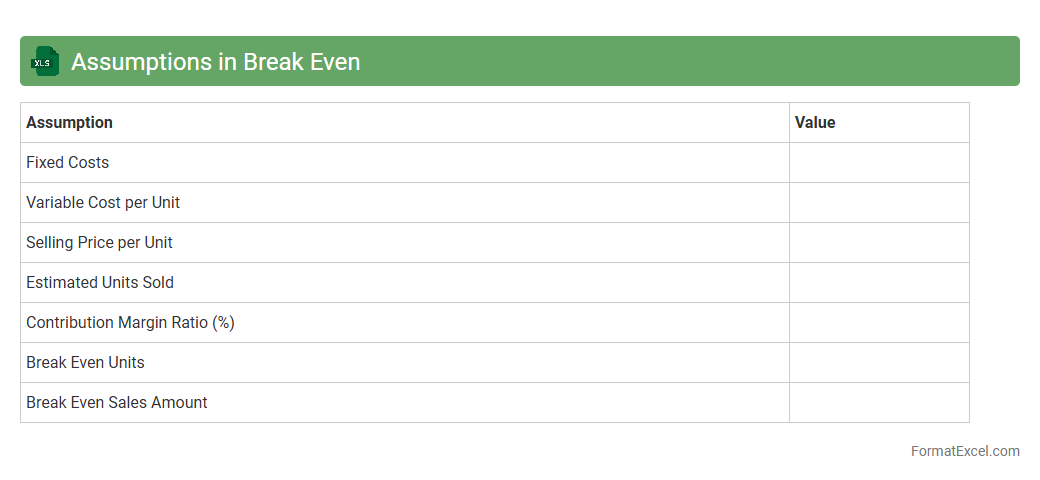
Assumptions in Break Even
Assumptions in a Break Even Excel document represent the key variables such as fixed costs, variable costs, selling price, and sales volume that drive the calculation of the break-even point. These inputs allow users to model different business scenarios and predict when total revenues will cover total costs, aiding in financial planning and decision-making. Understanding and adjusting these
assumptions ensures accurate break-even analysis tailored to specific business conditions.
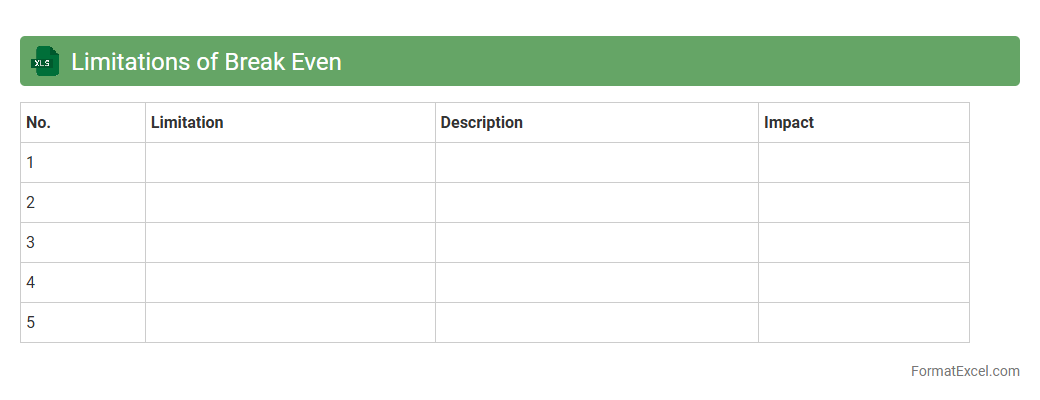
Limitations of Break Even
The
Limitations of Break Even Excel document include its inability to capture dynamic market changes, fixed costs variations, and non-linear cost behaviors, which can affect the accuracy of break-even analysis. Despite these constraints, it remains a valuable tool for quickly estimating the minimum sales volume needed to avoid losses and for visualizing profit thresholds in a clear, data-driven format. This helps businesses make informed decisions regarding pricing, cost control, and financial planning.
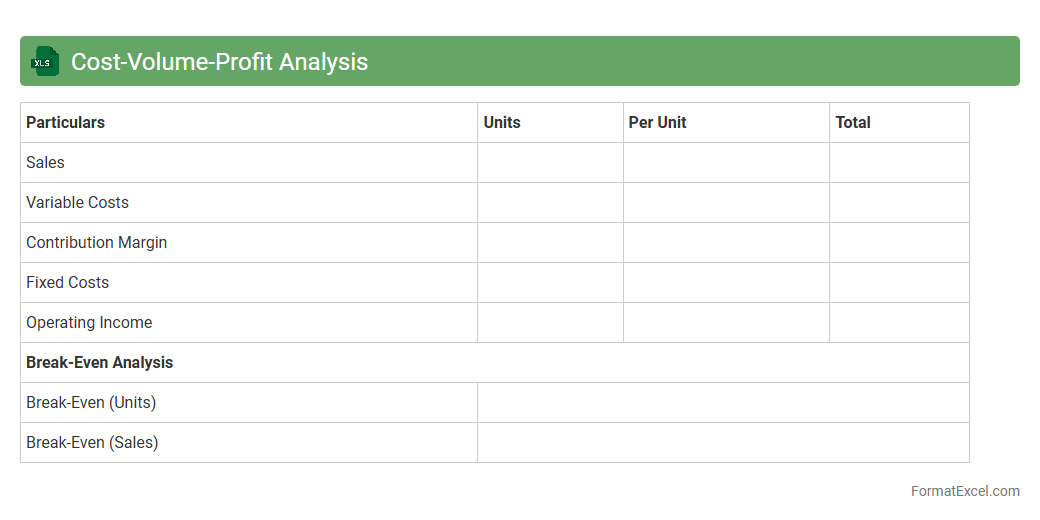
Cost-Volume-Profit Analysis
A
Cost-Volume-Profit (CVP) Analysis Excel document is a financial tool that helps businesses understand the relationship between costs, sales volume, and profits. It enables users to calculate breakeven points, target profits, and margin of safety by inputting fixed costs, variable costs, and sales price per unit. This analysis aids decision-making by forecasting how changes in production levels or pricing impact overall profitability.
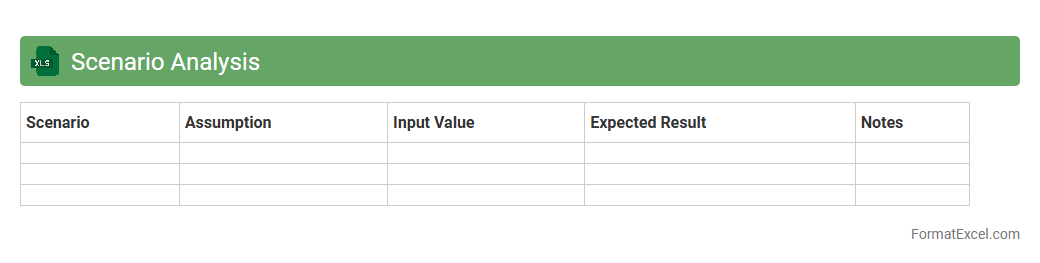
Scenario Analysis
A
Scenario Analysis Excel document is a powerful tool that allows users to model different financial or operational outcomes by adjusting key variables within a spreadsheet. It helps identify potential risks and opportunities by comparing best-case, worst-case, and most likely scenarios, enabling more informed decision-making. This tool is essential for budgeting, forecasting, and strategic planning, as it provides clear insights into how changes in inputs impact overall results.
Operating Leverage
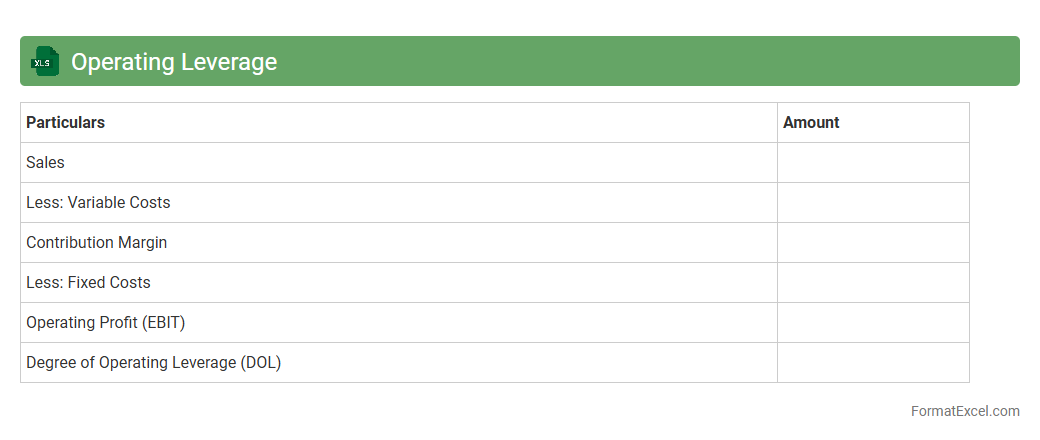
An
Operating Leverage Excel document is a tool designed to calculate and analyze a company's operating leverage by using financial data such as fixed and variable costs along with sales revenue. It helps businesses understand how changes in sales volume impact operating income, enabling more informed decision-making about cost management and profit planning. This document is particularly useful for forecasting financial performance and assessing the risk associated with different levels of production and sales activities.
Impact of Price Changes
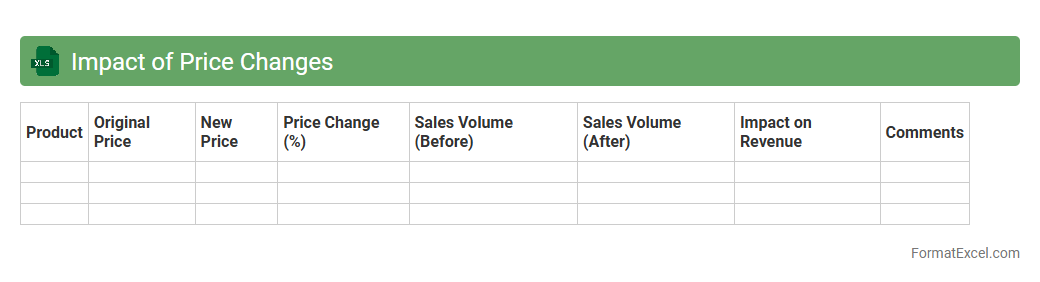
The
Impact of Price Changes Excel document is a powerful tool designed to analyze how fluctuations in price affect sales, revenue, and profit margins. It allows users to model different pricing scenarios, facilitating data-driven decision-making to optimize pricing strategies. This document is essential for businesses aiming to improve financial forecasting and maximize profitability through precise price adjustment insights.
Impact of Cost Changes
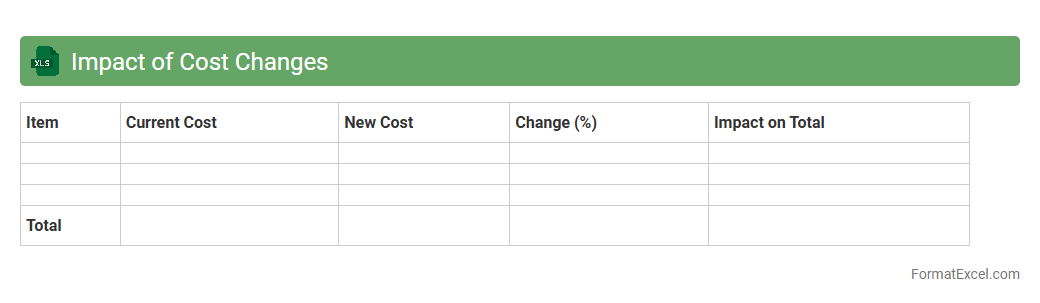
The
Impact of Cost Changes Excel document is a powerful tool designed to analyze and quantify how variations in costs affect overall project budgets or business expenses. By visually mapping cost fluctuations, it helps users quickly identify areas of overspending or potential savings, enabling more informed financial decision-making. This document is essential for budgeting, forecasting, and evaluating the financial sustainability of projects or operations.
Cash Break Even
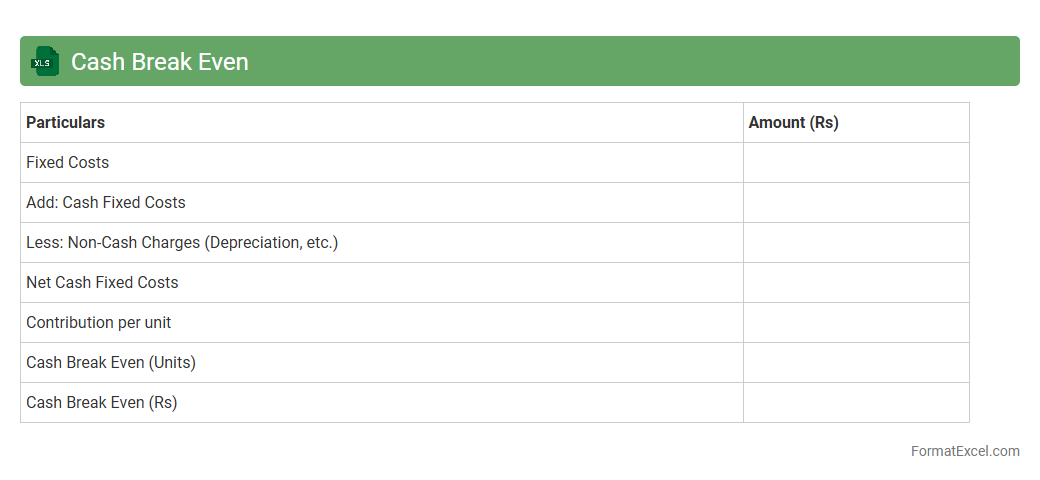
The
Cash Break Even Excel document is a financial tool designed to calculate the point at which total cash inflows equal total cash outflows, ensuring no net loss or gain. It helps businesses determine the minimum revenue required to cover all variable and fixed cash expenses, facilitating effective cash flow management. Utilizing this model supports informed decision-making by highlighting critical financial thresholds and aiding in budgeting and forecasting processes.
Degree of Operating Leverage
A
Degree of Operating Leverage (DOL) Excel document calculates the sensitivity of a company's operating income to changes in sales volume, helping assess business risk. By analyzing fixed and variable costs within the spreadsheet, it provides insights into how sales fluctuations impact profitability. This tool enables managers to make informed decisions on cost structure optimization and financial planning.
Introduction to Break Even Analysis in Excel
Break Even Analysis helps businesses determine the sales volume needed to cover all costs. Using Excel simplifies this financial calculation by offering customizable tools and formulas. It provides a clear view of profitability thresholds.
Benefits of Using Excel for Break Even Analysis
Excel offers flexibility and accuracy for financial modeling and scenarios. It allows quick updates and recalculations when variables change, which is essential for dynamic business environments. Additionally, Excel's visualization tools enhance data interpretation.
Key Components of a Break Even Analysis Format
A comprehensive break even format includes fixed costs, variable costs, sales price, and units sold. These elements help calculate the break even point and margin of safety. Accurately defining these components is crucial for meaningful analysis.
Setting Up Your Excel Worksheet
Begin by labeling sections for costs, revenues, and outputs in Excel. Organize data clearly to facilitate formula application and readability. Proper structure ensures efficient analysis and error minimization.
Inputting Fixed and Variable Costs in Excel
Enter fixed costs as constant values and variable costs as per-unit figures in designated cells. This distinction is vital for calculating total costs and the break even point. Precise cost classification improves accuracy.
Calculating Break Even Point with Excel Formulas
Use formulas like =FixedCosts/(SalesPrice-VariableCost) to compute the break even volume. Excel's ability to handle such calculations instantly aids decision making. Understanding formula application enhances financial insights.
Visualizing Break Even Analysis with Charts
Create line or bar charts to represent costs and revenues against sales volume visually. These charts clearly display the break even point and profitability zones. Visual representation aids comprehension and presentation.
Customizing the Break Even Analysis Template
Modify the template to suit specific industry needs by adjusting costs, prices, and units. Customization improves relevance and usability for unique business models. An adaptable template supports broader application.
Common Mistakes to Avoid in Excel Break Even Analysis
Avoid mixing fixed and variable costs, incorrect formula references, and incomplete data entry. These errors can lead to inaccurate results and poor decision making. Careful attention prevents costly mistakes.
Downloadable Break Even Analysis Excel Template
Many websites offer free downloadable Excel templates tailored for break even analysis. These templates save time and provide ready-made formulas and charts for convenience. Utilizing a template accelerates accurate financial planning.