Risk Register
A
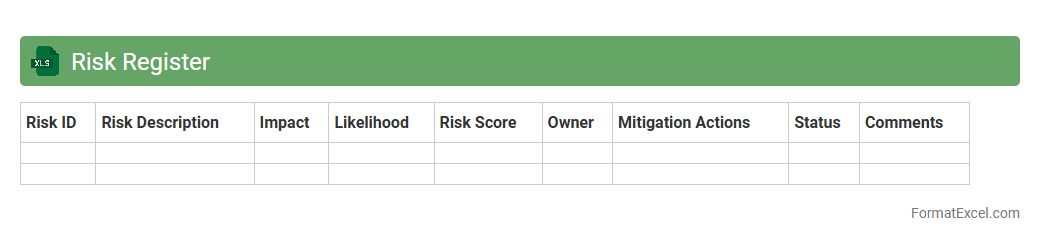
Risk Register Excel document is a structured spreadsheet used to identify, assess, and track potential risks in a project or organization. It helps categorize risks by severity, probability, and mitigation measures, enabling effective risk management and decision-making. This tool enhances transparency and accountability, making it easier to monitor risk status and implement proactive strategies.
Risk Matrix
A
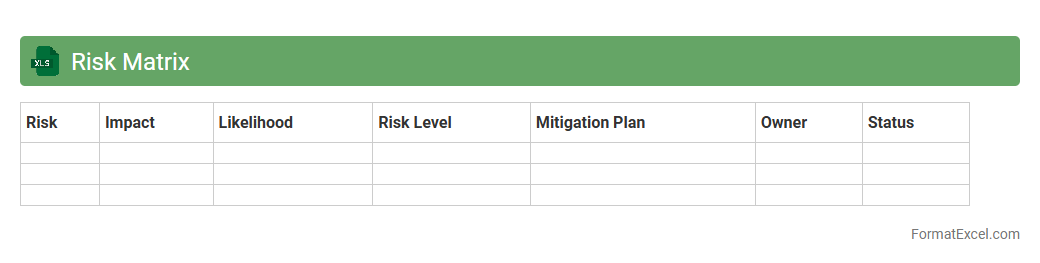
Risk Matrix Excel document is a tool used to identify, evaluate, and prioritize risks based on their likelihood and impact, organized within a structured spreadsheet format. This document helps organizations visually analyze potential threats, streamline risk assessment processes, and make informed decisions for risk mitigation. Utilizing a risk matrix in Excel enhances clarity and efficiency in managing project or operational risks by providing a customizable, easy-to-update risk overview.
Probability Impact Assessment
A
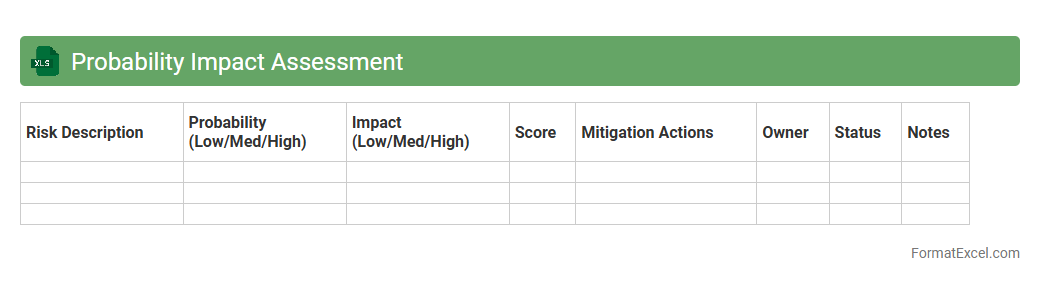
Probability Impact Assessment Excel document is a risk management tool used to evaluate and quantify potential risks by calculating the likelihood of an event occurring and its impact on project objectives. This assessment helps prioritize risks based on their significance, enabling effective decision-making and resource allocation. Organizations use this tool to minimize uncertainties and improve project success rates by systematically identifying and addressing critical risks.
Failure Mode and Effects Analysis
A
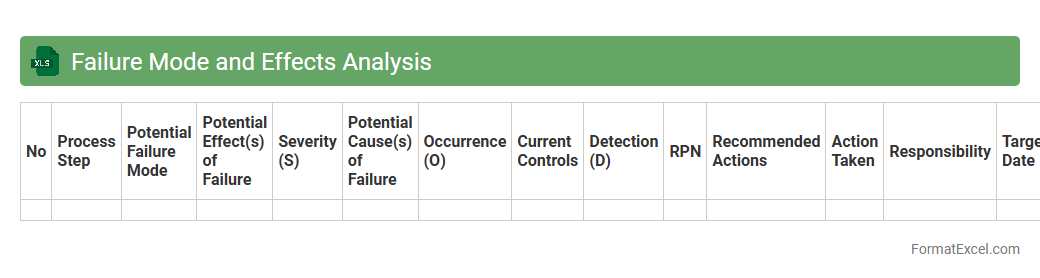
Failure Mode and Effects Analysis (FMEA) Excel document is a structured tool used to identify, prioritize, and mitigate potential failure modes in processes or products by systematically analyzing their causes and effects. It helps organizations improve reliability and quality by assigning risk priority numbers (RPN) based on severity, occurrence, and detection ratings, facilitating targeted corrective actions. Utilizing an FMEA Excel template enhances collaboration, simplifies data entry, and allows for easy updates and reporting throughout the risk assessment process.
Heat Map
A
Heat Map Excel document visually represents data through color gradients, making it easier to identify patterns, trends, and outliers across large datasets. It enhances data analysis by quickly highlighting variations in values, allowing businesses to make informed decisions based on dynamic visual cues. By condensing complex numerical information into an intuitive format, heat maps improve efficiency in interpreting sales figures, performance metrics, and customer behavior.
SWOT Analysis
A
SWOT Analysis Excel document is a structured spreadsheet designed to identify and evaluate an organization's Strengths, Weaknesses, Opportunities, and Threats. It helps users visually map internal and external factors influencing business decisions, enabling strategic planning and risk management. This tool increases clarity, facilitates collaboration, and improves the ability to assess competitive advantages and challenges efficiently.
Sensitivity Analysis
Sensitivity Analysis Excel documents are used to evaluate how changes in input variables impact the output of a financial model or decision-making process. By systematically adjusting key parameters, it helps identify the most influential factors affecting outcomes such as profit, cost, or risk. This analysis supports better decision-making by providing clear insights into risks and opportunities, making
Sensitivity Analysis essential for strategic planning and forecasting.
Monte Carlo Simulation
A
Monte Carlo Simulation Excel document is a tool that uses random sampling and statistical modeling within Excel to predict and analyze the impact of risk and uncertainty in complex systems. It enables users to perform numerous simulations quickly, providing a range of possible outcomes and their probabilities, which is invaluable for informed decision-making in finance, engineering, and project management. This approach helps quantify risks, optimize strategies, and improve forecasting accuracy by modeling real-world variability.
Scenario Analysis
A
Scenario Analysis Excel document is a powerful tool used to evaluate different financial or operational outcomes based on varying input assumptions. It allows businesses to model best-case, worst-case, and most-likely scenarios, enabling informed decision-making and risk assessment. By systematically comparing potential results, organizations can optimize strategies, allocate resources effectively, and improve overall planning accuracy.
Qualitative Risk Assessment
A
Qualitative Risk Assessment Excel document is a tool designed to identify, evaluate, and prioritize risks based on their likelihood and impact without relying on numerical data. It enables project managers and stakeholders to systematically categorize risks, assign severity levels, and develop mitigation strategies efficiently. This document enhances decision-making by providing a clear visualization of potential threats, improving risk management processes and resource allocation.
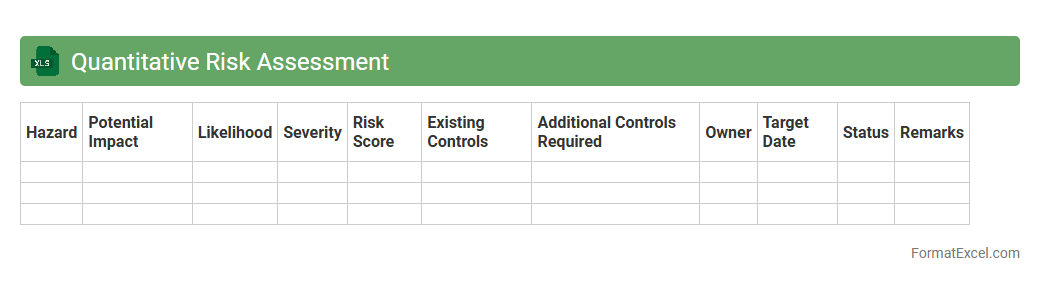
Quantitative Risk Assessment
A
Quantitative Risk Assessment Excel document is a tool used to systematically evaluate potential risks by assigning numerical values to their probability and impact. It enables organizations to prioritize risks based on data-driven analysis, helping to allocate resources effectively and implement mitigation strategies. This document simplifies complex risk calculations and enhances decision-making by providing a clear, visual representation of risk levels through charts and tables.
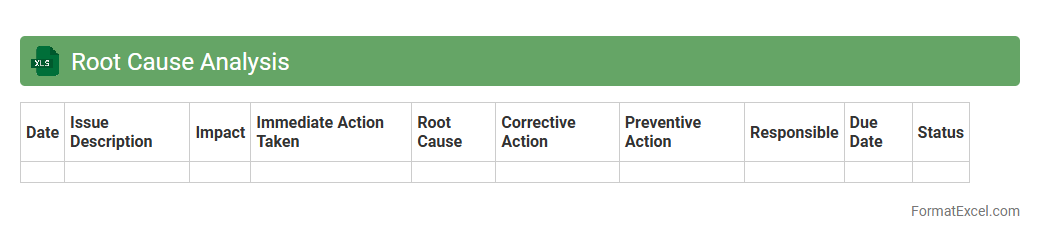
Root Cause Analysis
A
Root Cause Analysis Excel document is a structured tool designed to systematically identify the underlying causes of problems by organizing data and tracking corrective actions. It helps teams visualize cause-and-effect relationships using templates such as fishbone diagrams and 5 Whys analysis, facilitating efficient problem-solving. This tool enhances decision-making, reduces recurring issues, and improves overall process quality in business operations.
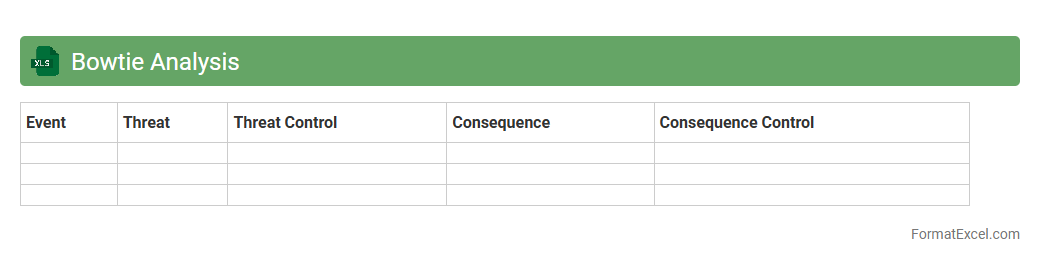
Bowtie Analysis
Bowtie Analysis Excel document is a powerful risk management tool that visualizes potential hazards, threats, and control measures in a clear, structured format. It helps identify risk causes and consequences, enabling organizations to implement preventive and mitigative controls effectively. Using a
Bowtie Analysis Excel document enhances decision-making, improves safety compliance, and supports continuous risk assessment efforts.
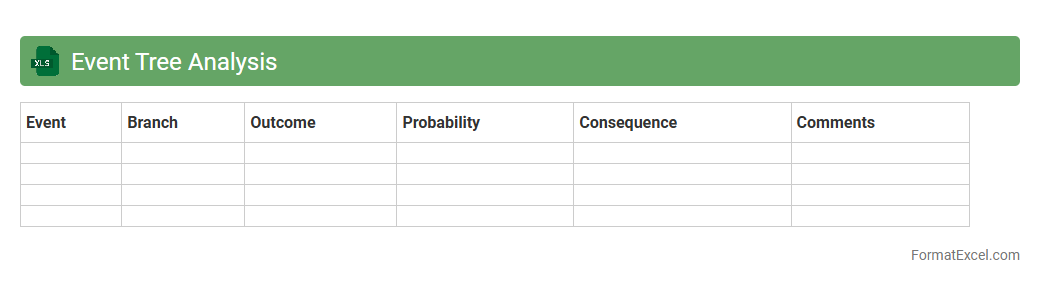
Event Tree Analysis
Event Tree Analysis in an
Excel document is a systematic tool used to evaluate the possible outcomes following an initiating event, mapping successions of failures or successes in a clear, tabular format. This method helps identify critical pathways and quantify risks by visually breaking down complex scenarios into manageable event sequences. Utilizing Excel's functions enhances data manipulation, making it easier to perform sensitivity analysis and improve decision-making in risk management projects.
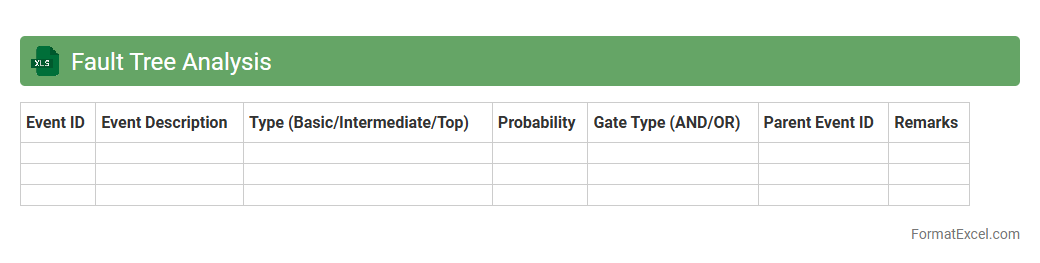
Fault Tree Analysis
A
Fault Tree Analysis (FTA) Excel document is a systematic tool used to identify and analyze potential failure points within complex systems by visually mapping out the logical relationships of faults and their causes. This document enables risk assessment and decision-making by quantifying probabilities of failures, highlighting critical paths, and prioritizing mitigation measures. Utilizing FTA in Excel enhances accessibility and flexibility, allowing users to customize, update, and share detailed reliability data efficiently.
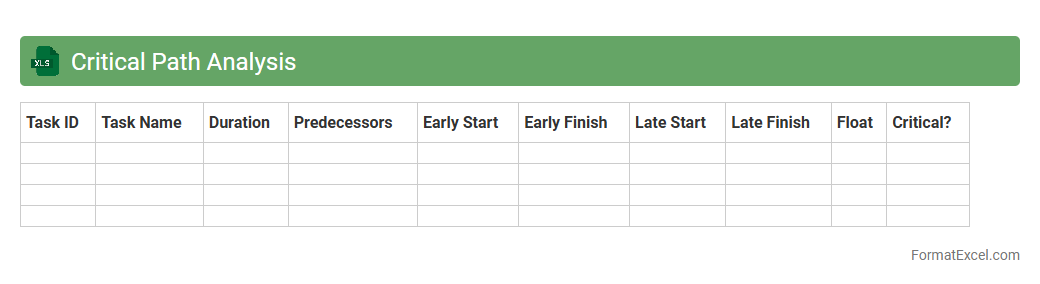
Critical Path Analysis
Critical Path Analysis excel document is a project management tool that visually maps out all essential tasks and their timelines, identifying the longest sequence of dependent activities, known as the
critical path. This analysis helps in pinpointing which tasks directly affect the overall project duration, enabling efficient resource allocation and risk management. By using this tool, teams can optimize scheduling, avoid delays, and ensure timely project completion.
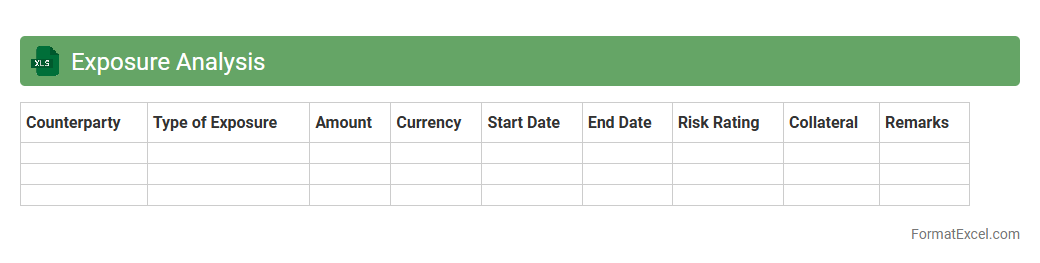
Exposure Analysis
Exposure Analysis Excel document is a powerful tool used to identify, quantify, and assess potential financial risks related to market fluctuations, credit exposure, or operational vulnerabilities. By organizing data systematically, it enables users to analyze different scenarios, measure risk exposure, and make informed decisions to mitigate losses. Implementing
Exposure Analysis enhances risk management strategies and supports better financial planning and forecasting.
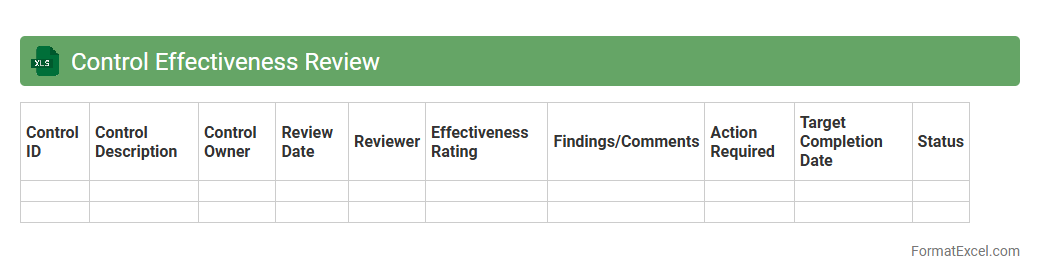
Control Effectiveness Review
The
Control Effectiveness Review Excel document is a comprehensive tool designed to assess and monitor the performance of internal controls within an organization. It helps identify control weaknesses, track remediation actions, and ensure compliance with regulatory standards by providing structured data entry and analysis features. Utilizing this document enhances risk management processes and supports informed decision-making by delivering clear visibility into control effectiveness.
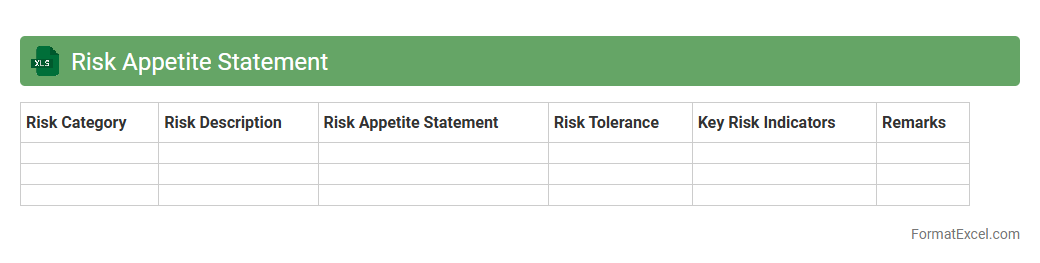
Risk Appetite Statement
A
Risk Appetite Statement Excel document is a structured tool used to define and quantify an organization's tolerance for risk across various operational areas. It helps stakeholders visualize risk thresholds, align risk-taking with strategic objectives, and monitor risk exposure consistently. By providing clear metrics and templates, this document enhances decision-making and supports effective risk management frameworks.
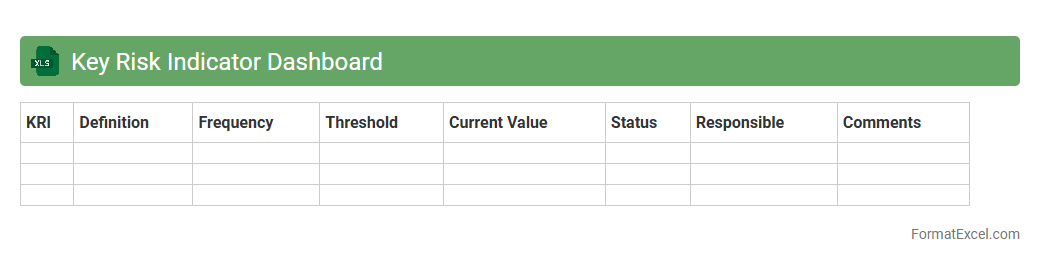
Key Risk Indicator Dashboard
A
Key Risk Indicator (KRI) Dashboard Excel document is a powerful tool designed to monitor and visualize critical risk metrics within an organization. It consolidates data from various sources into clear, customizable charts and tables, enabling timely identification of potential threats and performance weaknesses. This dashboard enhances decision-making by providing real-time risk insights, improving risk management strategies and operational resilience.
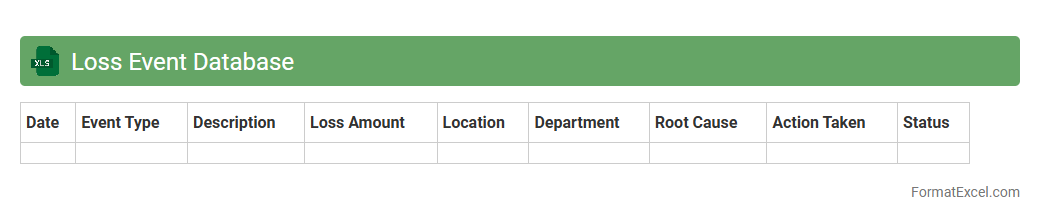
Loss Event Database
A
Loss Event Database Excel document systematically records and categorizes all instances of financial losses within an organization, enabling detailed tracking and analysis. This tool allows risk management teams to identify loss patterns, assess operational risks, and enhance decision-making processes to mitigate future losses. By centralizing loss data, the database supports compliance with regulatory requirements and improves overall financial resilience.
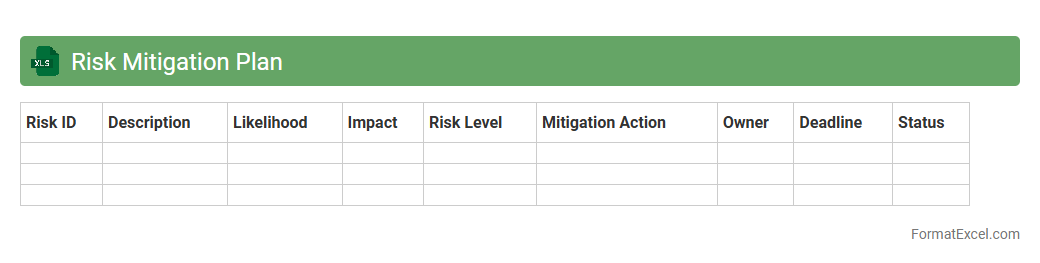
Risk Mitigation Plan
A
Risk Mitigation Plan Excel document is a structured spreadsheet that helps identify, assess, and manage potential risks within a project or organization. It provides a clear framework to document risk factors, assign responsibility, and outline specific mitigation strategies, enabling proactive risk management. By centralizing risk data, this tool improves decision-making, enhances communication among stakeholders, and reduces the impact of uncertainties on project outcomes.
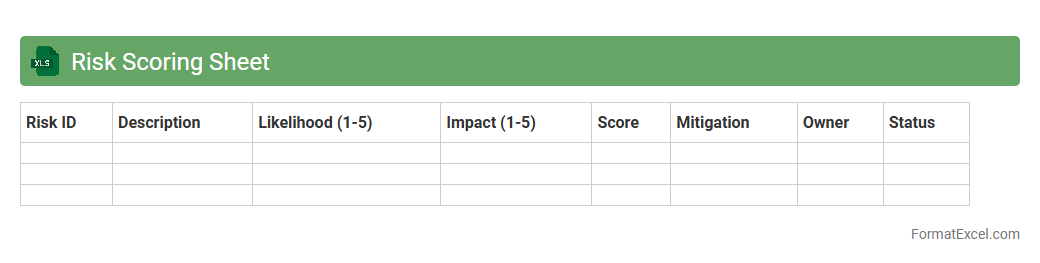
Risk Scoring Sheet
A
Risk Scoring Sheet Excel document is a tool designed to evaluate and prioritize potential risks by assigning scores based on factors such as probability, impact, and detection. This systematic approach helps organizations identify critical risk areas, enabling focused mitigation strategies and efficient resource allocation. Utilizing this sheet improves decision-making by providing clear, quantifiable risk data to drive proactive risk management.
Incident Tracking Log
An
Incident Tracking Log Excel document is a structured spreadsheet designed to systematically record and monitor incidents within an organization. It helps capture critical details such as date, description, severity, status, and resolution actions, enabling efficient incident management. This tool improves accountability, enhances communication among teams, and supports data-driven decision-making to prevent future occurrences.
Residual Risk Assessment
Residual Risk Assessment excel document is a structured tool designed to identify, evaluate, and quantify the risks remaining after implementing control measures. It helps organizations prioritize risk management efforts by providing clear insights into the
residual risk levels and the effectiveness of current mitigation strategies. This document is useful for enhancing decision-making, ensuring regulatory compliance, and improving overall safety and operational resilience.
Introduction to Risk Analysis in Excel
Risk analysis in Excel involves evaluating potential threats using spreadsheet tools to quantify and manage uncertainties. Excel's flexibility makes it an ideal platform for creating dynamic risk assessment models. Understanding how to utilize Excel for risk analysis enables proactive decision-making.
Importance of a Structured Risk Analysis Format
A structured risk analysis format ensures consistent, clear, and comprehensive evaluation of risks. It provides a systematic approach to identify, assess, and prioritize risks, enhancing overall risk management. This structure also facilitates communication among stakeholders.
Key Components of a Risk Analysis Template
Key components include risk identification, likelihood and impact scoring, risk priority calculation, and mitigation action plans. These elements work together to provide a full picture of potential risks and their severity. Integrating these components into a single template improves risk visualization and tracking.
Step-by-Step Guide to Setting Up the Risk Matrix
Create columns for risk description, likelihood, impact, and risk score. Use formulas to multiply likelihood by impact to generate a risk priority number. Finally, format the matrix with colors or symbols to represent different risk levels.
Identifying and Listing Potential Risks
Begin by brainstorming or researching potential risks relevant to your project or business. Document each risk clearly in Excel to establish a comprehensive risk register. This step forms the foundation for detailed risk evaluation.
Assigning Likelihood and Impact Scores
Assign numerical values to assess how likely each risk is to occur and its potential impact. These scores typically range on a scale of 1 to 5, facilitating quantification. Accurate scoring is critical for effective risk prioritization.
Calculating Risk Priority Numbers
Multiply the likelihood score by the impact score to determine the risk priority number (RPN). This calculation helps rank risks by severity and guides resource allocation. The RPN serves as a key metric in the risk assessment process.
Visualizing Risks with Excel Charts and Conditional Formatting
Use Excel's charting tools and conditional formatting to create color-coded risk matrices and dashboards. Visual aids highlight high-priority risks and trends at a glance. Effective visualization improves risk communication and decision-making.
Customizing Excel Templates for Industry-Specific Risks
Adapt the risk analysis template to include variables and risk types unique to your industry. This customization enhances relevance and accuracy in identifying key threats. Tailored templates support specialized risk management strategies.
Best Practices for Updating and Managing Risk Analysis in Excel
Regularly review and update risk data to reflect new information and changing conditions. Maintain version control and document changes to ensure transparency and consistency. Consistent management is essential for ongoing risk mitigation effectiveness.