ABC Inventory Categorization
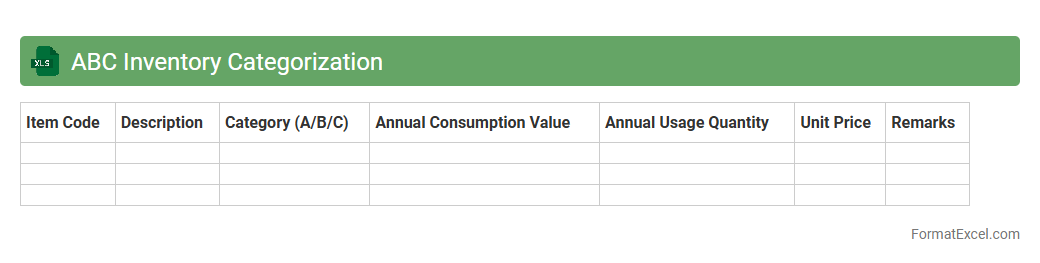
ABC Inventory Categorization is a powerful Excel document designed to classify inventory items based on their importance, typically categorized into A, B, and C classes according to value or usage frequency. This tool helps businesses prioritize inventory management by focusing on the most valuable
inventory items, reducing carrying costs and optimizing stock levels. Using ABC Inventory Categorization enhances decision-making, improves cash flow, and increases operational efficiency.
ABC Analysis Summary Table
The
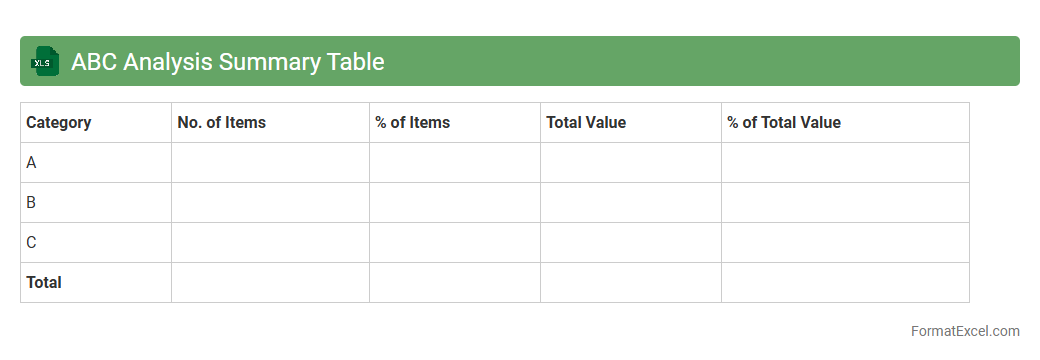
ABC Analysis Summary Table in Excel is a tool used to categorize inventory or items based on their importance, typically divided into three classes: A, B, and C, according to their value or contribution to overall sales. This classification helps businesses prioritize resources and focus on the most impactful items to optimize inventory management and improve decision-making. Using this summary table in Excel enables clear visualization of data, efficient tracking, and actionable insights to enhance operational efficiency and cost control.
Item Importance Ranking
The
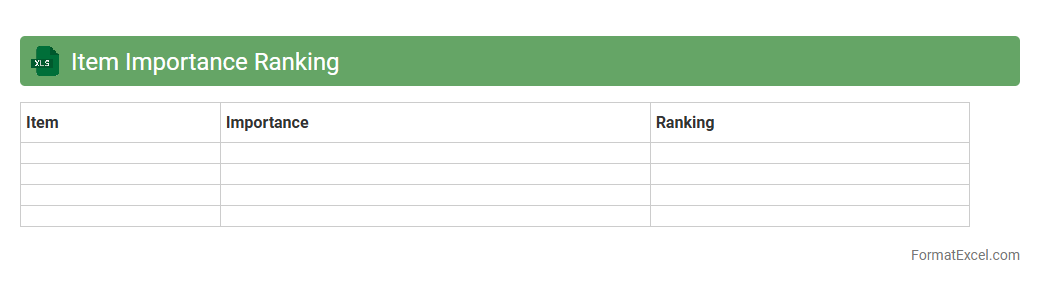
Item Importance Ranking Excel document is a powerful tool used to evaluate and prioritize items based on various criteria such as cost, demand, or impact. It helps organizations focus resources on the most critical items, improving inventory management and decision-making efficiency. By systematically ranking items, businesses can optimize procurement, reduce waste, and enhance overall operational productivity.
Inventory Value Segmentation
The
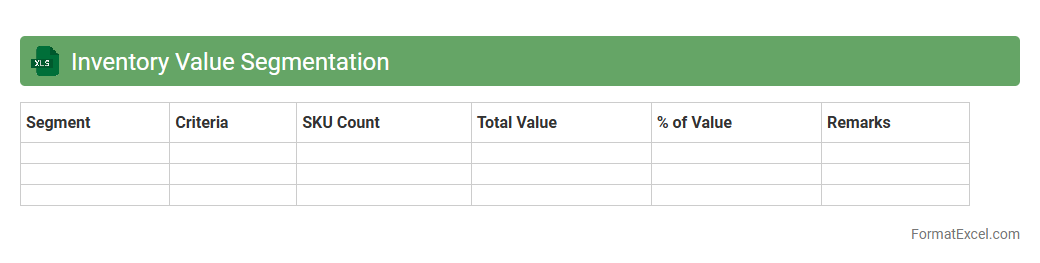
Inventory Value Segmentation Excel document categorizes inventory based on financial metrics such as cost, turnover rate, or sales value, enabling businesses to identify high-value and slow-moving stock. This segmentation helps optimize inventory management by focusing resources on profitable items, reducing holding costs, and improving cash flow. Using this tool, companies can make data-driven decisions to enhance supply chain efficiency and maximize profitability.
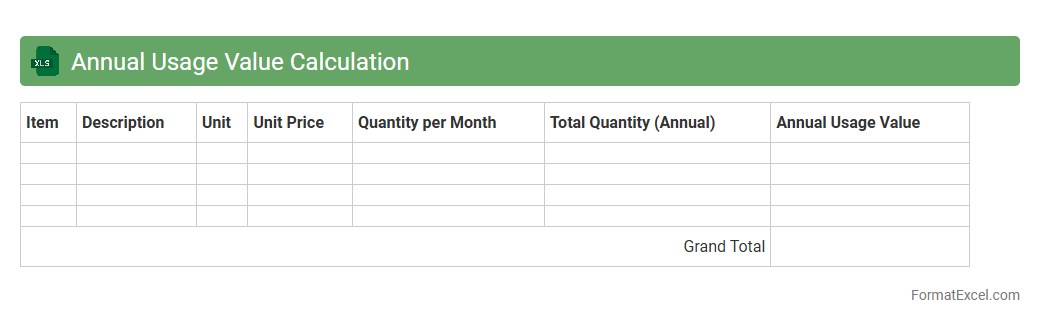
Annual Usage Value Calculation
The
Annual Usage Value Calculation Excel document is a tool designed to track and analyze the yearly consumption and cost of resources or products. It helps businesses and individuals forecast budgets, identify usage trends, and optimize purchasing decisions by providing clear, data-driven insights. Utilizing this spreadsheet enhances financial planning accuracy and supports efficient resource management throughout the fiscal year.
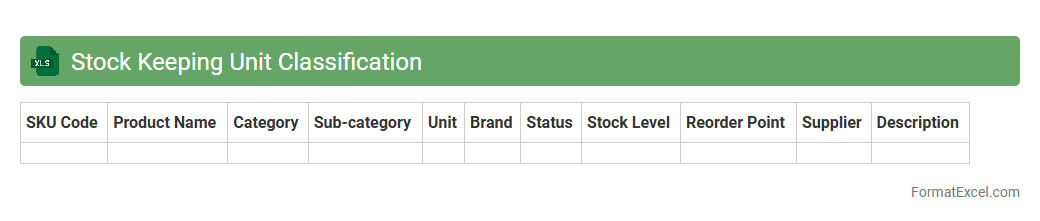
Stock Keeping Unit Classification
A
Stock Keeping Unit (SKU) Classification Excel document organizes product information by assigning unique identifiers to each item, facilitating efficient inventory management and sales tracking. It allows businesses to categorize products based on attributes like size, color, or type, enabling quick analysis and streamlined ordering processes. This tool improves accuracy in stock control, reduces errors, and enhances decision-making in supply chain management.
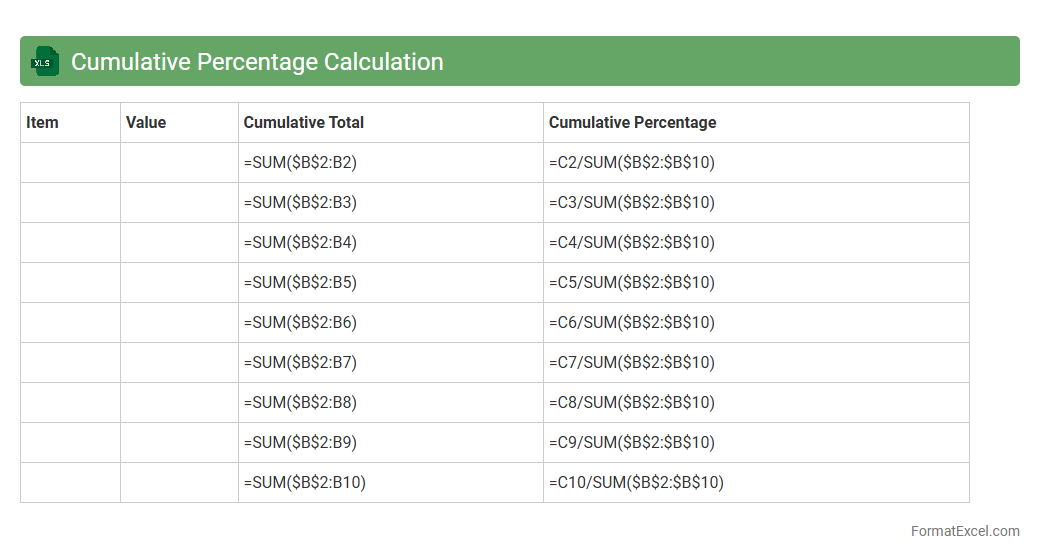
Cumulative Percentage Calculation
A
Cumulative Percentage Calculation Excel document tracks the running total of percentages, allowing users to visualize data distribution effectively. It is essential for identifying trends, analyzing proportions, and making data-driven decisions in business, finance, and research. This tool enhances clarity in large datasets by showing how individual values contribute to the overall total over time.
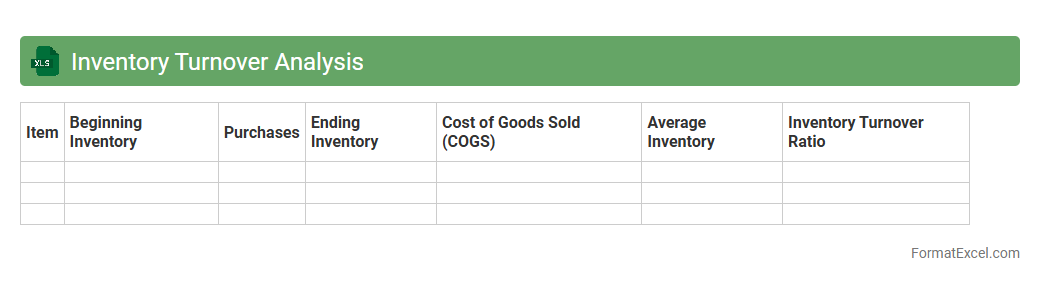
Inventory Turnover Analysis
Inventory Turnover Analysis Excel document is a powerful tool that calculates and visualizes the ratio of inventory sold and replaced over a specific period. It helps businesses monitor stock efficiency, optimize inventory levels, and reduce holding costs by identifying slow-moving and fast-moving items. Using this
inventory turnover analysis enables better demand forecasting and improves overall supply chain management.
SKU Prioritization Table
The
SKU Prioritization Table Excel document is a powerful tool used to rank and organize stock-keeping units based on factors such as sales performance, profit margins, and inventory levels. It helps businesses identify top-performing products and allocate resources effectively to maximize revenue and reduce excess inventory. By providing a clear visual hierarchy of SKUs, this table streamlines decision-making in product management and supply chain optimization.
Item Category Distribution
The
Item Category Distribution Excel document organizes products into specific categories, enabling efficient tracking and analysis of inventory across different segments. It facilitates better decision-making by providing insights into sales performance, stock levels, and demand patterns for each category. This tool helps optimize inventory management, improve supply chain efficiency, and increase overall business profitability.
Demand Frequency Segmentation
The
Demand Frequency Segmentation Excel document categorizes customers or products based on how often they make purchases or are requested within a specific time frame. This segmentation helps businesses identify high-frequency buyers and tailor marketing efforts, inventory management, and sales strategies accordingly. By analyzing demand patterns, companies can optimize resource allocation and improve customer retention.
Fast-Moving Items Identification
The
Fast-Moving Items Identification Excel document is a powerful tool designed to track and analyze inventory turnover rates, highlighting products with the highest sales frequency. This analysis enables businesses to optimize stock levels, reduce holding costs, and improve cash flow by focusing on items that generate quick revenue. Utilizing this document helps streamline inventory management, ensuring that supply meets demand efficiently while minimizing dead stock.
Slow-Moving Items List
The
Slow-Moving Items List Excel document is a spreadsheet that tracks inventory items with low sales velocity over a specific period. It helps businesses identify products that are not selling quickly, enabling strategic decisions on inventory management, such as discounting, repositioning, or discontinuing these items to optimize stock levels. This tool improves cash flow efficiency and reduces storage costs by focusing on high-turnover products.
Usage Value Pie Chart
The
Usage Value Pie Chart in an Excel document visually represents the proportionate usage or consumption of different categories, making it easier to analyze data distribution at a glance. It helps identify the largest contributors or consumers within a dataset, facilitating informed decision-making and resource allocation. By breaking down complex data into intuitive segments, it enhances reporting accuracy and supports strategic planning efforts.
Critical Stock Category
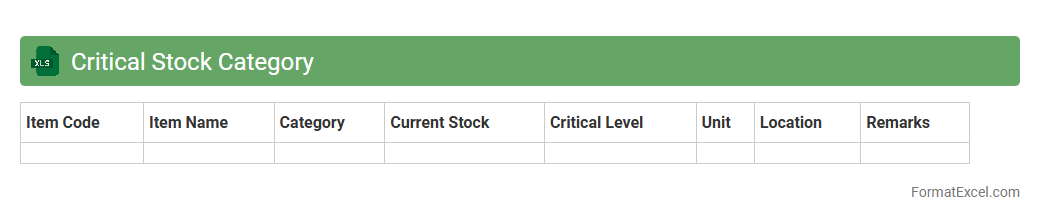
The
Critical Stock Category Excel document organizes and tracks essential inventory items that are vital for uninterrupted operations, helping businesses prioritize procurement and manage risks related to stock shortages. By categorizing high-impact materials based on consumption rates, lead times, and criticality, it enables efficient inventory control and reduces the chances of production delays. This tool supports data-driven decision-making, ensuring optimal stock levels and improving supply chain resilience.
Non-Critical Stock Category
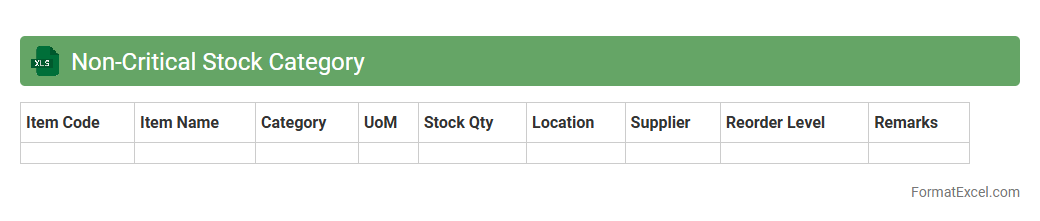
The
Non-Critical Stock Category Excel document organizes inventory items that have a lower impact on production or operations if depleted. It helps businesses maintain optimal stock levels by tracking quantities, reorder points, and usage patterns, thereby preventing overstocking and reducing carrying costs. This tool enhances inventory management efficiency, enabling better decision-making for procurement and ensuring smooth workflow without unnecessary capital tied up in excess stock.
Review Cycle Assignment
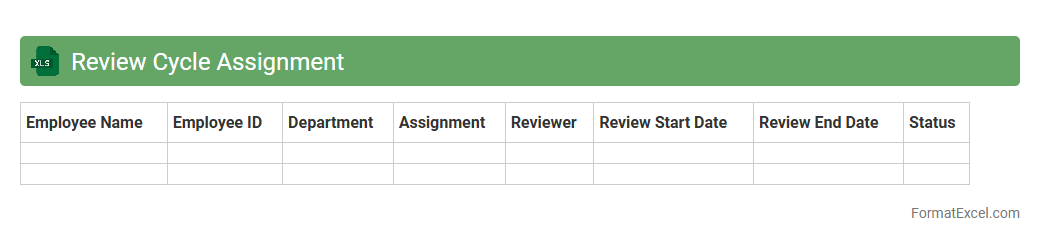
The
Review Cycle Assignment Excel document is a structured tool used to manage and track performance review schedules within organizations, helping to assign reviewers and reviewees systematically. It streamlines the review process by organizing timelines, ensuring timely feedback, and maintaining transparency and accountability among team members. This document enhances efficiency in performance management, supports better communication, and facilitates data-driven decision-making for employee development.
ABC Class Transition Matrix
The
ABC Class Transition Matrix Excel document is a tool used to track changes in product or customer classifications over time based on their value or importance. It helps businesses identify trends, manage inventory, and optimize resource allocation by showing how items move between A, B, and C categories. This matrix enables better decision-making by highlighting shifts in performance, demand, or profitability, enhancing strategic planning and operational efficiency.
Replenishment Priority List
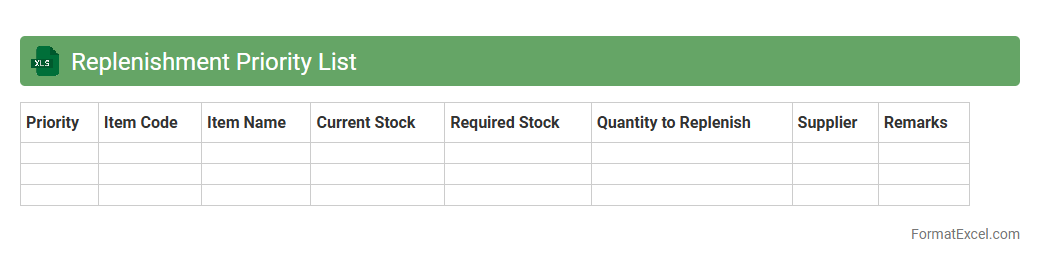
The
Replenishment Priority List Excel document is a dynamic tool used to organize and prioritize inventory restocking based on demand forecasts, sales velocity, and stock levels. It helps businesses streamline supply chain operations by highlighting the most critical items that require replenishment, ensuring optimal stock availability while minimizing overstock and stockouts. This document enhances decision-making efficiency, supports inventory management strategies, and ultimately improves overall operational productivity.
Supplier Performance by Class
The
Supplier Performance by Class Excel document tracks and evaluates suppliers' efficiency across various categories, providing detailed insights into delivery times, quality standards, and cost-effectiveness. This data helps identify top-performing suppliers and pinpoint areas needing improvement, enabling strategic decision-making and risk mitigation. Utilizing this document enhances procurement processes by optimizing supplier relationships and improving overall supply chain reliability.
Excess Stock Flagging
The
Excess Stock Flagging Excel document identifies inventory items that exceed optimal stock levels, enabling efficient inventory management. By highlighting surplus stock, it helps reduce carrying costs, minimize waste, and improve cash flow. This tool supports informed decision-making for purchasing and production planning, enhancing overall supply chain efficiency.
Out-of-Stock Risk Items
The
Out-of-Stock Risk Items Excel document serves as a critical tool for inventory management by identifying products that are at high risk of running out of stock. It helps businesses forecast demand fluctuations, monitor stock levels in real-time, and prioritize replenishment efforts to minimize sales losses and customer dissatisfaction. Utilizing this document enhances supply chain efficiency and supports informed decision-making to maintain optimal inventory balance.
Order Frequency by Class
The
Order Frequency by Class Excel document tracks how often orders are placed for different product classes, providing valuable insights into purchasing patterns and customer behavior. It helps businesses identify high-demand categories and optimize inventory management to meet market needs efficiently. Using this data, companies can tailor marketing strategies and improve supply chain operations, enhancing overall sales performance.
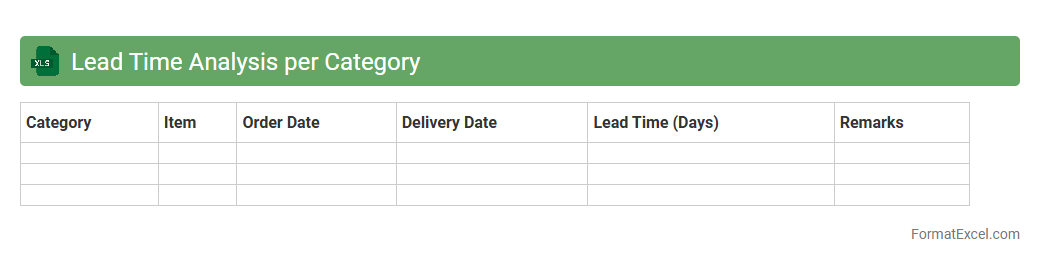
Lead Time Analysis per Category
Lead Time Analysis per Category Excel document provides a detailed breakdown of the average duration required for each product category from order placement to delivery. This
analysis helps businesses identify bottlenecks, optimize inventory management, and improve supply chain efficiency. Utilizing this data enables timely decision-making to enhance customer satisfaction and reduce operational costs.
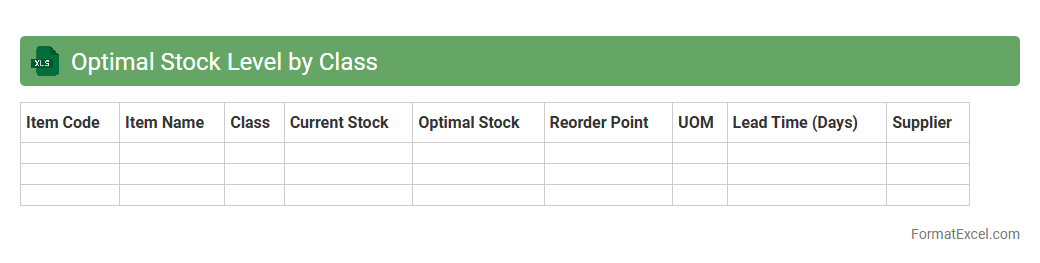
Optimal Stock Level by Class
The
Optimal Stock Level by Class Excel document helps businesses determine the ideal inventory quantities for different product categories based on sales history, demand variability, and lead times. This tool enables efficient inventory management by minimizing stockouts and overstocking, leading to improved cash flow and customer satisfaction. By analyzing class-specific data, companies can make informed decisions to optimize procurement and storage costs effectively.
Introduction to ABC Analysis Format in Excel
ABC Analysis is a method of categorizing inventory based on importance, typically using factors like value and frequency. Implementing this analysis in Excel allows for efficient sorting and management of large datasets. Excel provides a flexible platform to apply this classification seamlessly.
Key Concepts of ABC Analysis
ABC Analysis divides inventory into three classes: A, B, and C, with Class A representing the most valuable items. This classification helps prioritize focus and resources on high-impact inventory. Understanding these categories is crucial for effective inventory control and optimization.
Benefits of Using ABC Analysis in Excel
Using Excel for ABC Analysis simplifies data handling with formulas and built-in functions, saving time and reducing errors. It also enables dynamic updates and easy visualization of inventory status. Ultimately, it supports better decision-making through clear data representation.
Setting Up Your Data for ABC Analysis
Prepare your data by ensuring you have accurate records of item codes, quantities, and unit prices in Excel sheets. Organizing this data into clear columns forms the basis for applying ABC classification effectively. Proper data setup is essential to avoid errors during analysis.
Step-by-Step Guide to Creating an ABC Analysis in Excel
Begin by calculating the total value per item (quantity multiplied by unit price). Sort the data in descending order based on total value to identify key inventory items. Finally, use cumulative percentages to assign ABC categories accordingly.
Using Excel Formulas for ABC Classification
Excel formulas like SUMPRODUCT, IF, and VLOOKUP facilitate automated calculations and category assignments in ABC Analysis. For example, conditional formulas can dynamically assign Class A, B, or C based on thresholds. Mastering these formulas increases analysis efficiency.
Visualizing ABC Analysis Results with Charts
Charts such as Pareto graphs and pie charts help illustrate the proportion and impact of each inventory class vividly. Visual tools in Excel enhance understanding and make presentations more engaging. Clear visualization aids in highlighting critical inventory insights.
Common Mistakes in ABC Analysis and How to Avoid Them
Errors like inaccurate data entry, ignoring lead times, and inappropriate classification thresholds can mislead results. Regular data verification and well-defined criteria prevent these pitfalls. Awareness of common mistakes ensures more reliable outcomes.
Tips for Effective Inventory Management with ABC Analysis
Focus your control efforts on Class A items while maintaining reasonable stock for Classes B and C. Regularly update your ABC Analysis to reflect market changes and demand fluctuations. Strategic management based on ABC classification optimizes stock levels and reduces costs.
Downloadable ABC Analysis Excel Template
To simplify the process, you can download a ready-to-use ABC Analysis Excel template incorporating formulas and charts. This template accelerates setup and ensures consistent methodology. Using a template is a practical step toward proficient inventory analysis.