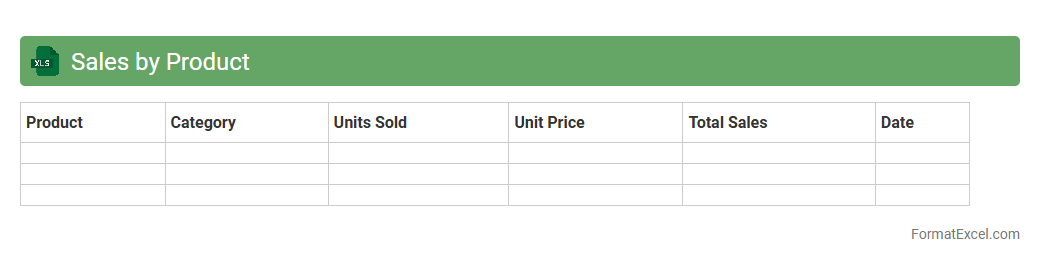
Sales by Product
The
Sales by Product Excel document organizes sales data by individual products, allowing businesses to track revenue, quantity sold, and profit margins for each item. This detailed breakdown helps identify best-selling products, optimize inventory management, and develop targeted marketing strategies. Access to clear product-level sales insights supports informed decision-making and enhances overall sales performance.
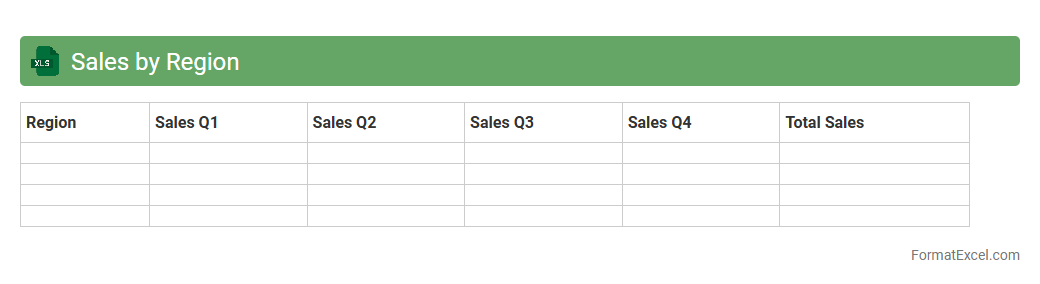
Sales by Region
The
Sales by Region Excel document is a structured spreadsheet that organizes sales data according to specific geographical areas, enabling businesses to analyze performance across different markets. It provides critical insights into regional sales trends, helping identify high-performing territories and areas requiring strategic improvements. Utilizing this document aids in making data-driven decisions to optimize resource allocation and boost overall revenue growth.
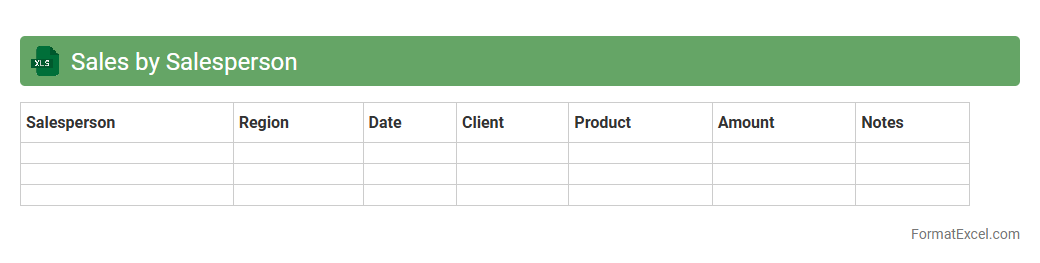
Sales by Salesperson
The
Sales by Salesperson Excel document is a structured spreadsheet that tracks individual sales performance, detailing metrics such as total sales, units sold, and revenue generated by each salesperson. It enables businesses to analyze productivity, identify top performers, and make informed decisions on incentives and training needs. Using this document improves sales forecasting accuracy and enhances overall team management efficiency.
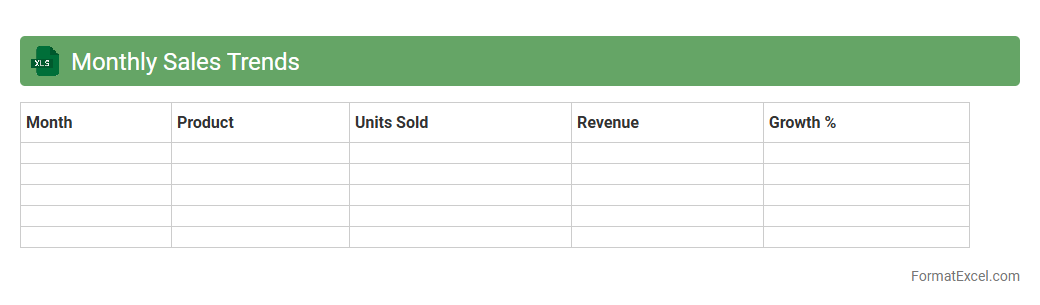
Monthly Sales Trends
The
Monthly Sales Trends Excel document tracks sales performance data over each month, highlighting patterns and fluctuations in revenue. It allows businesses to analyze product demand, seasonal variations, and customer purchasing behavior, enabling informed decision-making. By using this tool, companies can optimize inventory management, forecast future sales, and develop targeted marketing strategies to boost profitability.
Year-over-Year Sales Comparison
A
Year-over-Year Sales Comparison Excel document is a financial analysis tool that compares sales data from the same period across different years to identify trends and growth patterns. It helps businesses evaluate performance, measure seasonal impacts, and make informed decisions for future sales strategies. This document enables quick visualization of sales fluctuations and supports forecasting by highlighting changes in revenue over time.
Sales Growth Rate
A
Sales Growth Rate Excel document is a spreadsheet tool used to calculate and track the percentage increase or decrease in sales over specific periods. It helps businesses monitor performance trends, identify growth opportunities, and make data-driven decisions to enhance revenue strategies. By visualizing sales growth rates, companies can effectively analyze market dynamics and optimize sales planning.
Customer Segmentation
A
Customer Segmentation Excel document organizes customer data into distinct groups based on demographics, behavior, or purchasing patterns, enabling targeted marketing strategies. By analyzing segmented data, businesses can optimize product offerings, improve customer retention, and increase sales efficiency. This tool provides clear visualization and easy manipulation of data, making it essential for strategic decision-making and personalized marketing campaigns.
Sales by Channel
The
Sales by Channel Excel document is a detailed spreadsheet that organizes sales data according to various distribution channels such as online, in-store, and wholesale. This document allows businesses to identify performance trends, allocate resources efficiently, and optimize marketing strategies based on channel-specific revenue insights. Utilizing this data supports informed decision-making, driving increased sales and improving overall channel management effectiveness.
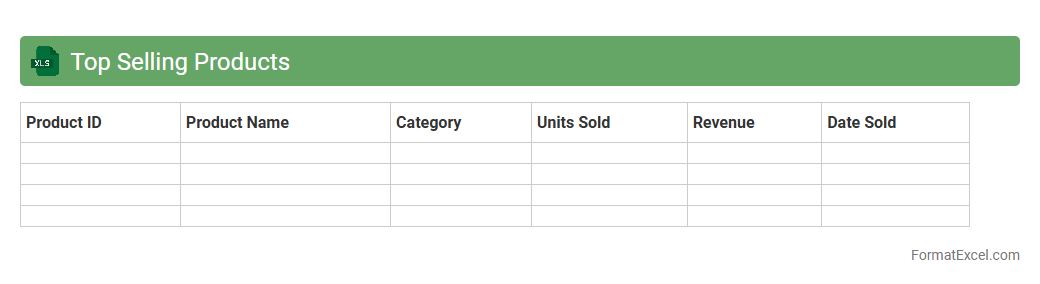
Top Selling Products
The
Top Selling Products Excel document is a detailed spreadsheet that tracks and analyzes the sales performance of various products over a specific period. It helps businesses identify high-demand items, monitor trends, and make data-driven decisions for inventory management and marketing strategies. By consolidating sales data into an organized format, this tool enhances visibility into product performance and supports strategic planning.
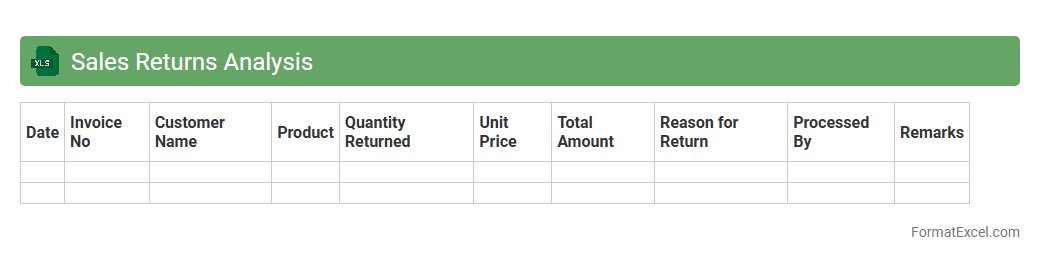
Sales Returns Analysis
Sales Returns Analysis Excel document is a powerful tool designed to track and evaluate returned products systematically. It helps businesses identify patterns in product returns, assess reasons behind customer dissatisfaction, and monitor financial impacts efficiently. Utilizing this
Sales Returns Analysis ensures improved inventory management and enhances decision-making for reducing future returns.
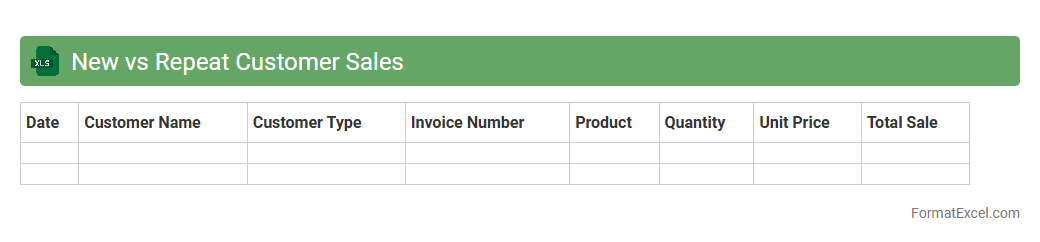
New vs Repeat Customer Sales
The
New vs Repeat Customer Sales Excel document tracks and compares sales data between first-time buyers and returning customers, providing insights into customer loyalty and acquisition effectiveness. It helps businesses identify trends, measure marketing campaign success, and allocate resources strategically to maximize revenue growth. By analyzing this data, companies can optimize customer retention strategies and improve targeted sales approaches.
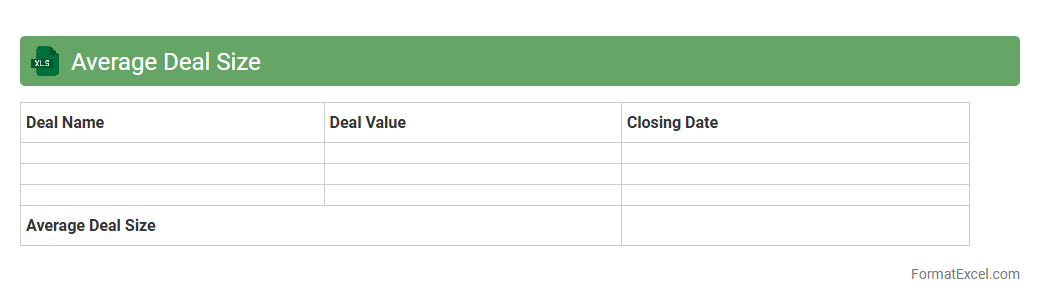
Average Deal Size
An
Average Deal Size Excel document calculates the mean value of sales transactions over a specific period, providing insights into the typical revenue generated per deal. This tool helps businesses evaluate sales performance, identify trends, and set realistic targets by analyzing customer purchasing behavior. Utilizing such data enhances strategic decision-making and optimizes sales forecasting accuracy.
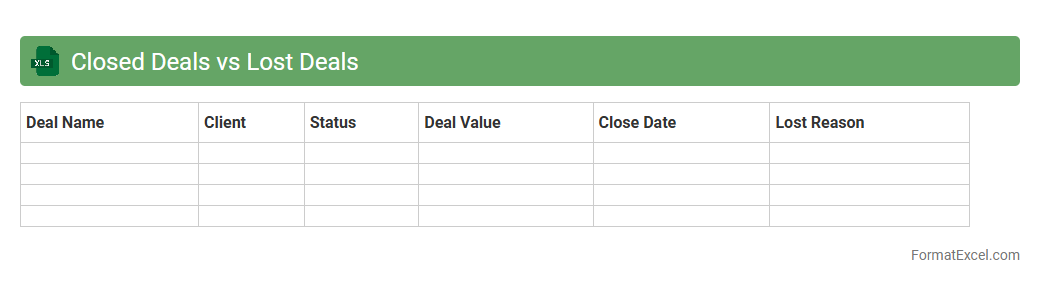
Closed Deals vs Lost Deals
The
Closed Deals vs Lost Deals Excel document tracks and compares successful sales against missed opportunities, providing valuable insight into sales performance. It enables sales teams to analyze trends, identify strengths, and uncover reasons behind lost deals, facilitating data-driven strategies for improvement. This document enhances forecasting accuracy and supports strategic decision-making to boost overall revenue growth.
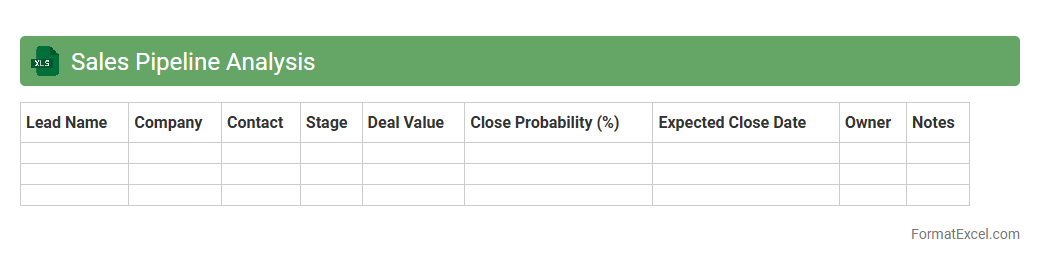
Sales Pipeline Analysis
A
Sales Pipeline Analysis Excel document organizes and tracks potential sales opportunities through various stages, from lead generation to closing deals. It allows businesses to visualize the progression of prospects, identify bottlenecks, and forecast future revenue with greater accuracy. Utilizing this tool optimizes sales strategies, improves team performance, and enhances decision-making based on real-time data insights.
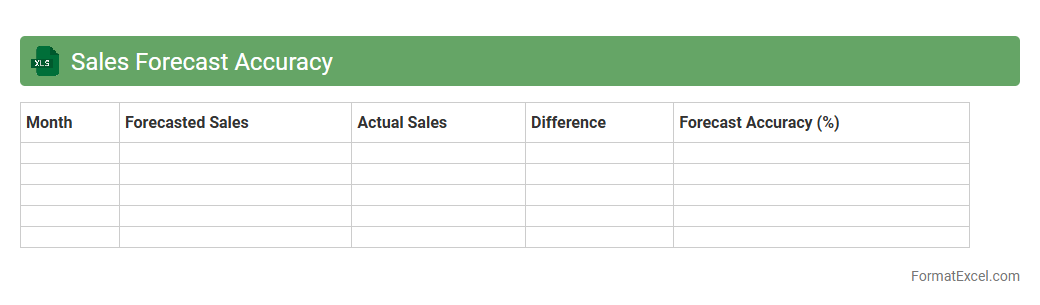
Sales Forecast Accuracy
A
Sales Forecast Accuracy Excel document is a tool designed to compare predicted sales with actual sales data, helping businesses measure the precision of their sales forecasts. It enables organizations to identify trends, adjust sales strategies, and improve inventory management by providing clear insights into forecast errors and variances. This document supports data-driven decision-making, boosting overall sales performance and operational efficiency.
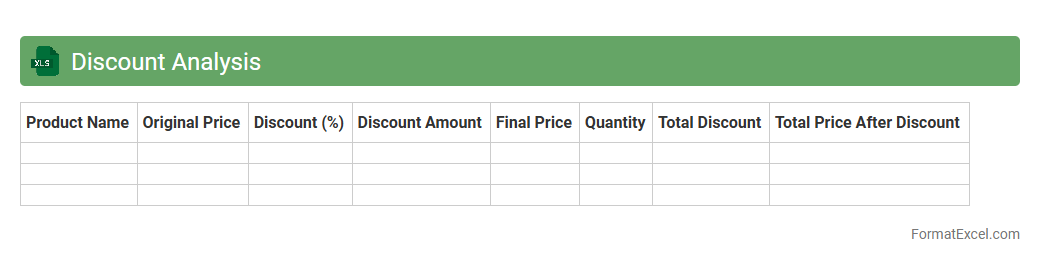
Discount Analysis
A
Discount Analysis Excel document is a powerful tool designed to evaluate and compare various discount offers, allowing businesses to optimize pricing strategies and maximize profit margins. By systematically organizing discount rates, product prices, and sales data, it provides clear insights into the financial impact of each discount tier. This analysis helps in making informed decisions, improving customer segmentation, and enhancing overall revenue management.
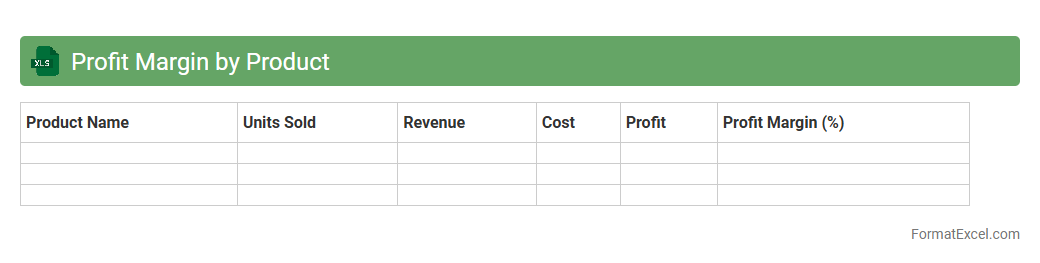
Profit Margin by Product
The
Profit Margin by Product Excel document calculates the profitability percentage for each product by comparing sales revenue against the cost of goods sold. This tool helps businesses identify high-performing products and optimize pricing strategies to maximize overall profitability. Utilizing detailed profit margin data supports informed decision-making in inventory management and marketing investments.
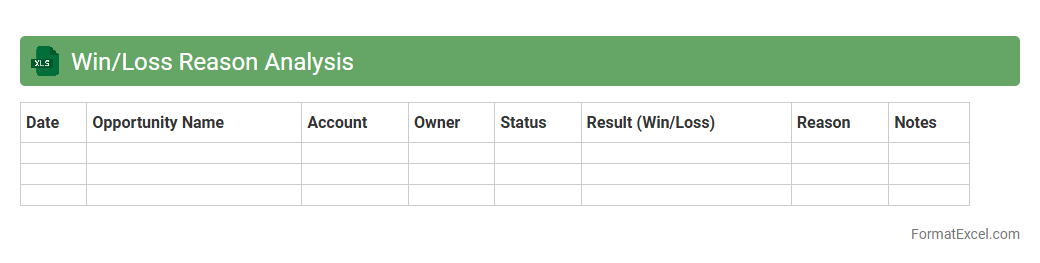
Win/Loss Reason Analysis
Win/Loss Reason Analysis Excel document is a structured tool designed to track and analyze the factors behind successful or unsuccessful sales outcomes. This document helps businesses identify patterns and key drivers by categorizing reasons for wins and losses, enabling more informed decision-making. Using this analysis, companies can optimize sales strategies, improve customer engagement, and increase
revenue growth through data-driven insights.
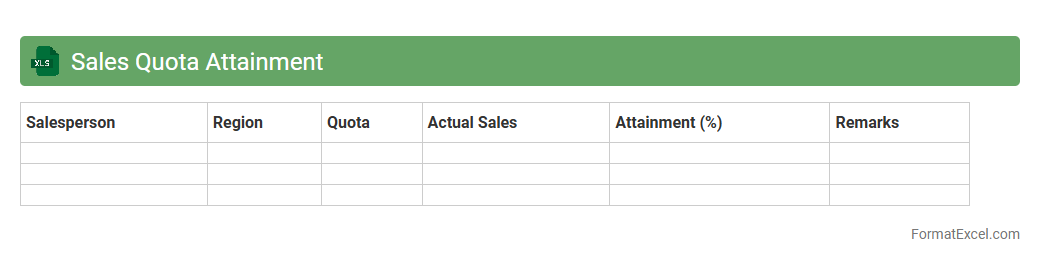
Sales Quota Attainment
A
Sales Quota Attainment Excel document tracks the progress of sales representatives toward meeting their assigned targets, allowing managers to quickly assess individual and team performance. By organizing sales data, targets, and actual achievements, it facilitates data-driven decisions to improve sales strategies and forecast future revenue. This tool enhances accountability and motivates sales staff by providing clear visibility of quota status and performance trends.
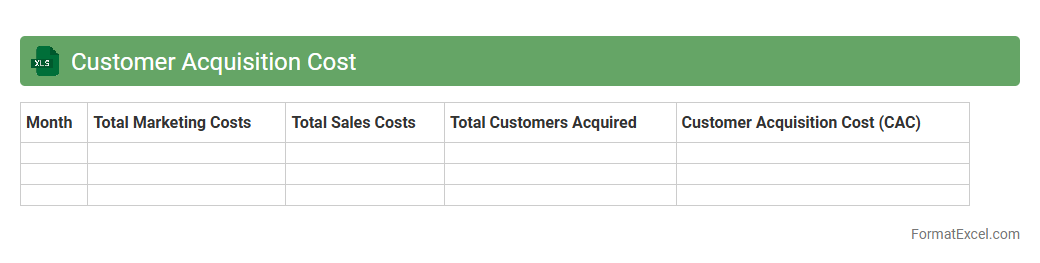
Customer Acquisition Cost
A
Customer Acquisition Cost (CAC) Excel document is a spreadsheet designed to track and analyze the total expenses involved in gaining a new customer. It helps businesses visualize marketing, sales, and operational costs to calculate the average cost per acquisition, allowing informed budgeting and strategy adjustments. By using this tool, companies can optimize spending, improve ROI, and enhance overall growth efficiency.
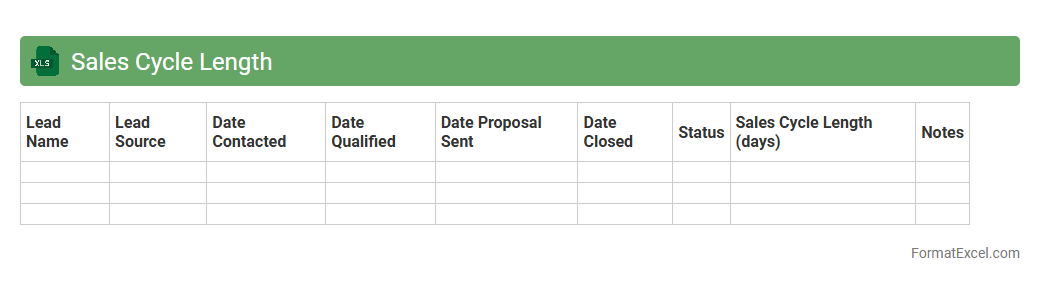
Sales Cycle Length
A
Sales Cycle Length Excel document tracks the duration of each stage in the sales process, from initial contact to closing the deal. This tool helps sales teams identify bottlenecks, forecast revenue accurately, and improve overall sales efficiency by analyzing patterns and timelines. Using this document enables businesses to optimize strategies, reduce sales cycle time, and increase conversion rates.
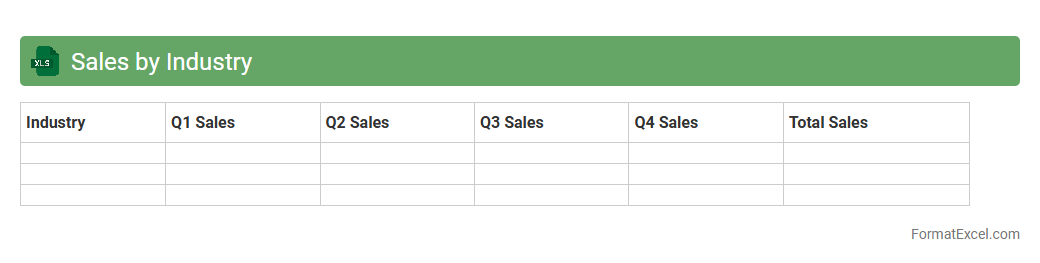
Sales by Industry
The
Sales by Industry Excel document is a structured spreadsheet that categorizes and analyzes sales data across various industry sectors, enabling businesses to identify trends and performance metrics specific to each industry. It is useful for strategic decision-making, helping organizations allocate resources effectively, forecast sales, and tailor marketing efforts to maximize revenue in targeted sectors. With detailed breakdowns and visualizations, it enhances data-driven insights and supports competitive market analysis.
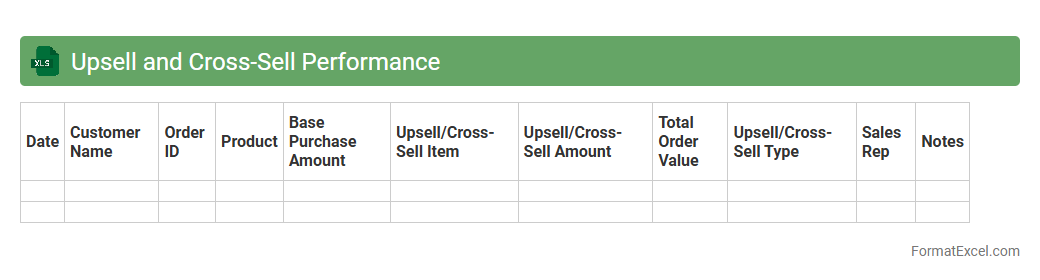
Upsell and Cross-Sell Performance
The
Upsell and Cross-Sell Performance Excel document tracks sales metrics related to customer purchasing behaviors, highlighting opportunities for boosting revenue through additional or complementary product sales. It consolidates data such as transaction volumes, average order values, and customer segmentation to identify high-potential targets for upselling and cross-selling strategies. This tool enables businesses to optimize marketing efforts, improve sales efficiency, and maximize profit margins by making data-driven decisions.
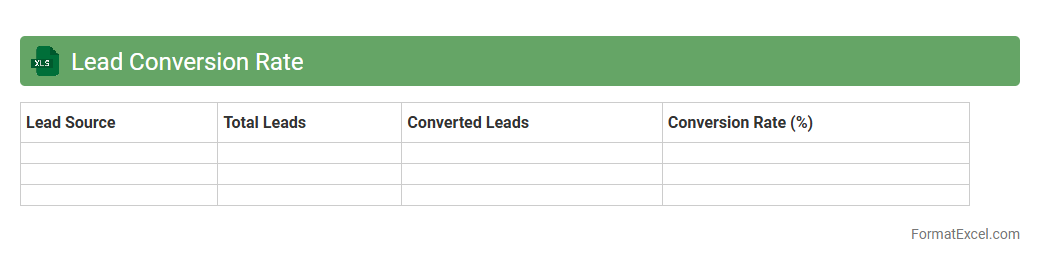
Lead Conversion Rate
The
Lead Conversion Rate Excel document is a tool designed to track and analyze the percentage of leads that turn into paying customers, helping businesses measure the effectiveness of their sales and marketing efforts. It organizes data on lead sources, interactions, and outcomes, enabling clear visualization of conversion trends over time. This document supports data-driven decision-making by pinpointing strengths and weaknesses in the sales funnel, ultimately improving revenue generation strategies.
Inventory Turnover
An
Inventory Turnover Excel document tracks how efficiently a company sells and replaces its stock within a given period, calculating the ratio between cost of goods sold and average inventory. This metric helps businesses identify slow-moving products, optimize inventory levels, and improve cash flow management. By using this tool, companies can make data-driven decisions to reduce holding costs and increase overall operational efficiency.
Introduction to Sales Analysis in Excel
Sales analysis in Excel involves using spreadsheet tools to organize, calculate, and interpret sales data for better business decisions. Excel offers versatile features like formulas, charts, and pivot tables that enhance data insights. Understanding how to set up and analyze sales data is vital for any business looking to optimize revenue.
Key Components of a Sales Analysis Format
The core components include sales data input, calculation formulas, and visual summaries. Accurate data entry, structured layout, and summary metrics enable meaningful analysis. Integrating these aspects in Excel enables efficient tracking and evaluation of sales performance.
Setting Up Your Sales Data Sheet
Begin by structuring a worksheet with rows representing individual sales transactions and columns capturing essential details. The sheet should be easy to navigate with consistent data formats for accuracy. A well-organized data sheet forms the foundation for effective sales analysis.
Essential Columns for Sales Tracking
Important columns include Date, Product Name, Quantity Sold, Unit Price, Discounts, and Total Sales Amount. Incorporating customer or region information can add depth to your analysis. Defining these essential columns ensures comprehensive tracking of sales activities.
Using Excel Formulas for Sales Calculation
Excel formulas like SUM, IF, and VLOOKUP help calculate totals, apply discounts, and cross-reference data efficiently. Utilizing these functions automates computations and reduces errors in sales reports. Mastery of Excel formulas is crucial for accurate sales analysis.
Visualizing Sales Data with Charts & Graphs
Graphs such as bar charts, line charts, and pie charts succinctly present trends and patterns in sales data. Visualization aids in quick understanding and decision-making by highlighting key metrics. Effective use of charts and graphs brings your sales data to life.
Creating Pivot Tables for Deep Analysis
Pivot tables allow you to summarize and analyze large datasets by quickly reorganizing and filtering information. They are invaluable for uncovering insights like top-selling products and sales by region. Learning to build pivot tables elevates your data analysis capabilities.
Automating Sales Reports with Excel Tools
Features such as macros, Power Query, and scheduled updates automate repetitive tasks and streamline report generation. Automation saves time and ensures consistency in sales reporting. Implementing automated sales reports enhances efficiency and accuracy.
Best Practices for Sales Data Formatting
Maintain consistent data entry, use clear headers, and apply conditional formatting to highlight important trends. Proper formatting improves readability and reduces data errors. Adhering to best practices in data formatting ensures reliable and professional sales reports.
Downloadable Sales Analysis Excel Template
Pre-designed Excel templates offer a ready-to-use framework with built-in formulas and charts for quick sales analysis. Utilizing a trusted sales analysis template can jumpstart your reporting and save setup time. Many templates also provide customizable options to fit specific business needs.