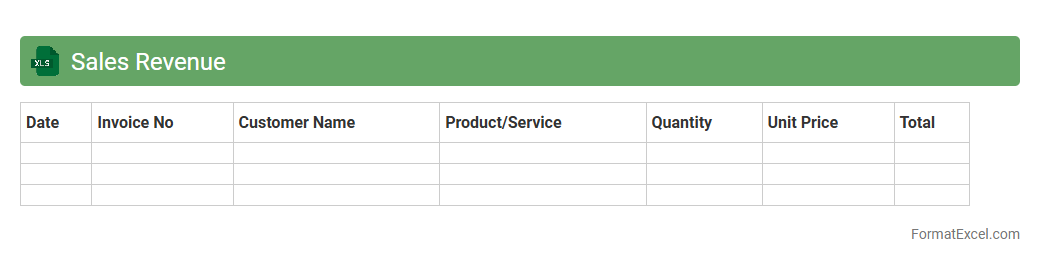
Sales Revenue
A
Sales Revenue Excel document is a spreadsheet designed to track, calculate, and analyze a company's revenue generated from sales activities over specific periods. It helps businesses organize sales data, monitor performance metrics, and identify trends that support strategic decision-making. Using this document improves accuracy in financial reporting and enhances forecasting capabilities for better business growth.
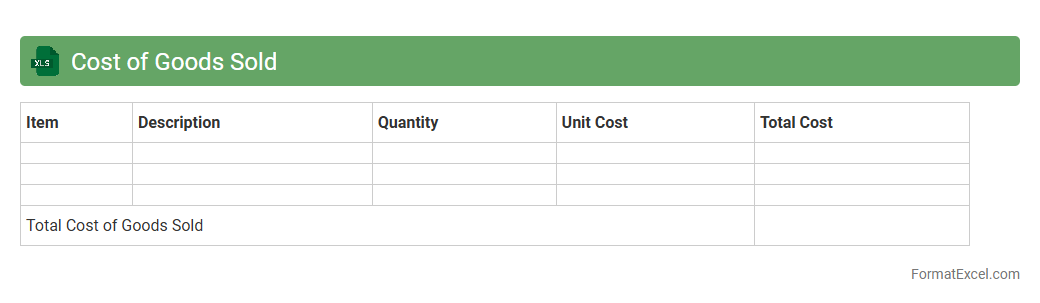
Cost of Goods Sold
A
Cost of Goods Sold (COGS) Excel document is a spreadsheet tool designed to calculate and track the direct costs associated with producing goods sold by a business, including raw materials, labor, and manufacturing expenses. It helps businesses accurately determine gross profit by subtracting COGS from total revenue, enabling better financial analysis and inventory management. Utilizing this document improves budgeting, pricing strategies, and overall financial planning by providing clear, organized insights into production costs.
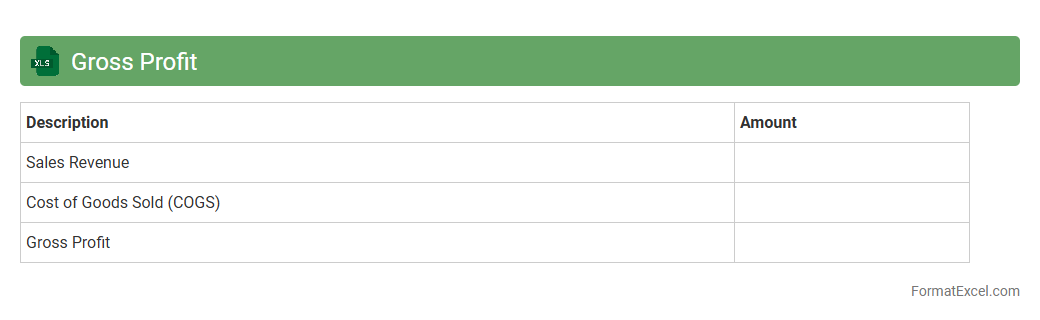
Gross Profit
A
Gross Profit Excel document is a financial tool designed to calculate and track the difference between total sales revenue and the cost of goods sold (COGS). It helps businesses analyze profitability, monitor performance over time, and make informed decisions regarding pricing, expenses, and inventory management. By using this document, companies gain clear insights into their financial health and operational efficiency.
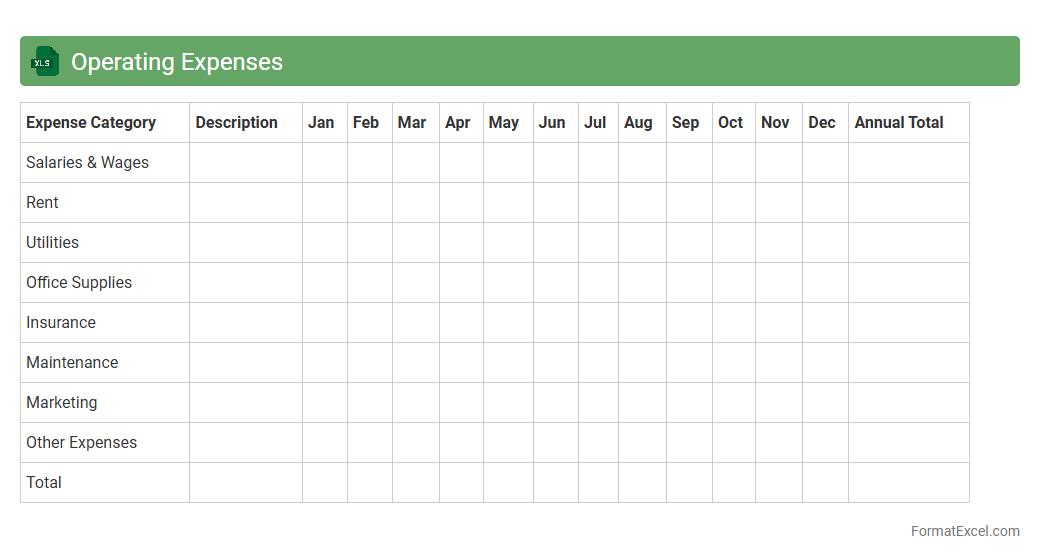
Operating Expenses
An
Operating Expenses Excel document is a detailed spreadsheet used to track and manage a company's day-to-day costs such as rent, utilities, salaries, and supplies. It provides clear visibility into business expenditure patterns, enabling effective budgeting and financial planning. By analyzing this document, organizations can identify cost-saving opportunities and improve overall profitability.
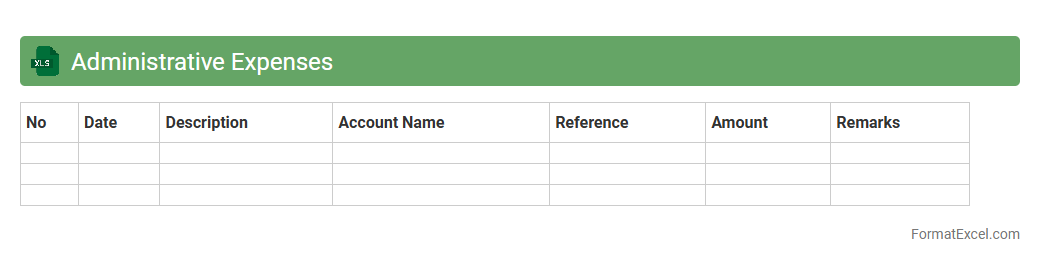
Administrative Expenses
An
Administrative Expenses Excel document is a structured spreadsheet used to track and manage costs related to the general operation of a business, including salaries, office supplies, and utilities. It enables organizations to monitor spending patterns, create budgets, and prepare financial reports with precision and efficiency. This tool supports informed decision-making by providing a clear overview of overhead costs and helping optimize resource allocation.
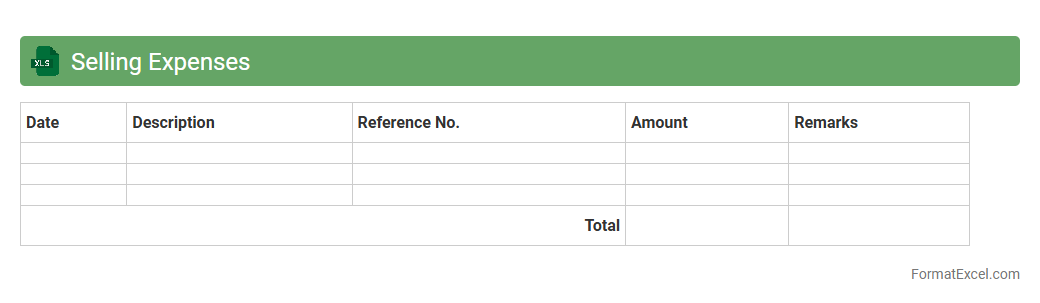
Selling Expenses
A
Selling Expenses Excel document is a financial tool designed to track and analyze all costs associated with the sales process, such as advertising, commissions, and shipping fees. It helps businesses maintain accurate records, control budgeting, and identify cost-saving opportunities within sales operations. Using this document streamlines financial reporting and enhances decision-making by providing clear visibility into selling expense patterns.
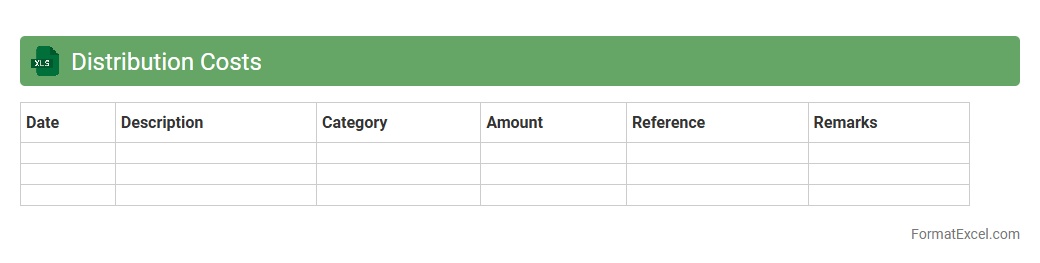
Distribution Costs
The
Distribution Costs Excel document is a detailed spreadsheet designed to track and analyze expenses related to the distribution of goods, including transportation, warehousing, and logistics services. It helps businesses optimize budget management by providing clear insights into cost patterns, enabling more accurate forecasting and reducing unnecessary expenditures. Utilizing this tool improves supply chain efficiency and supports strategic decision-making for cost control and profit maximization.
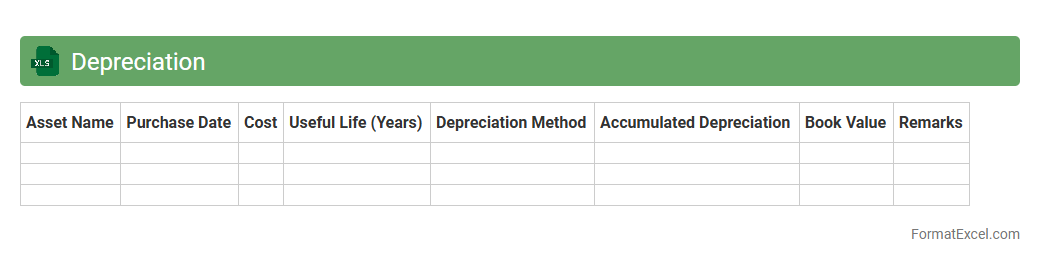
Depreciation
A
Depreciation Excel document is a spreadsheet designed to calculate and track the depreciation of assets over time, using methods such as straight-line, declining balance, or units of production. It helps businesses accurately account for asset value reduction, improving financial reporting and tax compliance. By automating depreciation schedules, this tool enhances budgeting, asset management, and decision-making processes.
Other Operating Income
The
Other Operating Income Excel document is a financial tool used to record and analyze non-primary revenue streams such as rental income, royalties, or gains from asset sales. It provides clear visibility into additional income sources that supplement core business operations, enabling accurate financial reporting and strategic decision-making. This document helps businesses assess profitability beyond main sales and optimize resource allocation by tracking diverse income channels.
Operating Profit
An
Operating Profit Excel document is a financial tool designed to calculate and analyze a company's operating income by subtracting operating expenses from gross profit. This document helps businesses track profitability from core operations, excluding non-operating income and expenses, thus providing clear insight into operational efficiency. By using this Excel sheet, companies can identify cost-saving opportunities and make informed decisions to improve overall financial performance.
Interest Income
An
Interest Income Excel document is a structured spreadsheet that tracks and calculates interest earned from various financial accounts such as savings, bonds, or loans. This tool enables precise monitoring of income streams, aids in financial planning, and ensures accurate reporting for tax purposes. Utilizing this document improves budgeting, helps identify trends in earnings, and supports informed investment decisions.
Interest Expenses
An
Interest Expenses Excel document is a financial tool designed to track and calculate the cost of borrowed funds over a specific period. It helps businesses and individuals monitor their loan interest payments, budget effectively, and analyze the impact of interest costs on overall profitability. Utilizing this document improves financial planning accuracy and supports informed decision-making regarding debt management.
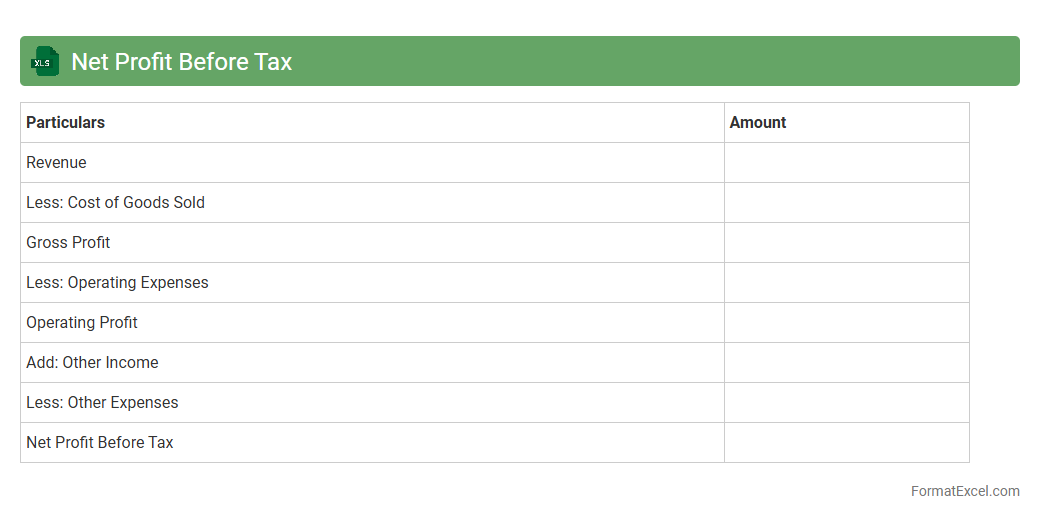
Net Profit Before Tax
The
Net Profit Before Tax Excel document is a financial tool that calculates a company's earnings after deducting operating expenses but before tax liabilities are applied. It enables businesses to analyze profitability trends, control costs, and make informed decisions regarding investments and budgeting. By clearly displaying key financial metrics, it enhances transparency and supports strategic planning.
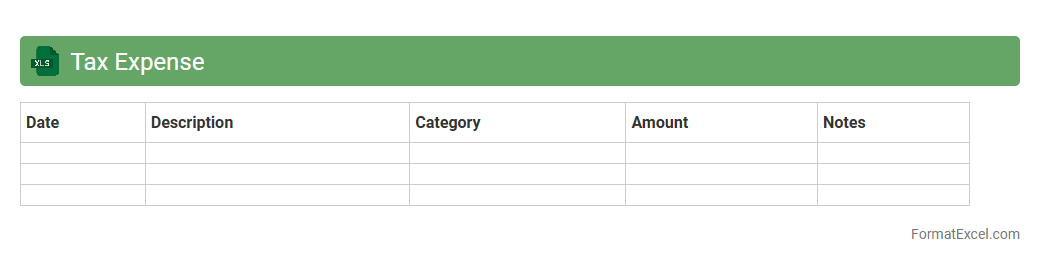
Tax Expense
A
Tax Expense Excel document is a spreadsheet designed to track, calculate, and analyze tax liabilities based on financial data. It helps businesses and individuals accurately estimate the taxes owed by organizing income, deductions, and tax rates in a clear, automated format. Utilizing this document improves tax planning, ensures compliance, and simplifies the preparation process for tax filing.
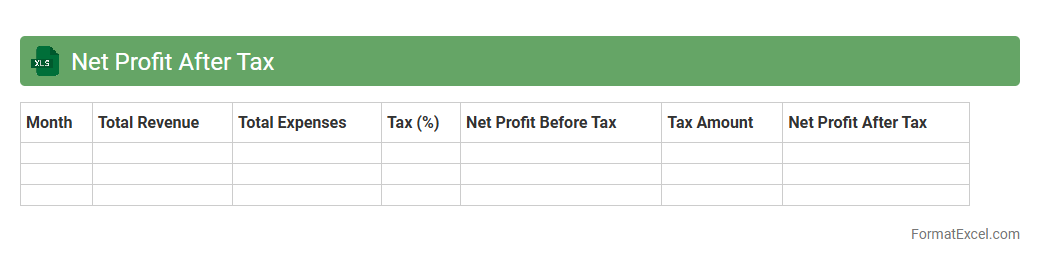
Net Profit After Tax
A
Net Profit After Tax (NPAT) Excel document calculates a company's net earnings after deducting all expenses and taxes, providing a clear view of actual profitability. This tool helps businesses analyze financial performance, make informed budgeting decisions, and forecast future growth accurately. By organizing data efficiently, it simplifies complex accounting processes and supports strategic financial planning.
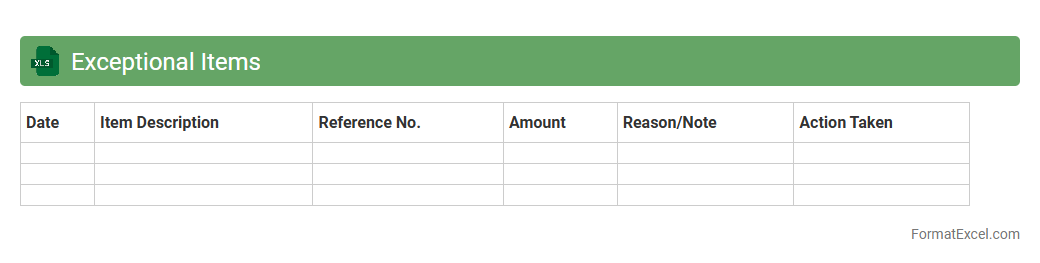
Exceptional Items
An
Exceptional Items Excel document is a specialized spreadsheet designed to track and analyze unusual or non-recurring financial transactions that fall outside regular business operations. It enables accurate financial reporting by isolating these items, thereby improving transparency and decision-making for accountants and management. This document is useful for identifying trends, preparing audit reports, and ensuring compliance with accounting standards.
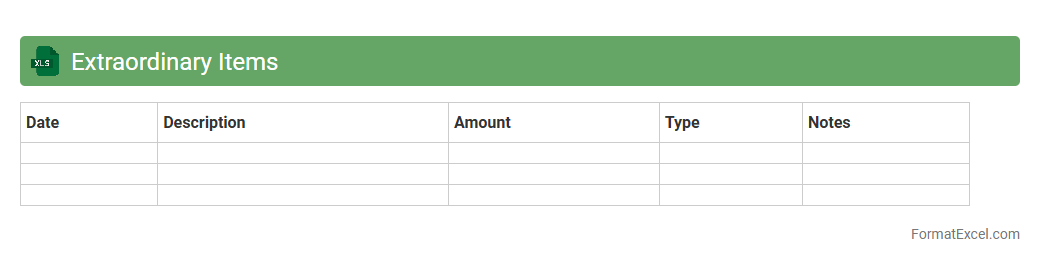
Extraordinary Items
An
Extraordinary Items Excel document is a specialized spreadsheet designed to record and analyze unusual financial transactions that are infrequent and non-recurring, such as natural disaster losses or major asset write-offs. This tool helps businesses clearly separate extraordinary items from regular operational expenses, enhancing the accuracy of financial reporting and decision-making. It facilitates better transparency for stakeholders and improves forecasting by isolating the impact of these exceptional events on overall financial performance.
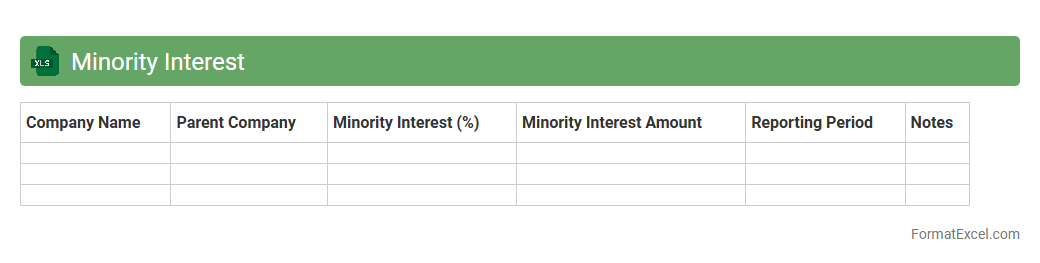
Minority Interest
A
Minority Interest Excel document tracks the portion of a subsidiary's equity not owned by the parent company, providing clear visibility into non-controlling interests in consolidated financial statements. It helps in accurately calculating the parent company's net income attributable to shareholders and assists in financial analysis, reporting, and decision-making processes. This document is essential for investors and analysts to assess the true value and ownership distribution within corporate structures.
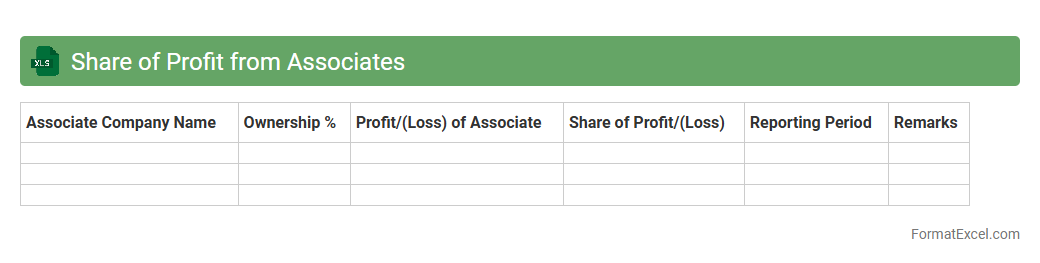
Share of Profit from Associates
The
Share of Profit from Associates Excel document records the proportionate profit earned from investments in associate companies, reflecting the investor's ownership stake. This tool helps track financial performance, manage investment returns, and supports accurate consolidation of accounts under equity accounting standards. Utilizing this document enhances decision-making by providing clear insights into profitability contributions from associate entities.
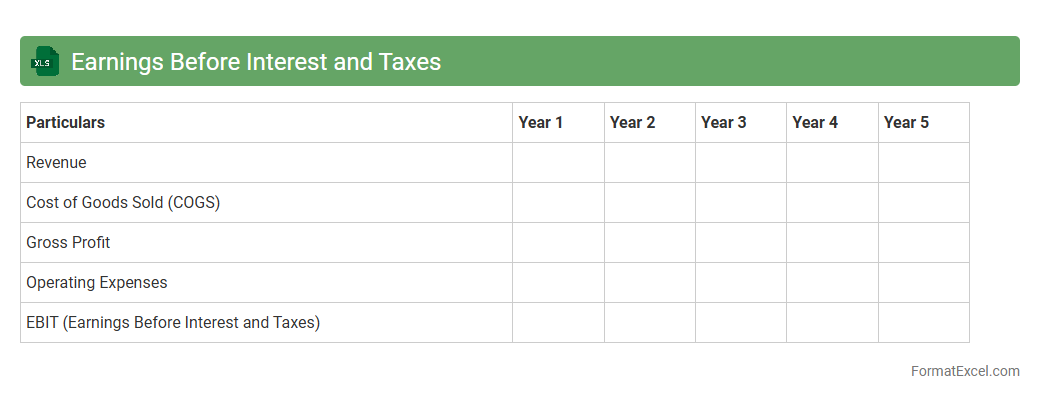
Earnings Before Interest and Taxes
An
Earnings Before Interest and Taxes (EBIT) Excel document is a financial tool used to calculate and analyze a company's operating profit by excluding interest and tax expenses. It helps businesses assess core profitability and operational efficiency without the influence of financing and tax structures. This document is essential for financial planning, benchmarking performance, and making informed investment decisions.
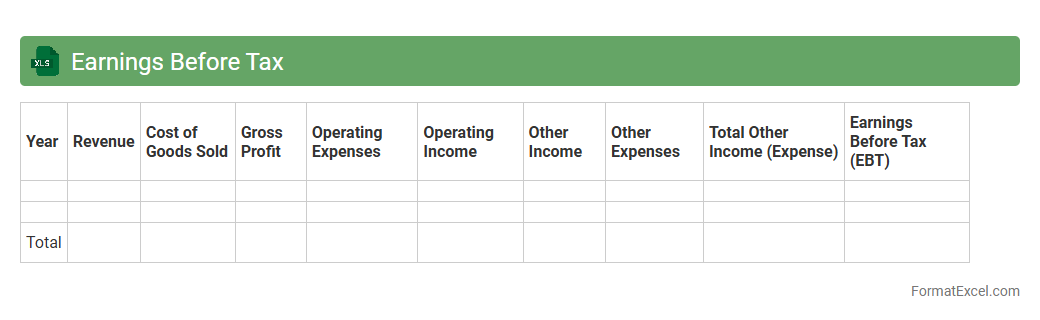
Earnings Before Tax
The
Earnings Before Tax (EBT) Excel document is a financial analysis tool designed to calculate a company's profitability before tax expenses are deducted. It helps businesses and investors assess operational performance by isolating earnings from tax impacts. Utilizing this document enables accurate forecasting, budgeting, and strategic decision-making by providing clear insights into pre-tax income trends.
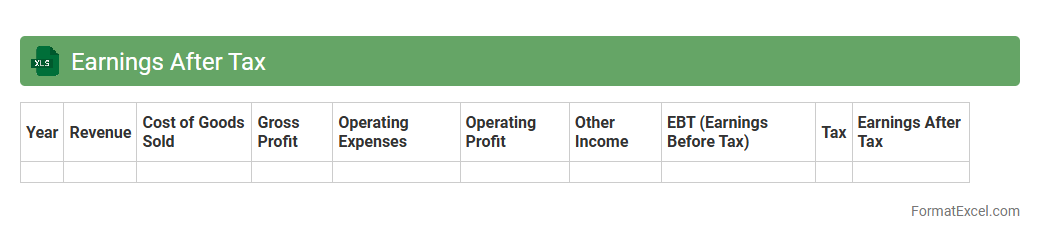
Earnings After Tax
An
Earnings After Tax (EAT) Excel document calculates a company's net profit after deducting all taxes, providing a clear view of profitability. It helps businesses and investors assess financial performance and make informed decisions regarding investments, budgeting, and tax planning. By organizing data systematically, this Excel tool streamlines financial analysis and enhances accuracy in reporting earnings.
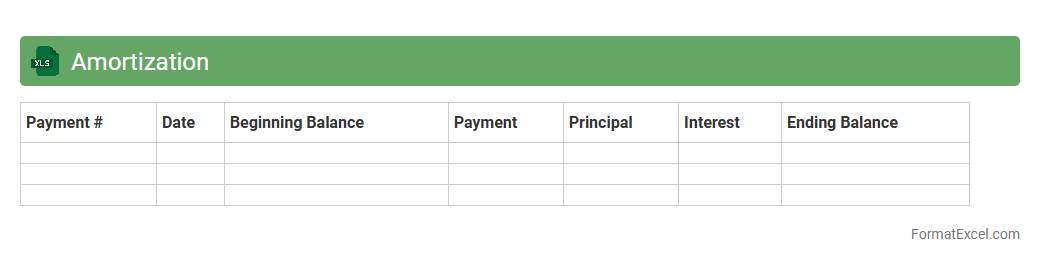
Amortization
An
Amortization Excel document is a spreadsheet tool designed to calculate loan payments, interest, and principal over time, allowing users to visualize the repayment schedule clearly. It helps in managing finances by providing detailed insights into how each payment affects the outstanding loan balance and interest accrued. This document is essential for budgeting, financial planning, and making informed decisions regarding loans and mortgages.
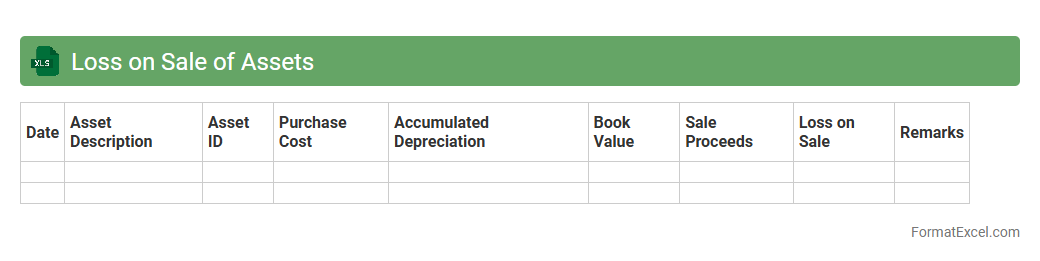
Loss on Sale of Assets
A
Loss on Sale of Assets Excel document tracks the financial impact when an asset is sold for less than its book value, calculating the resulting loss accurately. This tool helps businesses maintain precise financial statements by documenting the discrepancy between asset sale proceeds and carrying amount. It is invaluable for accounting teams to analyze transactions, ensure compliance with accounting standards, and inform strategic decisions on asset management.
Dividends Received
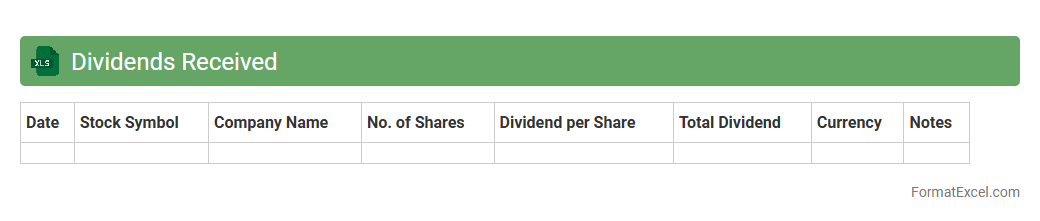
The
Dividends Received Excel document is a financial tracking tool that records dividend payments from various investments, helping users monitor income streams efficiently. It organizes data such as payment dates, amounts, and sources, enabling easy calculation of total dividends over time. This document is useful for investors to analyze portfolio performance, plan taxes, and make informed decisions about reinvestment or asset allocation.
Introduction to Profit and Loss Account
The Profit and Loss Account summarizes a company's revenues, costs, and expenses over a specific period. It shows the net profit or loss to help stakeholders understand financial performance. This statement is crucial for assessing business viability and making informed decisions.
Importance of P&L Accounts for Businesses
Profit and Loss Accounts enable businesses to track operational efficiency and profitability. They provide insights into cost control and revenue generation, aiding strategic planning. Regular monitoring helps identify trends and potential financial issues early.
Key Components of a Profit and Loss Account
The essential components include Revenue, Cost of Goods Sold (COGS), Gross Profit, Expenses, and Net Profit or Loss. Each element represents specific financial activities that impact the overall results. Understanding these parts is vital for accurate financial analysis.
Benefits of Using Excel for P&L Statements
Excel offers flexibility, automation, and easy customization for creating Profit and Loss Statements. Its formulas and functions simplify financial calculations, reducing errors and saving time. Excel also supports data visualization for clearer financial insights.
Step-by-Step Guide to Creating a P&L Account in Excel
Start by listing all income sources and expenses in separate columns. Use Excel formulas to calculate subtotals and net profit automatically. Finally, format the sheet for readability and update it regularly for accurate financial tracking.
Essential Excel Formulas for P&L Management
Key formulas include SUM for totaling revenues and expenses, SUBTOTAL for filtered data, and IF statements for conditional calculations. These functions enhance the accuracy and efficiency of your profit and loss statements. Mastering them is crucial for effective financial management.
Customizable Profit and Loss Account Excel Templates
Templates provide a ready-made structure with pre-built formulas and formatting for a customizable P&L account. Using templates saves time and ensures consistency across financial reports. Many templates can be tailored to specific industries and business sizes.
Common Mistakes to Avoid in P&L Excel Sheets
Avoid errors like incorrect formula references, inconsistent data entry, and neglecting to update figures. Missing these details can lead to inaccurate financial reporting. Regular validation and reviews help maintain the integrity of your Excel sheets.
Tips for Accurate Financial Reporting in Excel
Maintain clear labeling, use consistent formats, and double-check all calculations for reliable financial reporting. Incorporate data validation and protect sheets to prevent accidental changes. These practices ensure data accuracy and credibility in your reports.
Downloadable Profit and Loss Account Format in Excel
Many resources offer free or paid downloadable P&L Excel templates to facilitate easy setup. These templates streamline financial analysis and help businesses maintain professional records. Always choose formats compatible with your specific reporting needs.