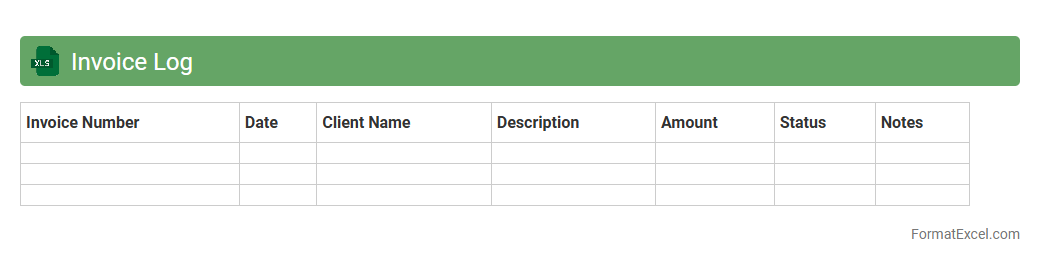
Invoice Log
An
Invoice Log Excel document is a structured spreadsheet used to record, track, and manage invoices issued or received by a business. It facilitates monitoring payment statuses, due dates, and invoice amounts, ensuring accurate financial management and timely follow-ups. This tool improves organization, reduces errors, and enhances cash flow visibility in accounting processes.
Customer Transaction Log
A
Customer Transaction Log Excel document is a detailed record tracking all customer purchases, payments, and related financial activities. It helps businesses monitor transaction history, analyze purchasing patterns, and maintain accurate financial records for better decision-making and customer management. Using this log improves transparency, supports auditing processes, and enhances customer service by providing quick access to transaction details.
Product Sales Tracker
The
Product Sales Tracker Excel document helps businesses monitor and analyze sales data efficiently by organizing product information, sales volumes, and revenue metrics in one place. It enables users to identify top-performing products, track sales trends over time, and make data-driven decisions to optimize inventory and marketing strategies. Utilizing this tracker supports better forecasting, enhances financial reporting accuracy, and improves overall sales management effectiveness.
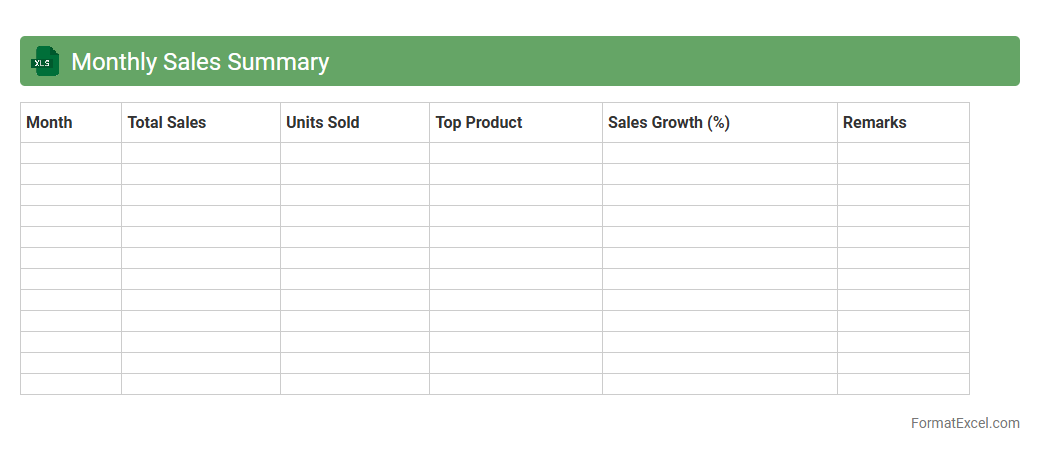
Monthly Sales Summary
A
Monthly Sales Summary Excel document consolidates sales data over a specific month, providing a clear overview of total revenue, product performance, and sales trends. This report helps businesses track growth, identify best-selling products, and make informed decisions to optimize marketing and inventory strategies. By analyzing this summary, companies can forecast future sales and improve overall financial planning.
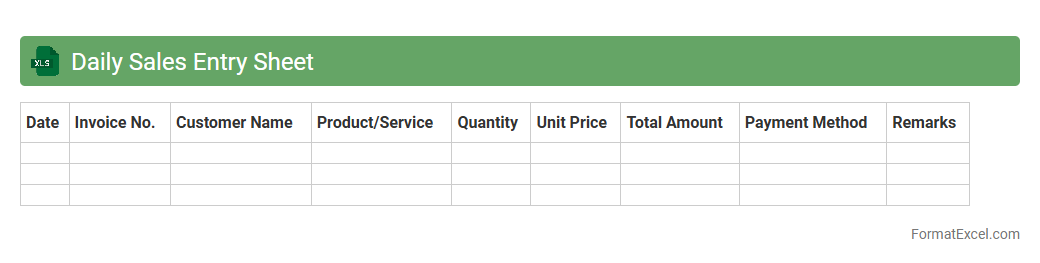
Daily Sales Entry Sheet
The
Daily Sales Entry Sheet Excel document is a structured template designed to record and track daily sales transactions systematically. It helps businesses monitor sales performance, manage inventory, and generate accurate sales reports by consolidating data such as product details, quantities sold, prices, and total revenue. Using this sheet improves data accuracy, streamlines accounting processes, and provides insights for making informed sales and marketing decisions.
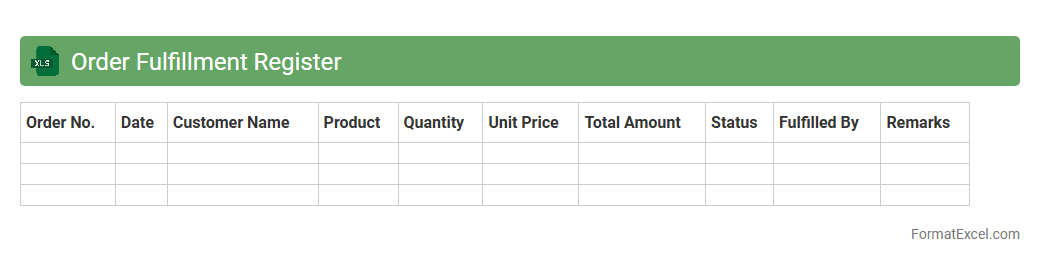
Order Fulfillment Register
The
Order Fulfillment Register Excel document is a structured tool that tracks and manages the progress of customer orders from placement to delivery, ensuring timely fulfillment and accurate record-keeping. It helps businesses monitor inventory levels, shipping status, and order accuracy, reducing errors and improving customer satisfaction. Utilizing this register enhances operational efficiency by providing clear visibility into order workflows and enabling data-driven decision-making.
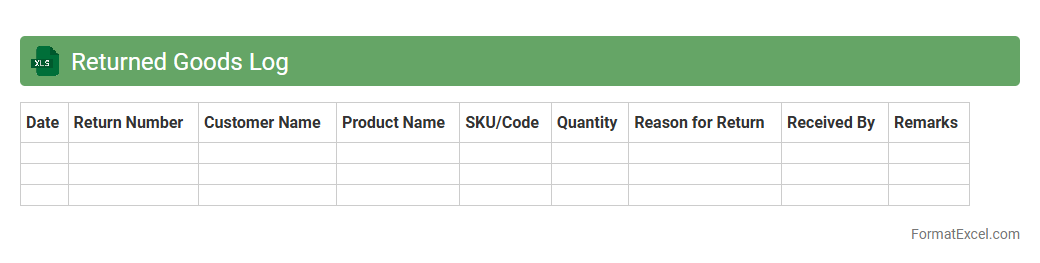
Returned Goods Log
The
Returned Goods Log Excel document is a detailed record used to track products that customers have sent back due to defects, damages, or dissatisfaction. It helps businesses manage inventory adjustments, analyze return trends, and improve customer service by providing clear insights into product quality issues. Maintaining this log enhances accountability and streamlines the returns process, reducing losses and optimizing supply chain efficiency.
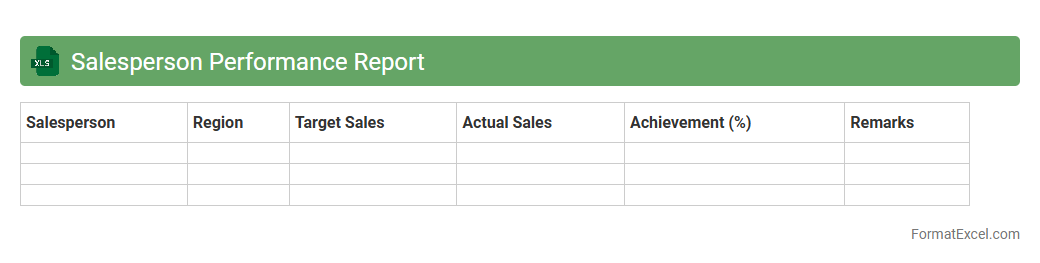
Salesperson Performance Report
The
Salesperson Performance Report Excel document tracks individual sales activities, revenue generated, and key performance indicators such as conversion rates and average deal size. This report enables managers to identify top performers, monitor progress against targets, and spot areas needing improvement. Leveraging this data-driven insight increases sales efficiency and supports informed decision-making to boost overall team productivity.
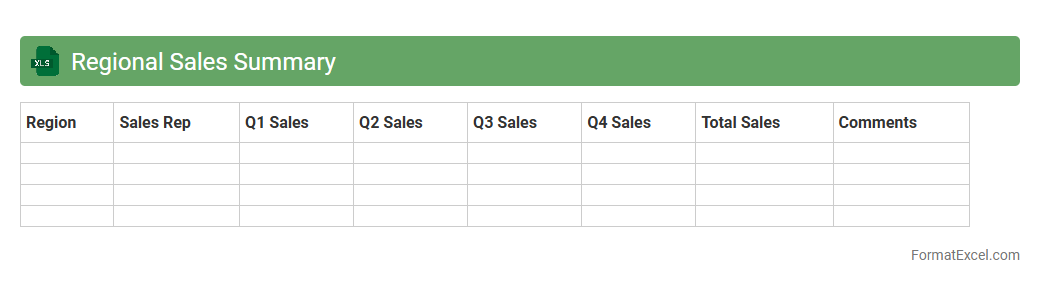
Regional Sales Summary
The
Regional Sales Summary Excel document compiles comprehensive sales data segmented by geographic regions, enabling businesses to analyze performance trends and identify top-performing areas. It provides key metrics such as total sales, growth rates, and product category breakdowns for each region in a clear, organized format. This summary facilitates strategic decision-making by highlighting regional strengths and opportunities for targeted marketing and resource allocation.
Discounts and Promotions Tracker
The
Discounts and Promotions Tracker Excel document is a tool designed to monitor and manage various discount offers and promotional campaigns efficiently. It helps businesses keep track of discount codes, percentage savings, campaign durations, and customer usage patterns, enabling better budgeting and strategic planning. By using this tracker, companies can analyze the effectiveness of promotions, optimize marketing efforts, and maximize revenue growth.
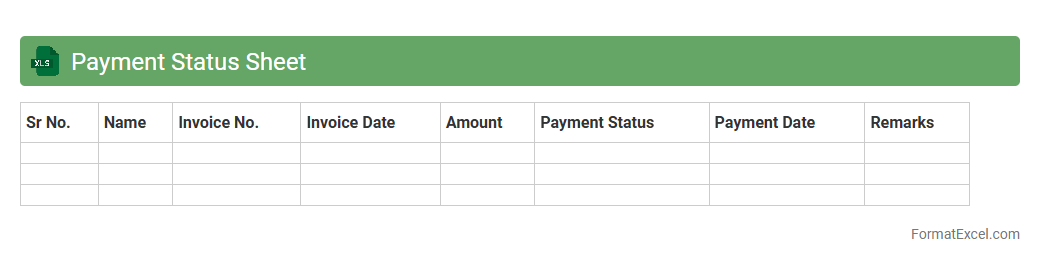
Payment Status Sheet
A
Payment Status Sheet Excel document is a structured tool that tracks and displays the payment progress for various invoices or bills within an organization. It helps in monitoring outstanding amounts, due dates, and payment confirmations, ensuring timely financial management and reducing the risk of missed or delayed payments. By providing a clear overview of payment statuses, this sheet enhances cash flow transparency and supports accurate accounting processes.
Quarterly Revenue Assessment
A
Quarterly Revenue Assessment Excel document is a detailed financial tool designed to track and analyze revenue generated each quarter, helping businesses evaluate their sales performance over time. It organizes data into clear categories such as product lines, regions, and customer segments, enabling strategic decision-making through trend identification and variance analysis. This document is useful for forecasting future revenue, budgeting effectively, and ensuring alignment with organizational financial goals.
Sales by Product Category Report
The
Sales by Product Category Report Excel document organizes sales data according to distinct product categories, enabling businesses to analyze performance across various segments. It helps identify top-selling categories, track revenue trends, and make data-driven decisions for inventory management and marketing strategies. This report enhances visibility into which products contribute most to overall sales, driving targeted growth and operational efficiency.
Customer Feedback Record
A
Customer Feedback Record Excel document systematically organizes client opinions, complaints, and suggestions in a structured format. It enables businesses to track, analyze, and prioritize customer insights effectively, improving product development and service quality. By maintaining this record, companies can enhance customer satisfaction, identify trends, and make data-driven decisions to boost overall performance.
Sales Pipeline Overview
A
Sales Pipeline Overview Excel document visually tracks the stages of potential sales opportunities from lead generation to closing deals, enabling businesses to manage and forecast revenue effectively. It consolidates data such as prospect details, deal value, probability, and expected close dates to provide actionable insights for sales teams. Utilizing this tool improves sales strategy, prioritizes efforts, and enhances decision-making by identifying bottlenecks and tracking progress systematically.
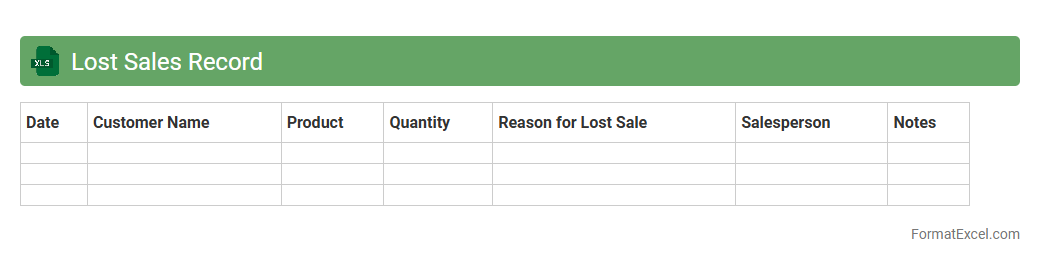
Lost Sales Record
A
Lost Sales Record Excel document tracks instances where potential sales were not completed, detailing reasons such as product unavailability, pricing issues, or customer decisions. This record helps businesses identify patterns and areas for improvement, enabling better inventory management, pricing strategies, and customer service enhancements. Utilizing this data effectively can lead to increased revenue by reducing future lost sales opportunities.
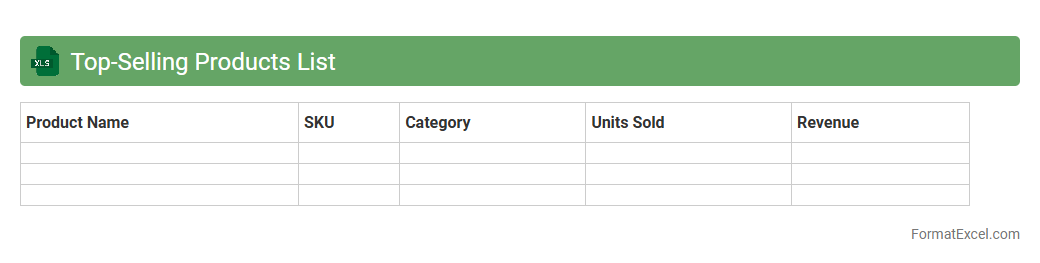
Top-Selling Products List
The
Top-Selling Products List Excel document tracks key sales metrics such as product names, units sold, revenue generated, and sales trends over time. This data enables businesses to identify best-performing products, optimize inventory management, and tailor marketing strategies effectively. By analyzing this list, companies can boost profitability and make informed decisions on product development and promotions.
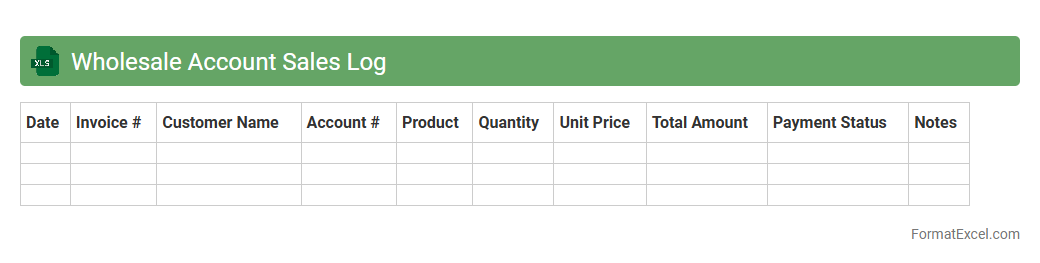
Wholesale Account Sales Log
The
Wholesale Account Sales Log Excel document is a structured spreadsheet designed to track and manage sales transactions between wholesalers and their clients. It provides detailed records of product quantities, prices, dates, and customer information, enabling efficient monitoring of sales performance and inventory levels. This tool enhances financial accuracy, streamlines order processing, and supports data-driven decision-making for optimizing wholesale operations.
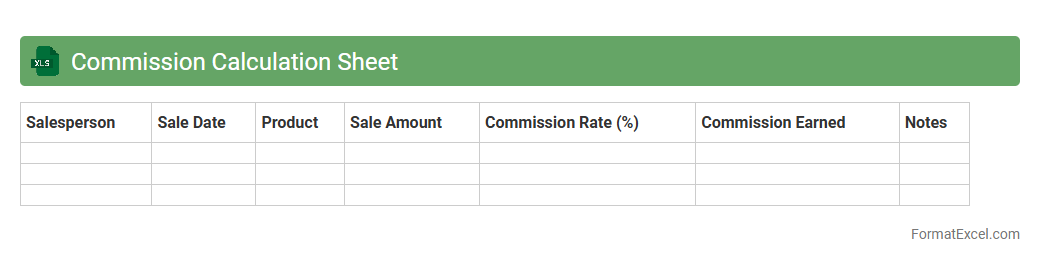
Commission Calculation Sheet
A
Commission Calculation Sheet in Excel is a structured document designed to track and calculate sales commissions based on predefined criteria such as sales volume, commission rates, and performance tiers. It automates complex calculations, reduces errors, and provides clear visibility into earnings for sales teams and management. Using this sheet improves transparency, streamlines payroll processes, and supports accurate financial forecasting.
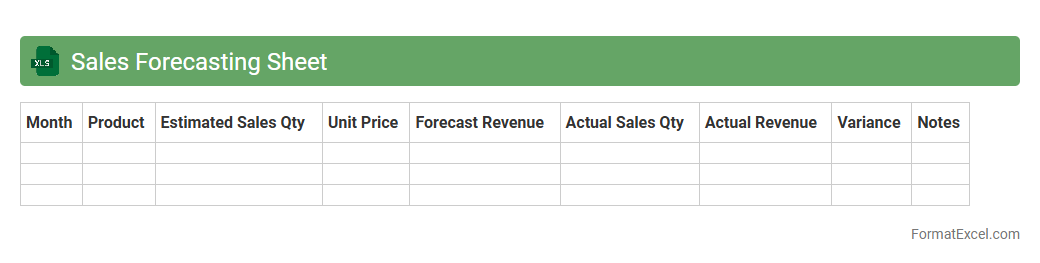
Sales Forecasting Sheet
A
Sales Forecasting Sheet in Excel is a tool designed to predict future sales volumes based on historical data and market trends. It enables businesses to analyze patterns, set realistic sales targets, and allocate resources effectively by providing a clear projection of expected revenue. Utilizing such a sheet helps improve decision-making, budgeting accuracy, and overall strategic planning.
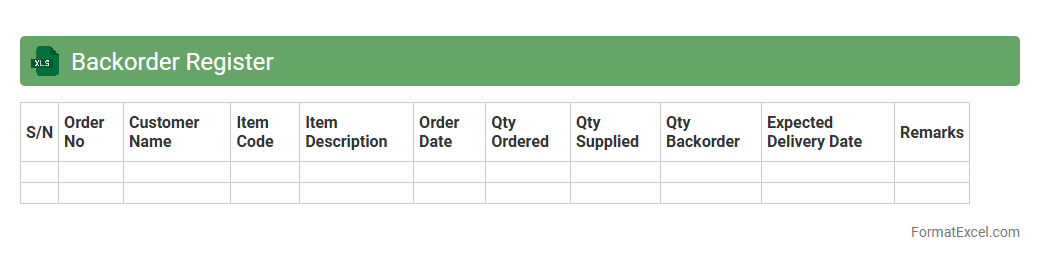
Backorder Register
The
Backorder Register Excel document tracks all customer orders that cannot be fulfilled immediately due to inventory shortages, enabling businesses to monitor pending shipments effectively. It provides critical data such as product details, order dates, quantities, and expected restock dates, facilitating efficient inventory management and prioritization of order fulfillment. This tool helps improve customer satisfaction by ensuring timely updates and organized handling of backorders.
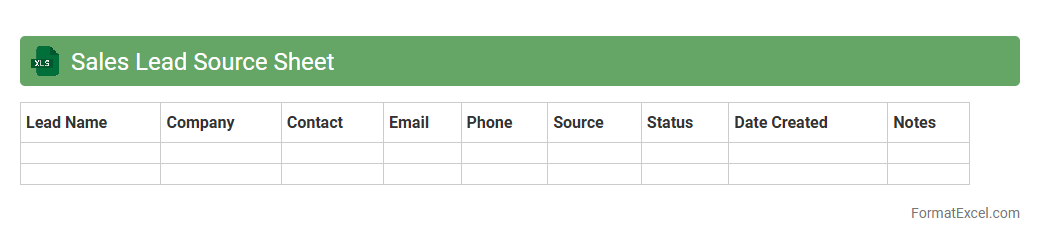
Sales Lead Source Sheet
A
Sales Lead Source Sheet in Excel is a structured document designed to track and analyze the origins of sales leads from various channels such as social media, email campaigns, referrals, or events. This tool helps businesses identify the most effective lead generation sources, optimize marketing strategies, and allocate resources efficiently. By consolidating lead data in one place, it enhances decision-making processes and improves overall sales performance.
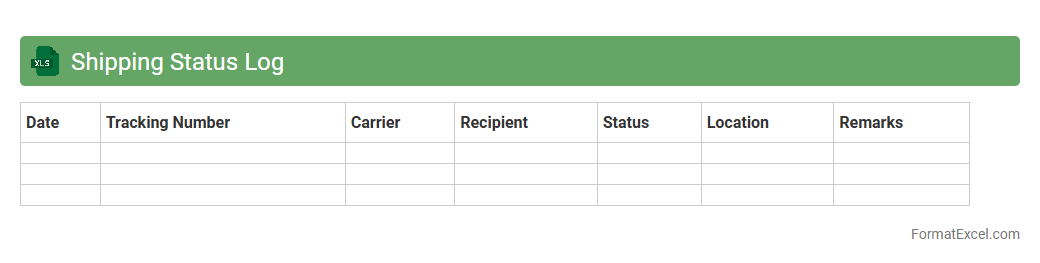
Shipping Status Log
A
Shipping Status Log Excel document is a detailed record that tracks the progress and updates of shipments, including dates, carrier details, tracking numbers, and delivery status. It is useful for businesses to monitor the movement of goods, identify delays, and ensure timely deliveries, improving overall supply chain management. The document enhances transparency and accountability, enabling better communication between suppliers, logistics teams, and customers.
Online vs In-Store Sales Data
The
Online vs In-Store Sales Data Excel document tracks and compares revenue generated from e-commerce platforms and physical retail locations, providing insights into consumer purchasing behavior across channels. This tool enables businesses to analyze trends, optimize inventory management, and tailor marketing strategies based on sales performance data. By leveraging this data, companies can enhance decision-making, improve resource allocation, and drive overall sales growth.
Customer Repeat Purchase Tracker
The
Customer Repeat Purchase Tracker Excel document is a tool designed to monitor and analyze the frequency and patterns of returning customers over time. It helps businesses identify loyal customers, measure customer retention rates, and evaluate the effectiveness of marketing strategies aimed at increasing repeat sales. By leveraging this data, companies can optimize customer engagement, improve product offerings, and boost overall revenue through targeted follow-up campaigns.
Introduction to Sales Record Format in Excel
The Sales Record Format in Excel is a structured template designed to help track and manage sales transactions efficiently. It organizes data such as customer information, sales date, product details, and amounts in a clear manner. Utilizing Excel for sales records increases accuracy and simplifies reporting.
Importance of Keeping Digital Sales Records
Maintaining digital sales records ensures easy access, better data integrity, and improved decision-making capabilities. Digital records allow quick updates and backups, reducing the risk of lost information. They also support seamless sharing and collaboration within teams.
Key Components of a Sales Record Spreadsheet
A well-crafted sales record spreadsheet contains essential components such as date, customer name, product details, quantity, unit price, and total sales. These components provide a comprehensive overview of sales activity. Accurate components enable precise sales analysis and forecasting.
Step-by-Step Guide to Creating a Sales Record Template
Start by defining the columns needed for your sales data, then set appropriate data formats for currency and dates. Use Excel features like tables, filters, and formulas to automate calculations. Finally, save the template for repeated use to streamline sales tracking.
Essential Columns for Sales Tracking
Key columns include Invoice Number, Date of Sale, Customer Name, Product Description, Quantity Sold, Unit Price, and Total Amount. These columns help record every critical detail of a transaction. Proper labeling of columns ensures clarity and easy data retrieval.
Sample Sales Record Format in Excel
A sample sales record format consists of rows for individual transactions and columns for each sales parameter. Using color-coding and data validation enhances readability and accuracy. Including summary rows or charts provides quick insights into sales performance.
How to Automate Sales Data Entry
Automation can be achieved by utilizing Excel formulas like SUM and VLOOKUP, and integrating drop-down lists for data consistency. Macros and Excel scripts can further streamline repetitive data entry tasks. Automating reduces errors and saves valuable time.
Tips for Customizing Your Sales Record Format
Customize your sales record by adding columns relevant to your business needs, such as discounts or payment method. Use conditional formatting to highlight important trends or overdue sales. Tailoring the template ensures it fits your unique sales processes.
Common Mistakes to Avoid in Sales Spreadsheets
Avoid errors like inconsistent data entry, missing totals, and lack of backup copies. Neglecting to protect formulas and not using proper data validation can also cause issues. Regularly reviewing and cleaning your sales spreadsheet maintains accuracy.
Best Practices for Sales Record Management in Excel
Regularly update your sales records and back them up to prevent data loss. Use secure permissions to restrict unauthorized access and maintain data confidentiality. Employing clear organization and consistent formatting ensures your sales records remain reliable and easy to use.