Assets Summary
An
Assets Summary Excel document consolidates all financial and physical assets of an individual or organization into a clear, organized format. It enables efficient tracking, valuation, and management of assets, enhancing decision-making and financial planning. By providing a comprehensive overview, it helps identify asset distribution, monitor growth, and ensure accurate reporting for audits or budgeting.
Liabilities Summary
A
Liabilities Summary Excel document consolidates all outstanding debts and financial obligations of a business or individual into a clear and organized format. It helps track due dates, amounts owed, and creditor details, making it easier to manage cash flow and prioritize payments. This summary enhances financial planning accuracy and supports timely decision-making to maintain a healthy credit profile.
Equity Summary
An
Equity Summary Excel document consolidates ownership data, stock options, and shareholder information in a clear, organized format. It helps stakeholders track equity distribution, manage dilution effects, and make informed decisions on investment or compensation. This tool enhances transparency and accuracy in financial planning and corporate governance.
Current Assets Breakdown
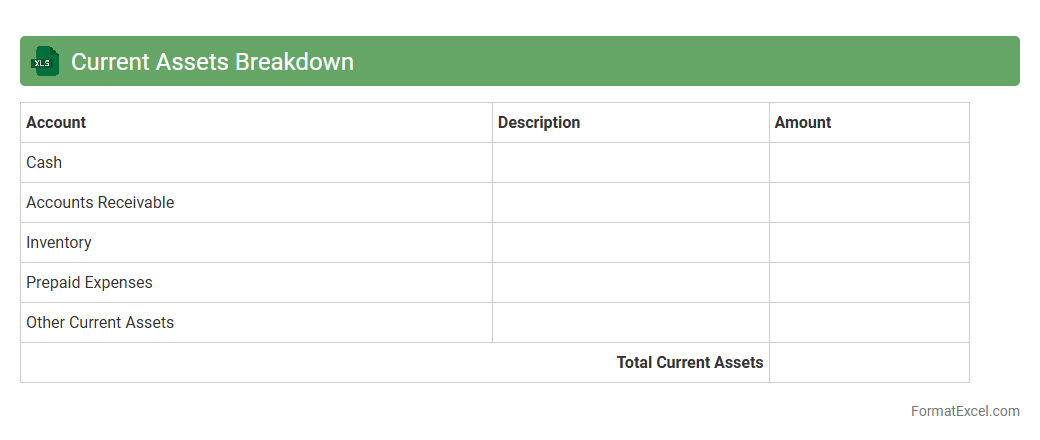
The
Current Assets Breakdown Excel document categorizes and itemizes a company's short-term assets such as cash, accounts receivable, inventory, and prepaid expenses. It provides a clear snapshot of liquidity and helps in assessing the company's ability to meet immediate financial obligations. This tool is essential for financial analysis, budgeting, and strategic decision-making, enabling accurate monitoring of asset allocation and cash flow management.
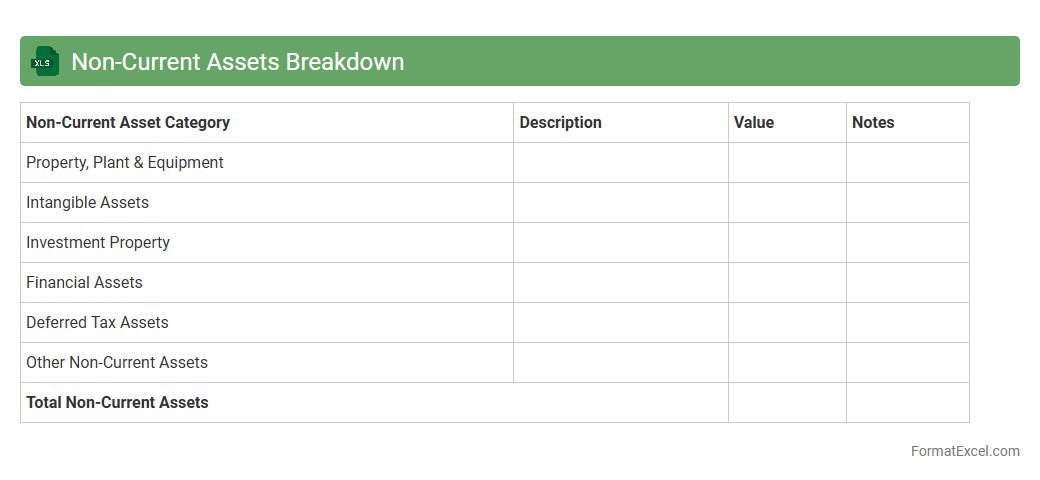
Non-Current Assets Breakdown
The
Non-Current Assets Breakdown Excel document provides a detailed categorization and valuation of long-term assets such as property, plant, equipment, intangible assets, and investments. This tool helps organizations track asset depreciation, manage asset acquisition and disposal, and analyze the impact on financial statements for accurate reporting and decision-making. Businesses can improve budgeting, compliance, and strategic planning by maintaining a clear and accessible record of their non-current asset portfolio.
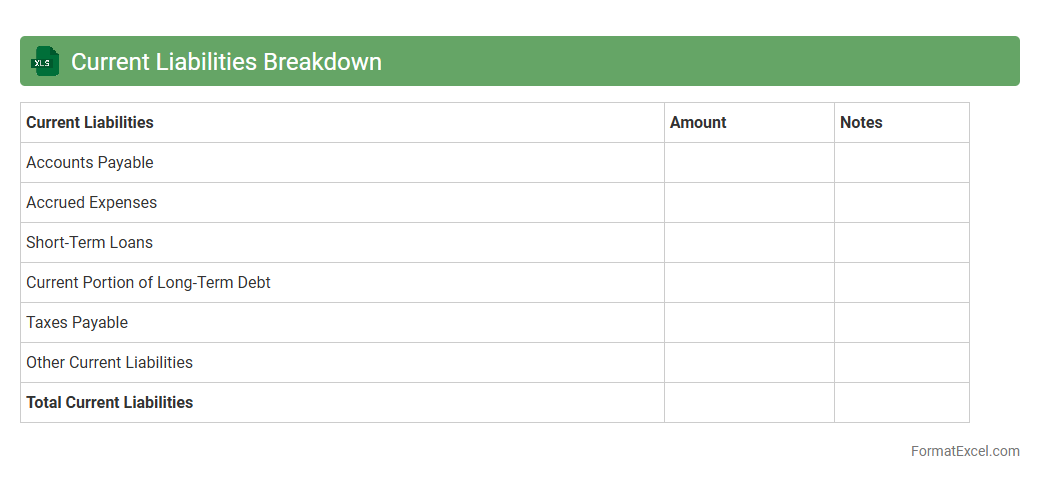
Current Liabilities Breakdown
A
Current Liabilities Breakdown Excel document itemizes short-term financial obligations a company must settle within one year, such as accounts payable, accrued expenses, and short-term loans. This document aids businesses in managing cash flow efficiently by providing clear visibility into upcoming payments and obligations. It also supports financial analysis and decision-making by highlighting liquidity and solvency risks.
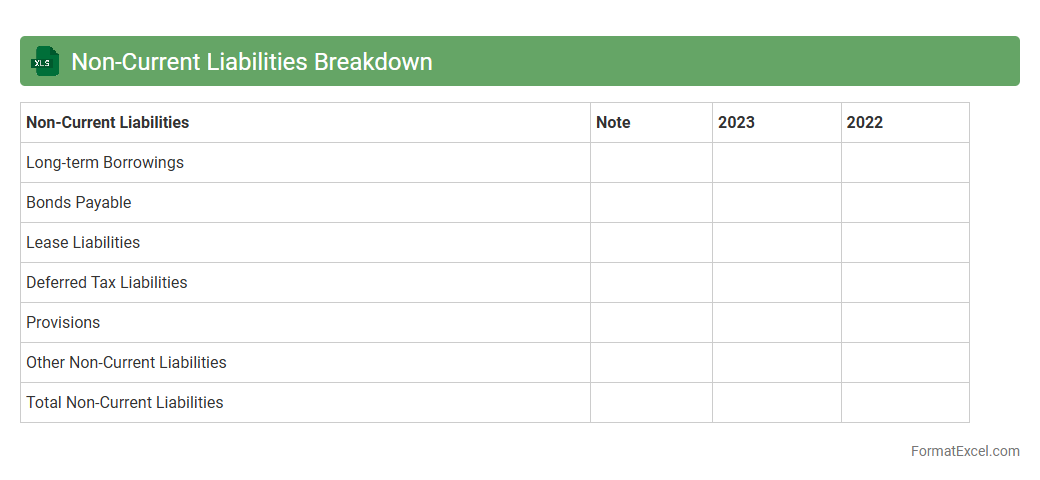
Non-Current Liabilities Breakdown
A
Non-Current Liabilities Breakdown Excel document itemizes long-term financial obligations such as bonds payable, long-term loans, and deferred tax liabilities. This detailed analysis helps businesses assess their future financial commitments and manage cash flow efficiently by tracking due dates and interest expenses. By organizing liabilities in a clear, structured format, it supports strategic planning, risk management, and improved decision-making.
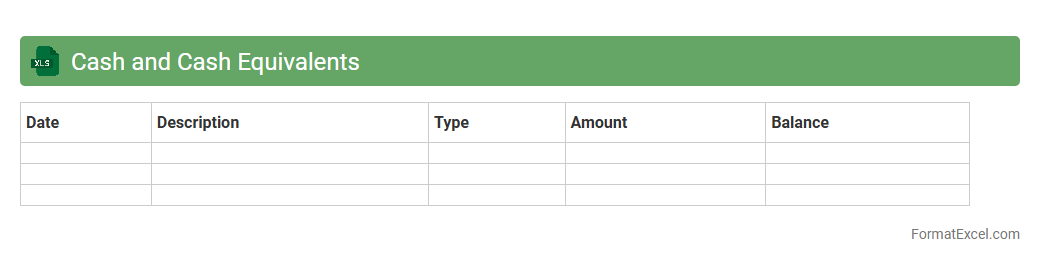
Cash and Cash Equivalents
A
Cash and Cash Equivalents Excel document is a financial tool used to track and manage a company's liquid assets, including cash, bank balances, and short-term investments. It helps businesses monitor their immediate liquidity position, ensuring they have enough funds to meet short-term obligations. This document is essential for accurate cash flow analysis, budgeting, and financial decision-making.
Accounts Receivable Aging
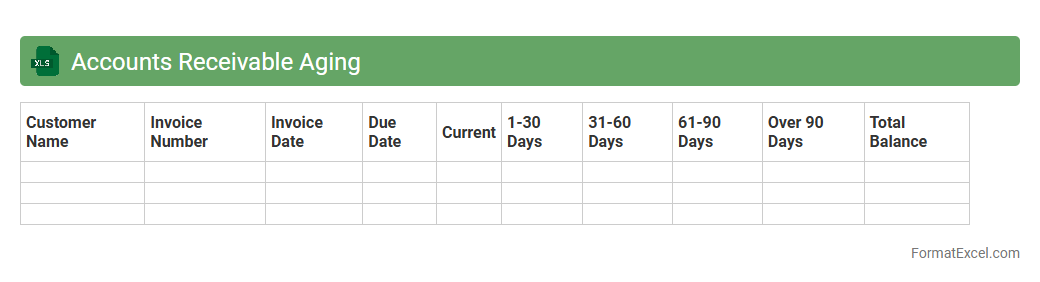
An
Accounts Receivable Aging Excel document categorizes outstanding customer invoices based on the length of time they have been unpaid, typically segmented into 30, 60, 90, and over 90 days. This report helps businesses identify overdue payments, manage cash flow effectively, and prioritize collection efforts to reduce bad debts. By providing a clear snapshot of receivables, it supports better financial decision-making and enhances accounts receivable management.
Inventory Valuation
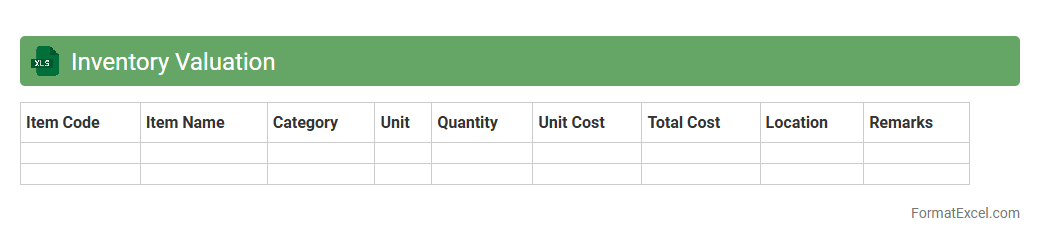
An
Inventory Valuation Excel document is a tool designed to calculate the value of stock items using various accounting methods such as FIFO, LIFO, or weighted average. It helps businesses accurately track the cost of goods sold and ending inventory, ensuring precise financial reporting and tax compliance. By organizing inventory data efficiently, this document aids in optimizing stock management and making informed purchasing decisions.
Property Plant and Equipment
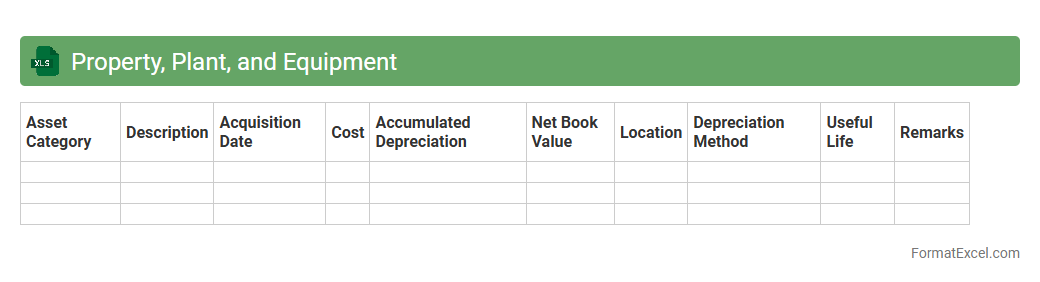
A
Property, Plant, and Equipment (PP&E) Excel document is a financial tool used to track the acquisition, depreciation, and disposal of fixed assets in a business. It helps maintain accurate records for accounting purposes, supports asset management, and ensures compliance with tax regulations. This document aids in budget planning, financial analysis, and enhances decision-making by providing clear visibility into the company's long-term assets and their value over time.
Intangible Assets
An
Intangible Assets excel document is a digital spreadsheet designed to track and manage non-physical assets such as patents, trademarks, copyrights, and goodwill. It enables businesses to systematically record asset details, valuation, amortization schedules, and impairment analysis, enhancing financial accuracy and reporting compliance. Utilizing this tool helps in making informed strategic decisions, optimizing asset management, and supporting accurate financial statements.
Accounts Payable Analysis
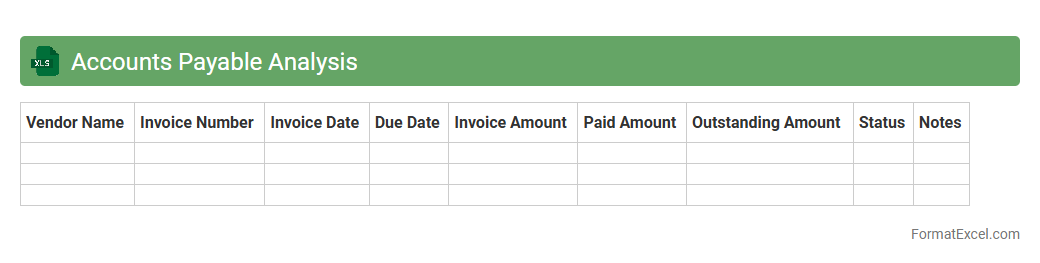
An
Accounts Payable Analysis Excel document consolidates and organizes vendor invoices, payment schedules, and outstanding liabilities, providing a clear view of a company's obligations. It helps track payment statuses, identify overdue accounts, and manage cash flow effectively to maintain supplier relationships and avoid late fees. This analysis supports financial planning and decision-making by highlighting spending patterns and enabling timely, accurate payments.
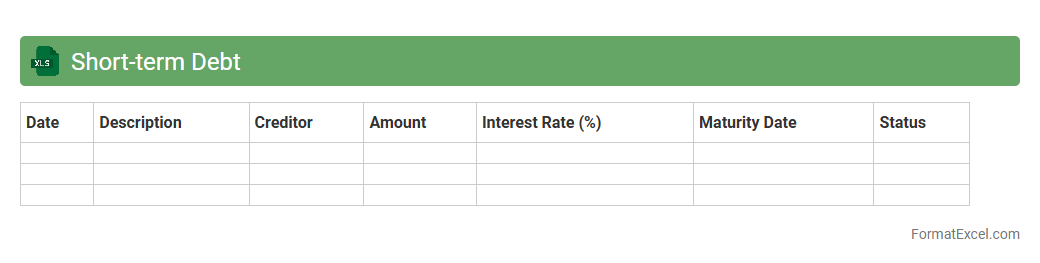
Short-Term Debt
A
Short-Term Debt Excel document is a financial tool designed to track and manage obligations due within one year, including loans, accounts payable, and accrued expenses. It helps businesses monitor repayment schedules, calculate interest expenses, and maintain accurate liquidity forecasts. Using this document ensures better cash flow management and supports strategic financial planning.
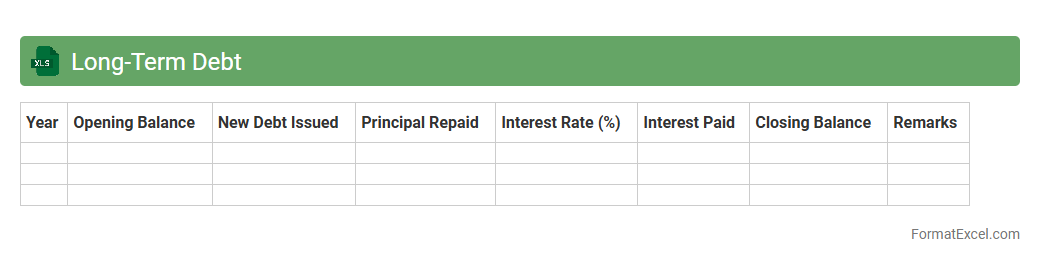
Long-Term Debt
A
Long-Term Debt Excel document is a financial tool designed to track and manage debts with extended repayment periods, typically exceeding one year. It enables users to organize loan details, interest rates, payment schedules, and remaining balances, facilitating accurate monitoring and forecasting. This document is useful for businesses and individuals to maintain clear oversight of liabilities, optimize cash flow planning, and support strategic financial decision-making.
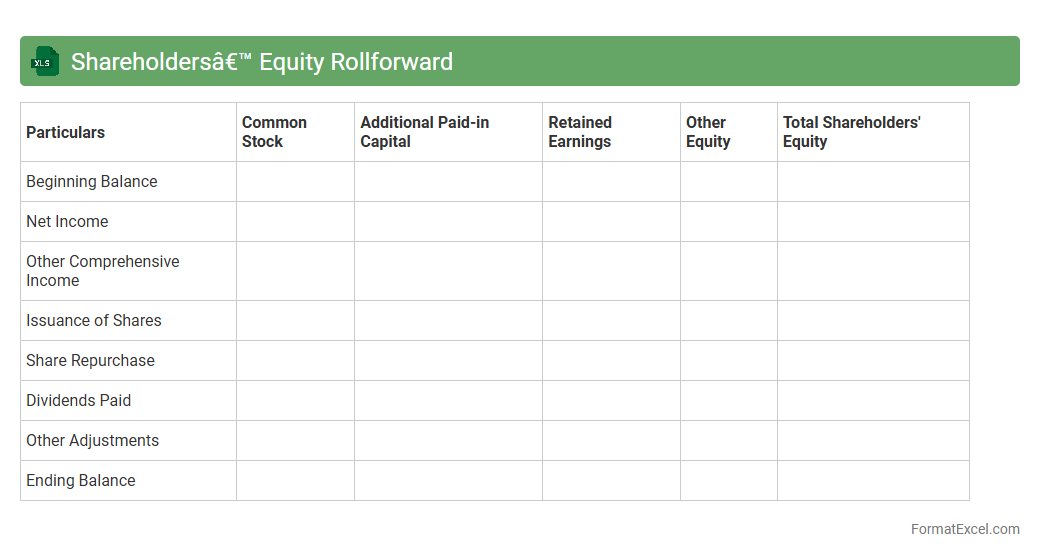
Shareholders’ Equity Rollforward
A
Shareholders' Equity Rollforward Excel document tracks changes in equity accounts such as common stock, retained earnings, and comprehensive income over a specified period. This tool helps users analyze the causes of equity fluctuations, including net income, dividends, stock issuances, and buybacks. It is essential for financial reporting, auditing, and providing transparency to investors about a company's capital structure evolution.
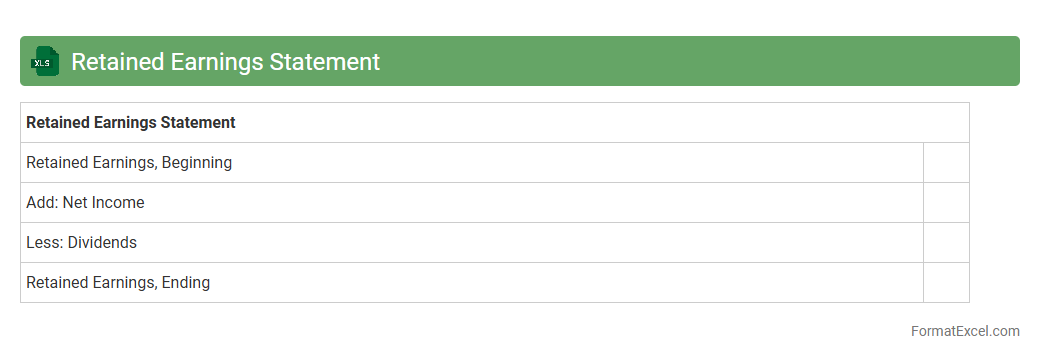
Retained Earnings Statement
A
Retained Earnings Statement Excel document is a financial report that summarizes the changes in retained earnings over a specific period, showing net income, dividends paid, and accumulated profits. This document helps businesses track their reinvested earnings and evaluate their capacity for future growth or debt repayment. Utilizing Excel enables easy customization, quick updates, and clear visualization for better financial decision-making and reporting accuracy.
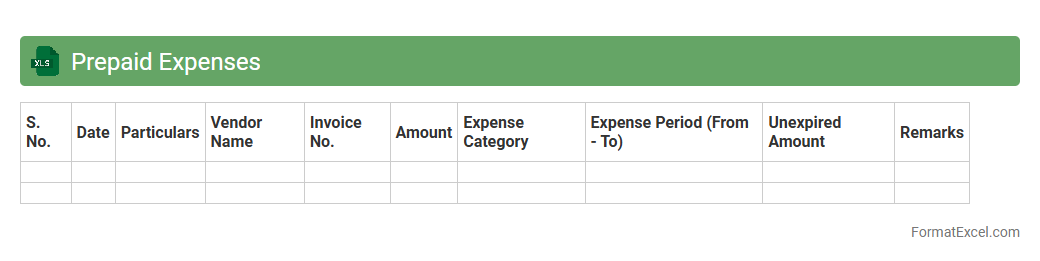
Prepaid Expenses
A
Prepaid Expenses Excel document is a financial tool used to track and manage payments made in advance for goods or services, such as rent, insurance, or subscriptions. It helps businesses monitor the allocation of these expenses over time, ensuring accurate accounting and cash flow management. By organizing prepaid expenses systematically, the document aids in financial reporting and budgeting processes.
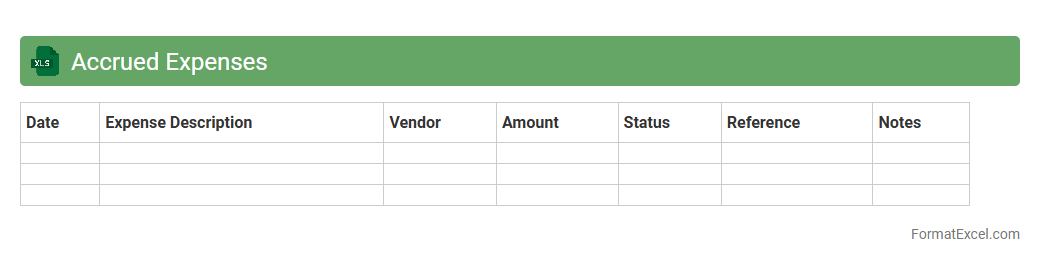
Accrued Expenses
An
Accrued Expenses Excel document is a financial tool used to track expenses that have been incurred but not yet paid. It helps businesses accurately record liabilities in the correct accounting period, ensuring compliance with accrual accounting principles. This document improves financial reporting, cash flow management, and budget forecasting by providing clear visibility into outstanding obligations.
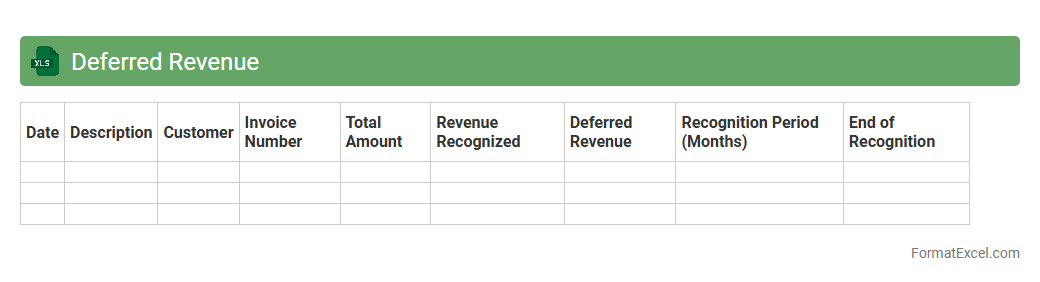
Deferred Revenue
A
Deferred Revenue Excel document is a financial tool used to track payments received for goods or services not yet delivered or performed, ensuring accurate revenue recognition over time. It helps businesses manage accrued income, comply with accounting standards like GAAP or IFRS, and forecast future cash flows. This document enhances financial transparency and supports effective decision-making by providing a clear view of outstanding liabilities.
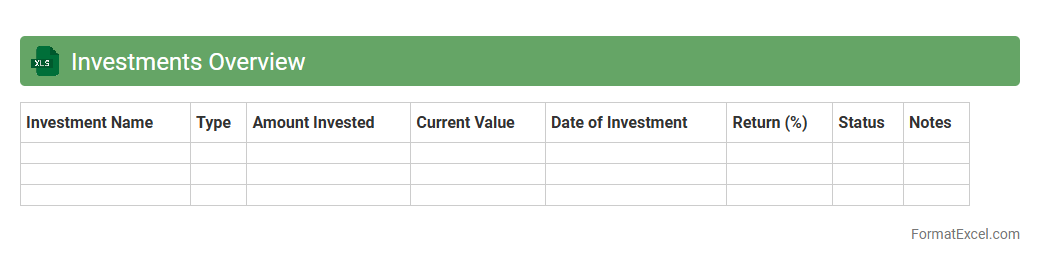
Investments Overview
The
Investments Overview Excel document provides a comprehensive summary of all investment portfolios, including asset allocation, performance metrics, and risk analysis. It helps investors track growth, compare returns, and make informed decisions by consolidating critical financial data in a single, easily accessible file. Using this document enhances portfolio management efficiency and supports strategic planning based on real-time investment insights.
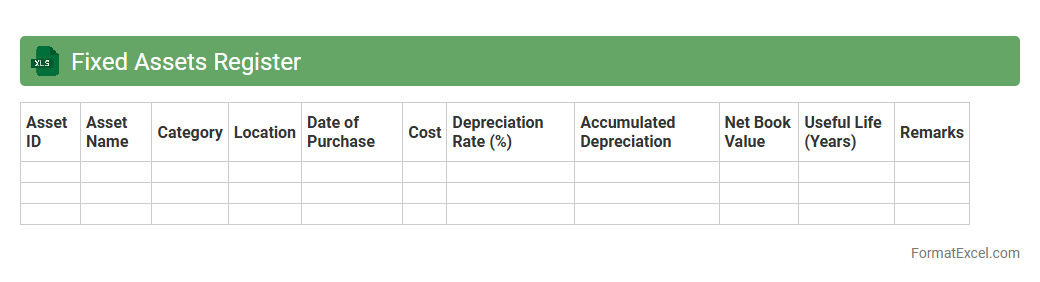
Fixed Assets Register
A
Fixed Assets Register Excel document is a detailed record of a company's fixed assets, including information such as asset acquisition dates, cost, depreciation, and current value. It helps organizations track the lifecycle and financial status of assets, ensuring accurate accounting and compliance with tax regulations. This register also aids in asset management, maintenance planning, and informed decision-making for future capital investments.
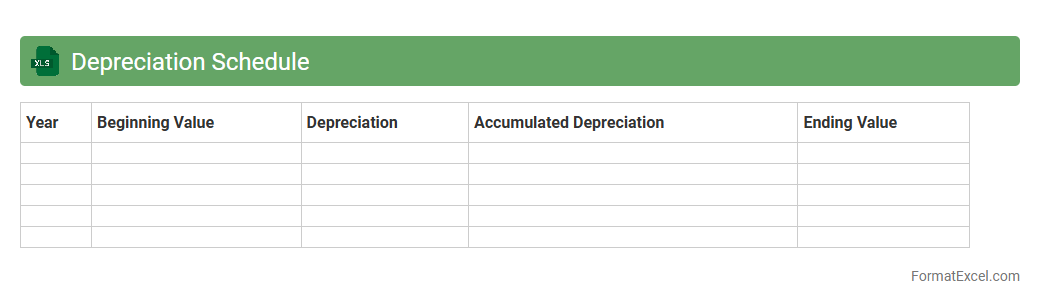
Depreciation Schedule
A
Depreciation Schedule Excel document is a structured spreadsheet used to systematically calculate and track the reduction in value of fixed assets over time. It helps businesses accurately determine asset depreciation, ensuring compliance with accounting standards and optimizing tax reporting. By providing a clear overview of asset lifespans, accumulated depreciation, and remaining book value, it enhances financial planning and asset management efficiency.
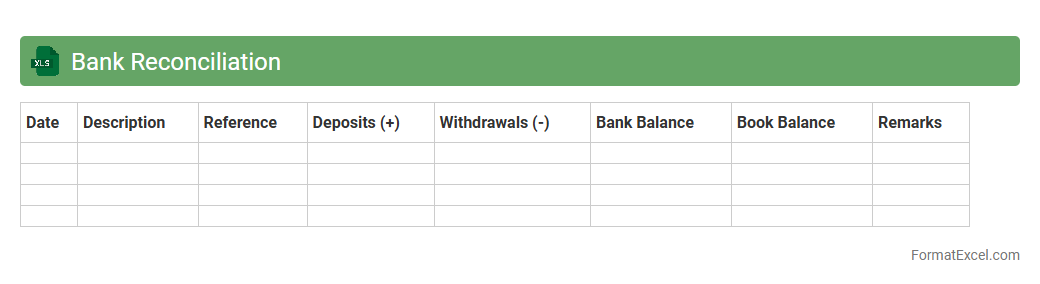
Bank Reconciliation
A
Bank Reconciliation Excel document is a tool that helps compare and match an organization's internal financial records with bank statements to identify discrepancies. It ensures accuracy in cash flow management by detecting errors, unauthorized transactions, or missing entries, providing a clear financial snapshot. Using this document streamlines the reconciliation process, saving time and improving the reliability of financial reporting for businesses and individuals alike.
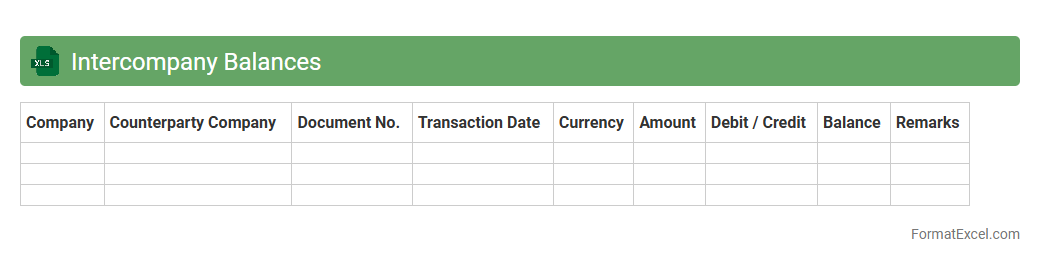
Intercompany Balances
The
Intercompany Balances Excel document is a specialized spreadsheet used to track and reconcile financial transactions between related business entities within a corporate group. It helps ensure accurate recording of intercompany loans, advances, and settlements, facilitating transparent financial reporting and compliance with accounting standards. This document significantly streamlines the process of identifying discrepancies and supports efficient consolidation of financial statements across multiple subsidiaries.
Introduction to Balance Sheet Report in Excel
A balance sheet report in Excel is a financial statement that summarizes a company's assets, liabilities, and equity at a specific point in time. Excel offers flexibility and ease of use for creating and maintaining these reports. It helps business owners quickly analyze their financial position with customizable layouts.
Importance of Balance Sheet for Businesses
The balance sheet is crucial for assessing a company's financial health, showing what it owns versus what it owes. It aids in decision-making for investors, creditors, and management. Accurate balance sheets help maintain transparency and build financial trust.
Key Components of a Balance Sheet
A balance sheet consists of three key sections: assets, liabilities, and shareholders' equity. Assets include current and fixed assets, liabilities cover current and long-term obligations, while equity shows ownership interest. Each component must balance so that assets equal liabilities plus equity.
Setting Up Your Excel Sheet for Balance Reporting
Start by labeling columns for description, current period values, and comparative periods in your Excel spreadsheet. Use clear headings and organize data to reflect assets, liabilities, and equity. Applying cell formatting ensures readability and professional presentation.
Standard Balance Sheet Format in Excel
The standard balance sheet format includes sections for current assets, non-current assets, current liabilities, non-current liabilities, and equity in a structured table. Totals for each section should be calculated with Excel formulas like SUM for accuracy. Grouping data with outline features can enhance navigation.
Step-by-Step Guide to Creating a Balance Sheet in Excel
First, list all asset accounts under assets, then liabilities, and finally equity accounts. Use Excel formulas to sum each section and verify that total assets equal total liabilities plus equity. Add headers, borders, and bold totals for clarity in the balance sheet creation process.
Tips for Customizing Balance Sheet Templates
Customize templates by adjusting line items to fit your business needs and adding charts for visual representation. Utilizing Excel features like conditional formatting highlights key metrics, making the report more user-friendly. You can also insert comments to explain account details.
Common Mistakes to Avoid in Excel Balance Sheets
Avoid inputting incorrect data, not balancing assets and liabilities, and failing to update the sheet regularly. Incorrect formulas or misplaced figures can distort financial insights, so double-check your calculations. Maintaining accuracy is essential for reliable reporting.
Downloadable Balance Sheet Excel Templates
Many websites offer free or paid balance sheet templates that you can download and customize in Excel. Templates save time and ensure that your report meets accounting standards. Choose a template that aligns with your industry and reporting needs.
Frequently Asked Questions on Excel Balance Sheets
Common questions include how to link balance sheet data to other financial reports and how to update templates efficiently. Users often seek tips on automated calculations and formatting best practices for the Excel balance sheet. Regularly consulting FAQs can improve your reporting skills.