Monthly Sales Summary
A
Monthly Sales Summary Excel document consolidates key sales metrics such as total revenue, units sold, and sales performance by product or region into a structured format. This report enables businesses to track progress against targets, identify trends, and make data-driven decisions to optimize sales strategies. By providing clear visibility into monthly sales performance, it supports budgeting, forecasting, and resource allocation efforts effectively.
Weekly Sales Performance
The
Weekly Sales Performance Excel document tracks key sales metrics such as total revenue, units sold, and conversion rates on a weekly basis to provide a clear overview of sales trends. It enables businesses to identify top-performing products, monitor salesperson effectiveness, and detect potential market fluctuations early. By analyzing this data regularly, companies can make informed decisions to optimize sales strategies and improve overall revenue growth.
Daily Sales Tracking
The
Daily Sales Tracking Excel document is a structured tool designed to record and monitor daily sales transactions, providing real-time insights into a business's revenue flow. By organizing data such as product details, quantities sold, sales amounts, and dates, it helps identify sales trends, manage inventory, and forecast future performance. This systematic tracking empowers businesses to make informed decisions, optimize sales strategies, and enhance overall financial management.
Regional Sales Breakdown
The
Regional Sales Breakdown Excel document is a detailed report that categorizes sales data by specific geographic regions, enabling businesses to identify performance trends and market potential across different areas. By analyzing regional sales figures, companies can allocate resources more effectively, tailor marketing strategies to target high-potential markets, and identify underperforming regions requiring attention. This document serves as a valuable tool for data-driven decision-making, driving revenue growth and improving overall sales management.
Product-wise Sales Analysis
A
Product-wise Sales Analysis Excel document systematically organizes and evaluates sales data by individual products, enabling businesses to track performance and identify best-selling items. It provides detailed insights into revenue trends, sales volumes, and profit margins for each product, facilitating informed decision-making and inventory management. Utilizing this analysis helps optimize marketing strategies, improve stock allocation, and enhance overall business profitability.
Sales Target vs Achievement
A
Sales Target vs Achievement Excel document is a tool designed to track and compare planned sales goals against actual sales performance over a specified period. This spreadsheet enables businesses to identify gaps, analyze trends, and measure the effectiveness of sales strategies by visualizing deviations from targets. By providing clear insights into sales achievements, it supports data-driven decision-making and helps optimize sales planning and resource allocation.
Sales Pipeline Overview
The
Sales Pipeline Overview Excel document visually tracks and manages each stage of the sales process, from lead generation to closing deals. It helps sales teams prioritize prospects, forecast revenue, and identify bottlenecks to improve conversion rates. By consolidating data in a single sheet, it enhances decision-making and boosts overall sales productivity.
Top Customers Report
The
Top Customers Report Excel document identifies the highest revenue-generating clients by compiling and analyzing sales data over a specific period. This report helps businesses prioritize customer relationships, tailor marketing strategies, and allocate resources effectively to maximize profits. By providing detailed insights into customer purchasing patterns, it supports informed decision-making and drives targeted growth initiatives.
Sales by Channel
The
Sales by Channel Excel document categorizes and tracks revenue generated from different sales channels such as online, retail, and wholesale, providing a clear overview of performance. It helps identify which channels drive the most sales, enabling data-driven decisions to optimize marketing and resource allocation. This tool is essential for monitoring trends, forecasting demand, and improving overall sales strategy effectiveness.
Sales Growth Comparison
A
Sales Growth Comparison Excel document is a data analysis tool that tracks and compares sales performance across different periods, regions, or products. It helps businesses identify trends, measure growth rates, and pinpoint areas needing improvement by visualizing sales metrics clearly. This document supports informed decision-making by providing actionable insights into sales dynamics and forecasting future revenue potential.
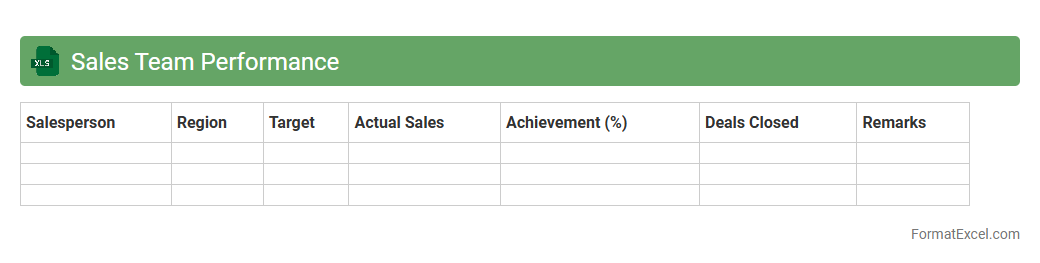
Sales Team Performance
A
Sales Team Performance Excel document is a structured spreadsheet designed to track, analyze, and visualize sales metrics such as individual quotas, conversion rates, and revenue generated. It helps managers monitor team progress, identify strengths and weaknesses, and make data-driven decisions to enhance productivity. Utilizing this tool increases accountability and supports strategic planning by providing clear performance insights.
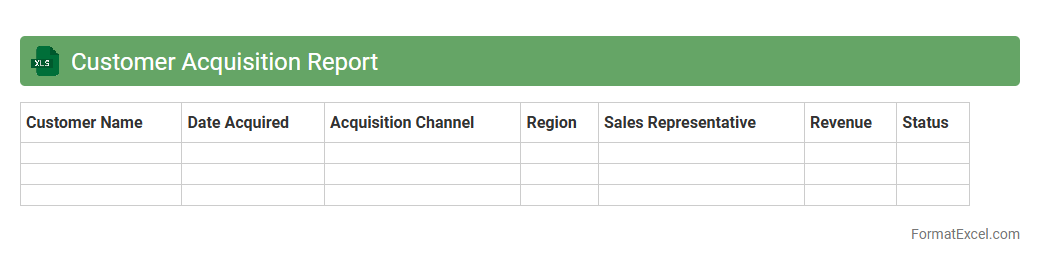
Customer Acquisition Report
A
Customer Acquisition Report excel document tracks the sources, costs, and effectiveness of acquiring new customers over time, providing detailed insights into marketing and sales efforts. It allows businesses to analyze customer acquisition channels, optimize budget allocation, and improve strategies for higher conversion rates. Utilizing this report enhances decision-making by revealing trends and identifying the most profitable customer acquisition methods.
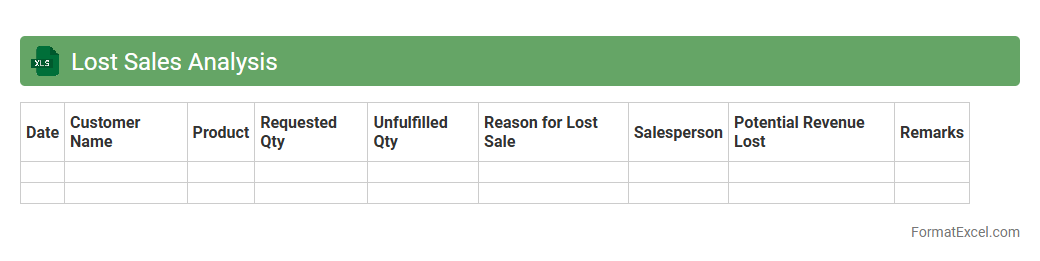
Lost Sales Analysis
The
Lost Sales Analysis Excel document helps identify and quantify missed revenue opportunities by tracking instances where customer demand was not met due to stockouts or other issues. It provides valuable insights into product performance, inventory management, and sales trends, enabling businesses to optimize stock levels and improve customer satisfaction. Utilizing this analysis aids in making data-driven decisions to reduce lost sales and enhance overall profitability.
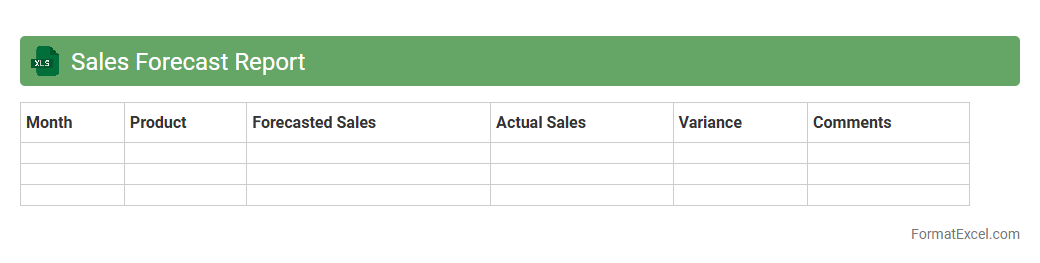
Sales Forecast Report
A
Sales Forecast Report Excel document is a tool that organizes historical sales data and projects future revenue based on trends and market analysis. It enables businesses to make informed decisions about inventory, budgeting, and resource allocation by providing clear insights into expected sales performance. Utilizing this report improves accuracy in financial planning and helps optimize strategic sales initiatives.
Returned Goods Analysis
The
Returned Goods Analysis Excel document systematically tracks product returns, identifying trends in return reasons, dates, and customer feedback. It helps businesses pinpoint quality issues, optimize inventory management, and improve customer satisfaction by providing clear insights into product performance. This analysis supports data-driven decisions that reduce return rates and enhance overall operational efficiency.
Sales by Industry
The
Sales by Industry Excel document organizes revenue data across various sectors, enabling businesses to analyze market performance and identify growth opportunities. It facilitates trend tracking, competitive analysis, and strategic planning by providing clear insights into industry-specific sales patterns. This tool is essential for making data-driven decisions and optimizing sales strategies tailored to different market segments.
Sales Incentive Report
A
Sales Incentive Report Excel document tracks sales performance metrics and commission calculations, enabling businesses to monitor employee progress against targets. This report provides clear visibility into incentive structures, helping motivate sales teams and align their goals with company objectives. Using this data-driven tool promotes transparency and aids in making informed decisions to optimize sales strategies.
Order Status Summary
An
Order Status Summary Excel document provides a comprehensive overview of the current state of all customer orders, including details like order dates, shipment status, and delivery timelines. This summary helps businesses track progress, identify delays, and optimize inventory management by consolidating crucial order information in one place. Using this document enables efficient decision-making and improves communication across sales, logistics, and customer service teams.
Lead Conversion Report
The
Lead Conversion Report Excel document tracks the progression of potential customers through various sales stages, highlighting the effectiveness of marketing campaigns and sales strategies. By analyzing conversion rates and identifying bottlenecks, businesses can optimize lead nurturing processes and improve overall sales performance. This report provides actionable insights that enhance decision-making, enabling companies to allocate resources efficiently and increase revenue.
Repeat Customer Rate
The
Repeat Customer Rate Excel document is a tool designed to track and analyze the percentage of customers who make multiple purchases over a specific period. This metric helps businesses understand customer loyalty and the effectiveness of retention strategies. By leveraging this data, companies can optimize marketing efforts, improve customer experience, and increase overall revenue.
Profit Margin Report
A
Profit Margin Report Excel document is a spreadsheet tool designed to calculate and analyze the profitability of products, services, or overall business operations by displaying revenue, costs, and resulting profit margins. It helps businesses track financial performance, identify profitable and underperforming areas, and make data-driven decisions to maximize earnings. Using this report, companies can optimize pricing strategies, control expenses, and improve operational efficiency for better financial health.
Discounts and Promotions Impact
The
Discounts and Promotions Impact Excel document analyzes sales data to evaluate the effectiveness of various discount strategies and promotional campaigns. It helps businesses identify trends, measure revenue changes, and optimize marketing budgets by quantifying the direct impact of promotions on customer behavior. This tool enables informed decision-making to increase profitability and enhance competitive advantage.
New Product Sales
The
New Product Sales Excel document is a structured spreadsheet designed to track and analyze sales data for newly launched products. It helps businesses monitor sales performance, identify trends, and measure the success of product introductions through organized data entries and visual charts. Utilizing this document enhances decision-making by providing clear insights into product demand, customer preferences, and revenue growth opportunities.
Sales by Payment Method
The
Sales by Payment Method Excel document categorizes sales data based on various payment options such as credit cards, cash, digital wallets, and bank transfers. This segmentation allows businesses to analyze customer preferences, optimize payment processes, and identify trends for strategic decision-making. Tracking sales by payment method enhances financial accuracy, improves cash flow management, and supports targeted marketing efforts.
Customer Feedback Summary
A
Customer Feedback Summary Excel document consolidates customer opinions, ratings, and suggestions into a structured and easily analyzable format. It enables businesses to identify trends, measure satisfaction levels, and pinpoint areas requiring improvement. This organized data supports informed decision-making, enhances product development, and drives better customer experience strategies.
Sales Quotes and Proposals
A
Sales Quotes and Proposals Excel document serves as a structured tool to create, organize, and manage detailed pricing estimates and formal offers for potential customers. It simplifies tracking product or service costs, discounts, taxes, and terms, ensuring accuracy and professionalism in client communications. This document enhances sales efficiency by allowing quick customization, comparison, and generation of consistent proposals that support closing deals effectively.
Seasonal Sales Trends
The
Seasonal Sales Trends Excel document tracks and analyzes fluctuations in sales data across different seasons, helping businesses identify peak periods and slow months. By visualizing patterns through charts and pivot tables, it enables informed inventory management and targeted marketing strategies. This tool supports optimizing resource allocation and improving overall revenue forecasting accuracy.
Sales Funnel Analysis
Sales Funnel Analysis Excel document is a powerful tool designed to track and visualize the customer journey through different sales stages, from lead generation to conversion. It helps businesses identify bottlenecks, measure conversion rates, and optimize marketing strategies based on data-driven insights. Using this Excel template enhances decision-making by providing a clear view of sales performance metrics and improving overall revenue growth.
Market Segment Sales
The
Market Segment Sales Excel document organizes sales data by distinct customer groups, enabling businesses to identify trends and performance within specific market segments. By analyzing this segmented data, companies can tailor marketing strategies, improve product offerings, and allocate resources more effectively to maximize revenue. This tool enhances decision-making by providing clear insights into which segments drive sales growth and which require further attention.
Sales Opportunity Report
The
Sales Opportunity Report Excel document is a detailed record that tracks potential sales leads, including customer information, deal value, and sales stage. It provides valuable insights into sales pipeline performance, helping businesses prioritize leads and forecast revenue more accurately. Utilizing this report enhances decision-making by identifying high-value opportunities and optimizing sales strategies for increased conversion rates.
Introduction to Sales Report Formats in Excel
Sales report formats in Excel provide a structured way to analyze and present sales data efficiently. Using Excel enhances clarity and enables dynamic data visualization. The sales report format makes it easier to track business performance and trends.
Importance of an Effective Sales Report
An effective sales report allows businesses to make informed decisions by providing clear insights into sales trends and performance. It helps identify best-selling products and areas needing improvement. The effectiveness of a report directly impacts business strategy and growth.
Essential Components of an Excel Sales Report
Key components include sales data entries, summary tables, charts, and performance metrics. Each element contributes to better data organization and interpretation. A well-structured sales report ensures comprehensive and actionable information.
Setting Up Your Sales Data in Excel
Start by organizing sales data into columns such as dates, products, quantities, and revenue. Accurate data entry is critical for reliable reporting outcomes. Properly structured sales data forms the foundation of your report.
Step-by-Step Guide to Creating a Sales Report Format
Begin by inputting raw data, then use formulas and pivot tables to summarize information. Incorporate charts to visualize sales trends effectively. Following a clear step-by-step process simplifies report creation.
Must-Have Excel Functions for Sales Reporting
Functions like SUM, VLOOKUP, IF, and PivotTables are essential for manipulating and analyzing sales data. These tools automate calculations and enhance data accuracy. Mastering these Excel functions boosts report efficiency and insight.
Sample Sales Report Templates in Excel
Pre-designed templates provide a starting point for creating professional sales reports quickly. Templates often include customizable fields and visual aids. Utilizing a sales report template saves time and improves consistency.
Tips for Customizing Your Sales Report Format
Tailor your report to highlight key performance indicators most relevant to your business goals. Incorporate branding elements and adjust layout for readability. Customization of the sales report format enhances communication and relevance.
Common Mistakes to Avoid in Sales Report Formatting
Avoid cluttered designs, inaccurate data inputs, and neglecting regular updates. Overcomplicating the report can reduce clarity and usefulness. Preventing these common mistakes will ensure your report remains reliable and user-friendly.
Best Practices for Sharing and Analyzing Excel Sales Reports
Share reports via secure methods and format files compatible with your audience's software. Regularly review and discuss key data insights with stakeholders. Implementing best practices in sharing and analysis maximizes report impact on decision-making.