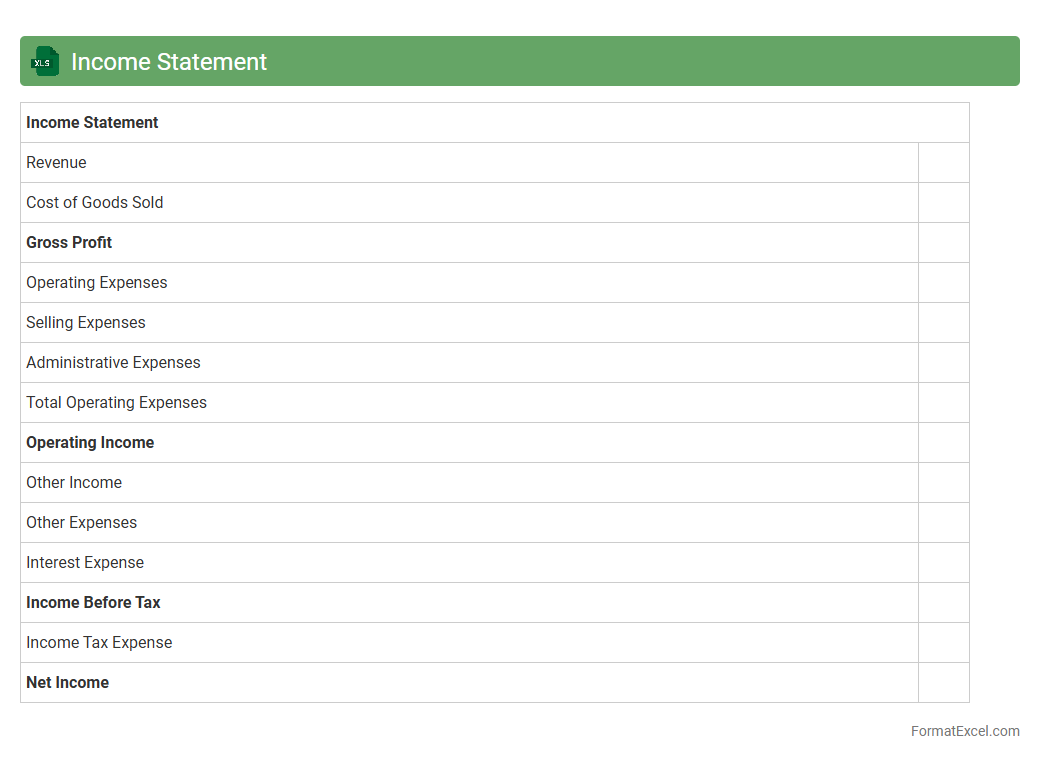
Income Statement
An
Income Statement Excel document is a digital spreadsheet designed to systematically record and analyze a company's revenues, expenses, and profit or loss over a specific period. It enables precise financial tracking and forecasting by automating calculations and consolidating data in an organized format. This tool is essential for businesses to evaluate financial performance, make informed decisions, and prepare reports for stakeholders.
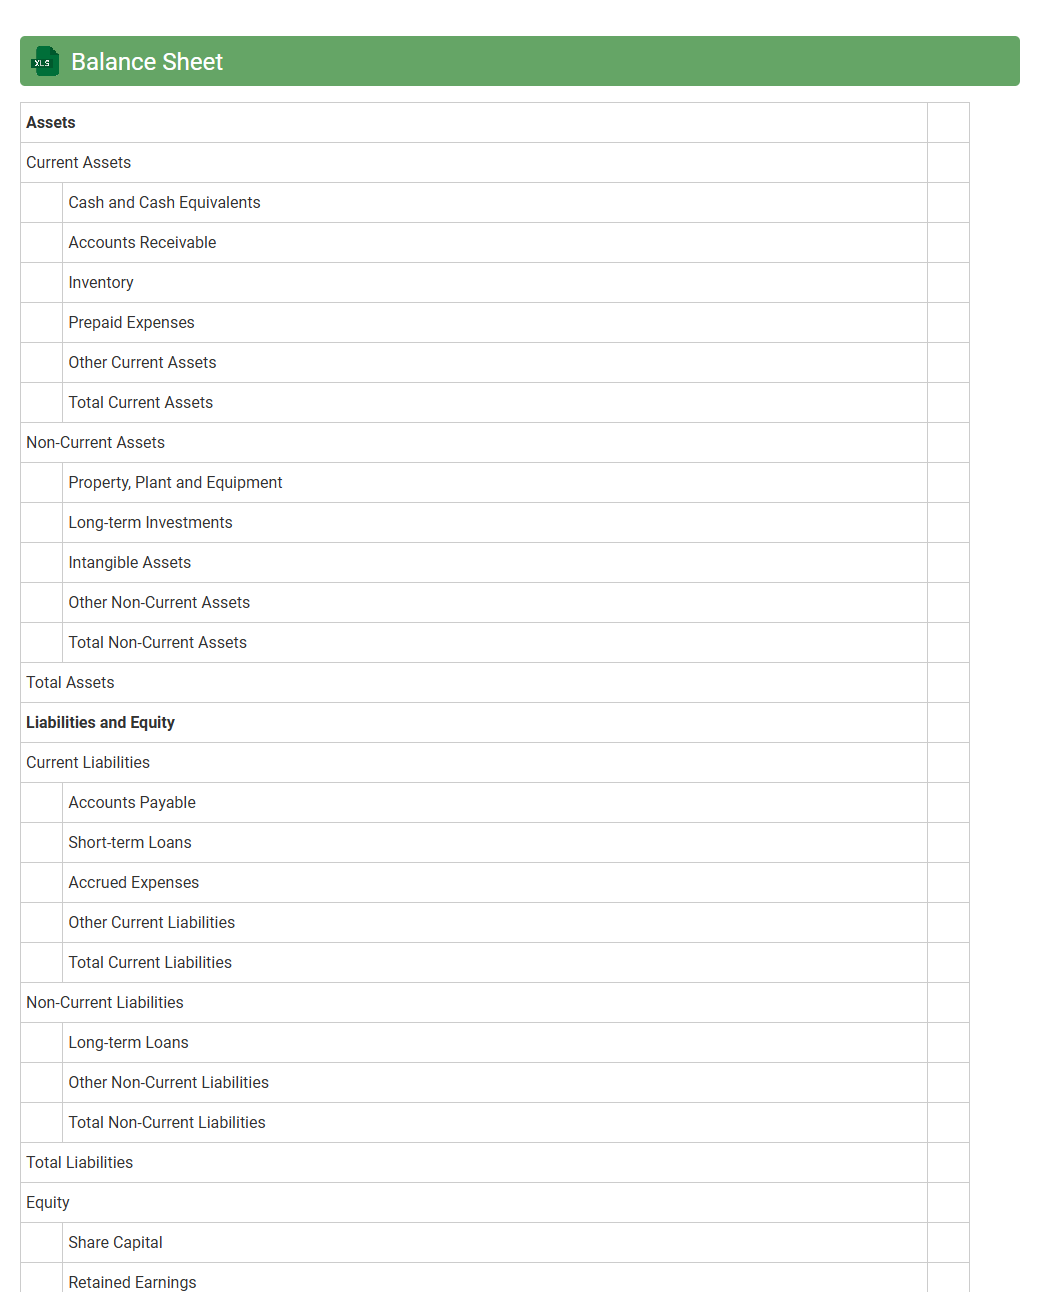
Balance Sheet
A
Balance Sheet Excel document is a financial tool that organizes and presents a company's assets, liabilities, and equity in a structured spreadsheet format. It allows users to quickly analyze financial health, track changes over time, and make informed business decisions by providing a clear snapshot of financial position. Using Excel's formulas and functions automates calculations, ensuring accuracy and efficiency in managing financial data.
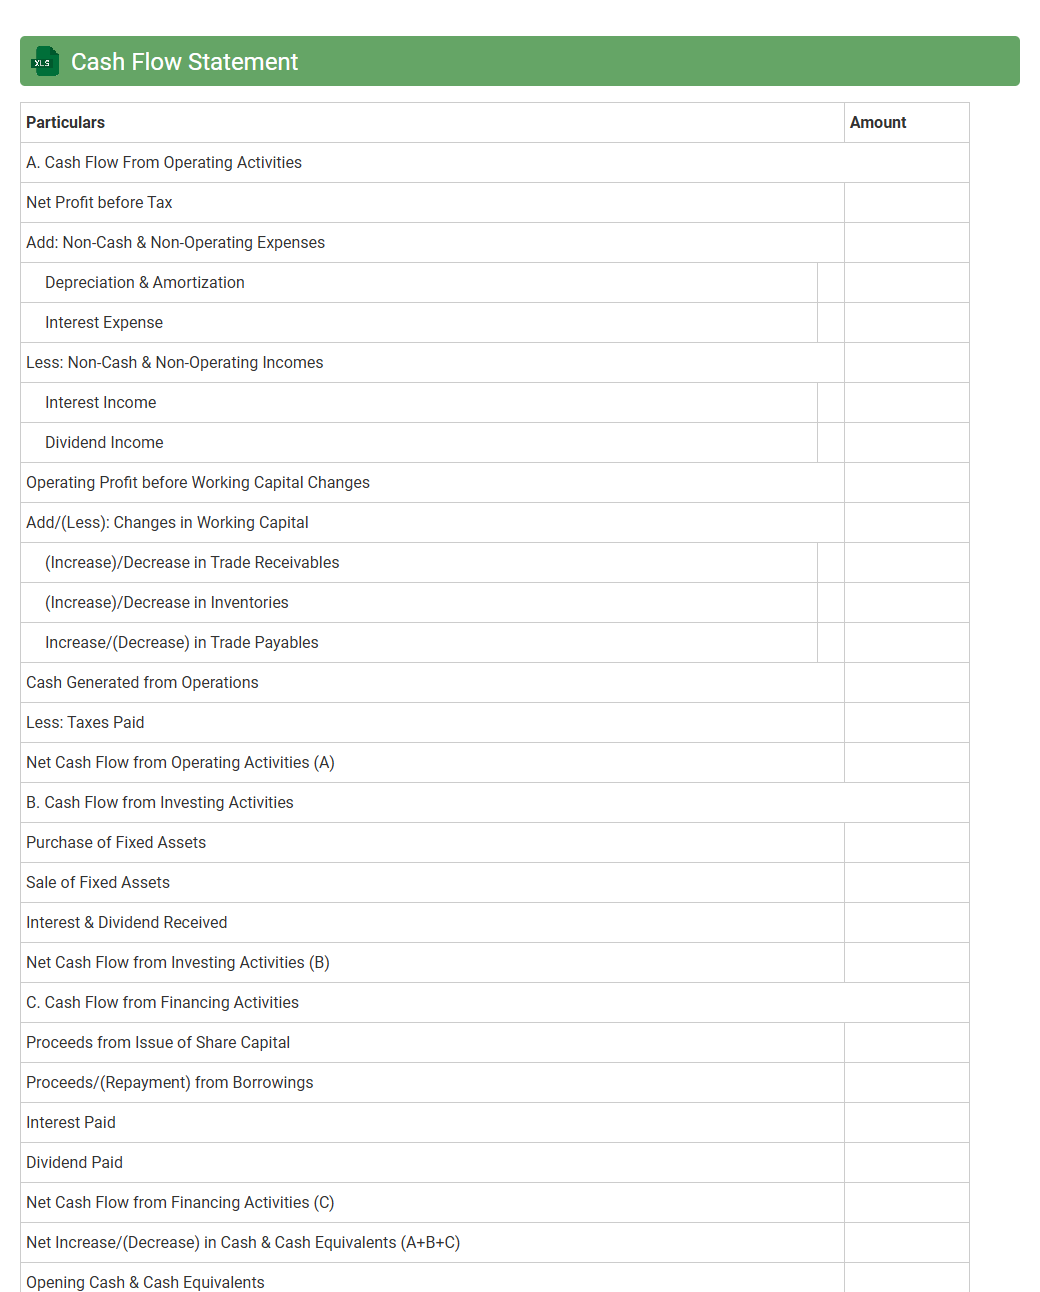
Cash Flow Statement
A
Cash Flow Statement Excel document is a financial tool that records and analyzes the inflows and outflows of cash within a business over a specific period. It helps track operational, investing, and financing activities, providing clear insights into liquidity and cash management. This document is essential for making informed decisions, budgeting accurately, and ensuring the business sustains healthy cash flow for growth.
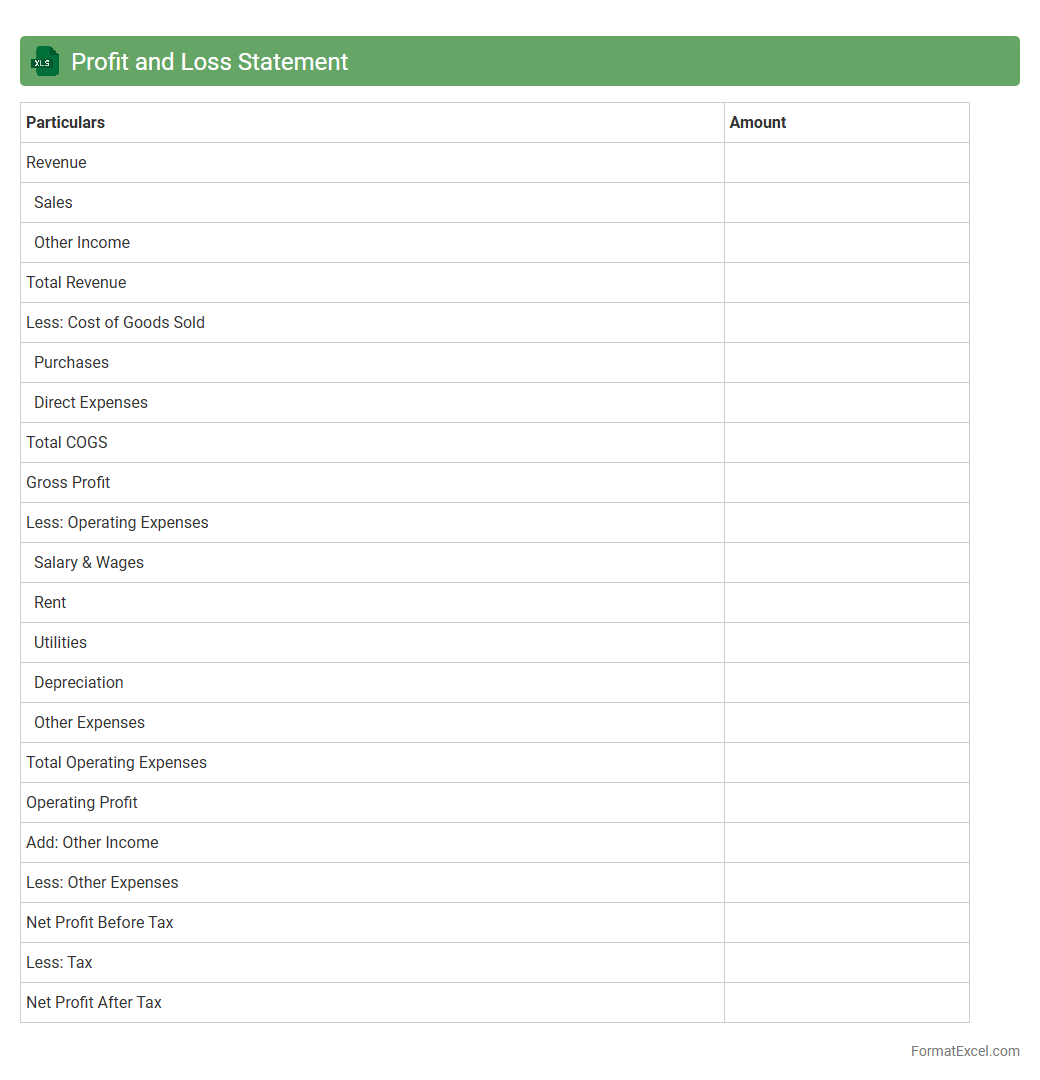
Profit and Loss Statement
A
Profit and Loss Statement Excel document is a financial report that summarizes revenues, costs, and expenses over a specific period, enabling businesses to assess their profitability. It allows users to input financial data and automatically calculates net profit or loss, supporting effective budget management and decision-making. This tool helps track financial performance, identify trends, and plan for future growth by providing clear visibility into income and expenditures.
Revenue Breakdown
The
Revenue Breakdown Excel document provides a detailed analysis of income sources, organizing data by product, service, region, or customer segment to identify key revenue drivers. This tool enables businesses to track financial performance, optimize resource allocation, and make informed strategic decisions based on precise revenue insights. Using this document enhances forecasting accuracy and supports effective budget planning by highlighting profitable areas and potential growth opportunities.
Expense Breakdown
An
Expense Breakdown Excel document systematically categorizes and itemizes all expenditures, providing clear visibility into spending patterns. It enables users to track costs, identify areas for budget optimization, and make informed financial decisions by analyzing detailed expense data. This tool is essential for efficient budget management and financial planning in both personal and professional contexts.
Gross Profit Analysis
A
Gross Profit Analysis Excel document is a financial tool designed to calculate and evaluate the difference between total revenue and the cost of goods sold (COGS). It helps businesses identify profitability trends, optimize pricing strategies, and manage production costs efficiently. By providing detailed insights into gross profit margins, this analysis supports informed decision-making to improve overall financial performance.
Net Profit Summary
The
Net Profit Summary Excel document consolidates revenue, expenses, and other financial data to calculate the net profit of a business over a specific period. It helps users quickly assess profitability and make informed financial decisions by providing a clear overview of income versus costs. This tool is essential for budgeting, forecasting, and monitoring financial health effectively.
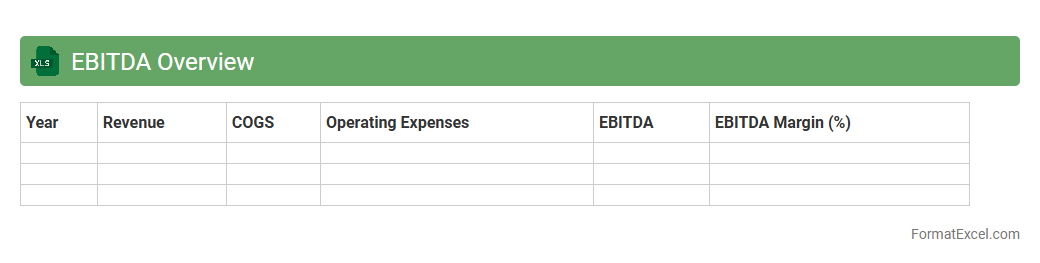
EBITDA Overview
An
EBITDA Overview Excel document is a financial tool designed to summarize a company's Earnings Before Interest, Taxes, Depreciation, and Amortization, providing a clear snapshot of operational profitability. This document allows users to analyze cash flow potential and compare performance across different periods or business units with ease. Utilizing this Excel sheet enhances decision-making by offering a structured, customizable format for tracking key financial metrics and supporting strategic planning.
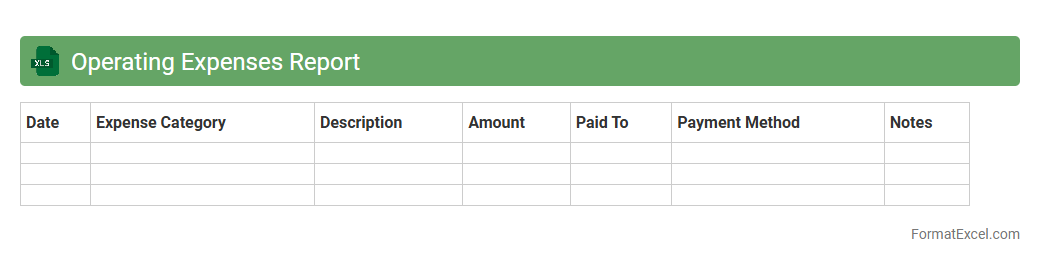
Operating Expenses Report
An
Operating Expenses Report Excel document is a financial tool that tracks and categorizes a company's day-to-day expenses such as salaries, utilities, rent, and supplies. This report helps businesses monitor spending patterns, control costs, and improve budgeting accuracy, ultimately contributing to more informed financial decisions. By providing a clear overview of operational costs, it aids in identifying areas for cost reduction and enhancing overall profitability.
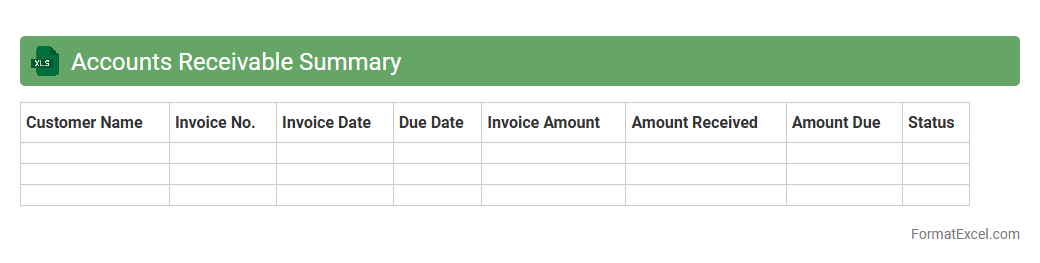
Accounts Receivable Summary
An
Accounts Receivable Summary Excel document consolidates all outstanding invoices and payments owed by customers, providing a clear snapshot of the company's receivables status. It allows businesses to track due dates, monitor cash flow, and identify overdue accounts, facilitating better credit management and timely collections. Using this summary improves financial forecasting and ensures more efficient accounts receivable processes, aiding in maintaining a steady working capital.
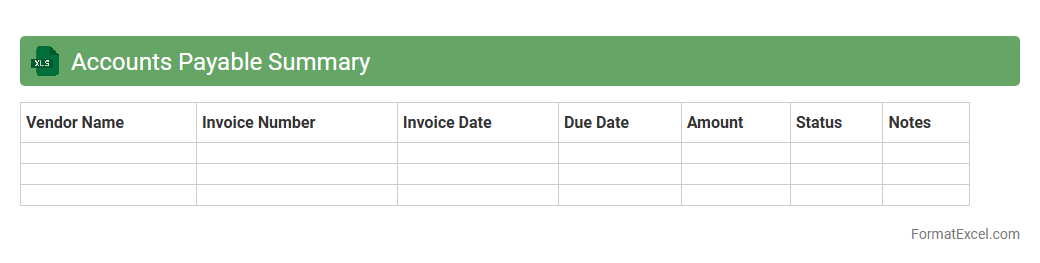
Accounts Payable Summary
An
Accounts Payable Summary Excel document consolidates all outstanding invoices and payment obligations owed by a company to its suppliers and vendors. It provides a clear overview of due dates, payment amounts, and vendor details, facilitating timely payments and preventing late fees. This summary enhances financial management by improving cash flow forecasting and ensuring accurate tracking of business liabilities.
Current Assets Overview
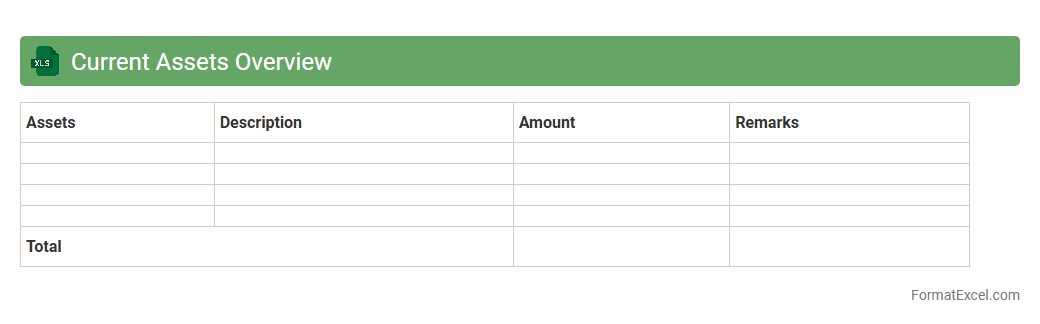
The
Current Assets Overview Excel document provides a detailed summary of a company's short-term assets, including cash, accounts receivable, and inventory, essential for assessing liquidity and operational efficiency. It enables businesses to monitor and manage assets that are expected to be converted into cash within one fiscal year, facilitating better financial planning and decision-making. By organizing and analyzing current assets data, the document helps improve cash flow management, optimize resource allocation, and support strategic budgeting processes.
Current Liabilities Overview
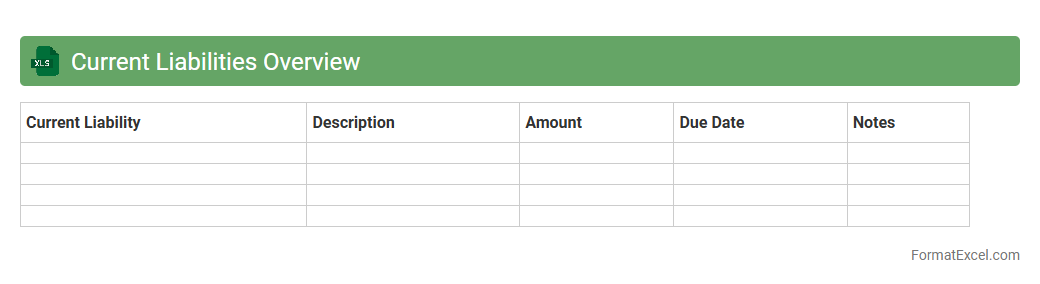
The
Current Liabilities Overview Excel document provides a detailed summary of an organization's short-term financial obligations, including accounts payable, accrued expenses, and short-term debts. It helps businesses track and manage their immediate liabilities, ensuring proper cash flow management and aiding in financial decision-making. By offering clear insights into upcoming payments, this document supports accurate budgeting and enhances overall financial stability.
Equity Summary
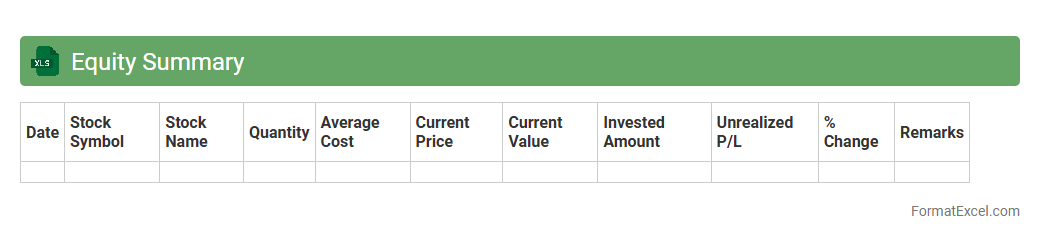
An
Equity Summary Excel document consolidates shareholder equity data, including stock issuance, retained earnings, and dividends, providing a clear overview of a company's financial ownership structure. It is useful for tracking changes in equity over time, supporting accurate financial analysis and decision-making. This tool enables businesses to monitor capital contributions and assess the impact of financial activities on stakeholder value.
Budget vs Actual Comparison
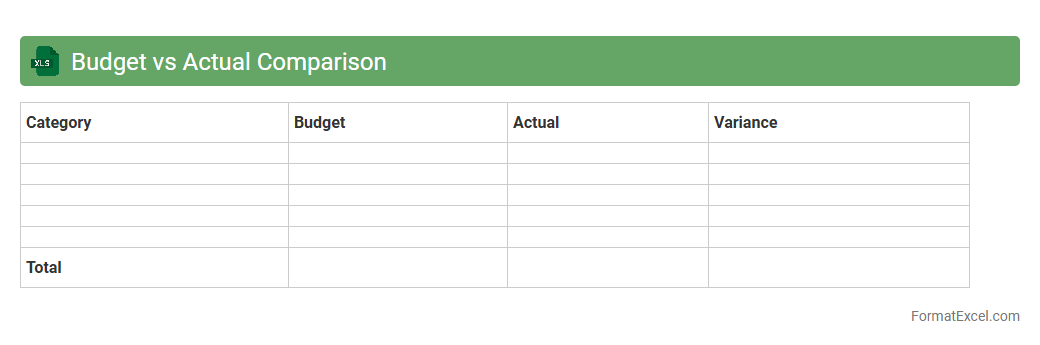
A
Budget vs Actual Comparison Excel document tracks planned financial targets against actual expenditures, highlighting variances in income and costs. It helps businesses and individuals monitor performance, control spending, and make informed decisions to improve financial management. By identifying discrepancies, users can adjust strategies to enhance profitability and efficiency.
Year-over-Year Financial Summary
A
Year-over-Year Financial Summary Excel document consolidates financial data from multiple years to highlight trends and performance changes over time. It enables businesses to compare key metrics such as revenue, expenses, and profit margins across different fiscal periods, facilitating informed decision-making. This tool is essential for identifying growth patterns, budgeting effectively, and forecasting future financial outcomes based on historical data.
Quarterly Financial Summary
A
Quarterly Financial Summary Excel document consolidates key financial data such as revenue, expenses, profit margins, and cash flow for a three-month period. It enables businesses to track performance trends, compare results against forecasts, and identify areas needing financial adjustments. This summary supports informed decision-making by providing a clear, organized snapshot of financial health over each quarter.
Variance Analysis
Variance Analysis in an Excel document is a powerful financial tool used to compare actual performance against budgeted or planned figures, highlighting differences in costs, revenues, or other key metrics. It enables businesses to identify areas where performance deviates from expectations, facilitating informed decision-making and effective cost control. The
Variance Analysis Excel template streamlines data organization and visualization, making it easier to track, analyze, and report financial discrepancies accurately.
Capital Expenditure Report
A
Capital Expenditure Report Excel document is a detailed financial tool that tracks and analyzes an organization's spending on long-term assets such as equipment, property, and infrastructure. It helps businesses plan budgets, monitor investment performance, and ensure compliance with financial goals. Using this report enhances decision-making by providing clear visibility into capital allocation and forecasting future capital needs.
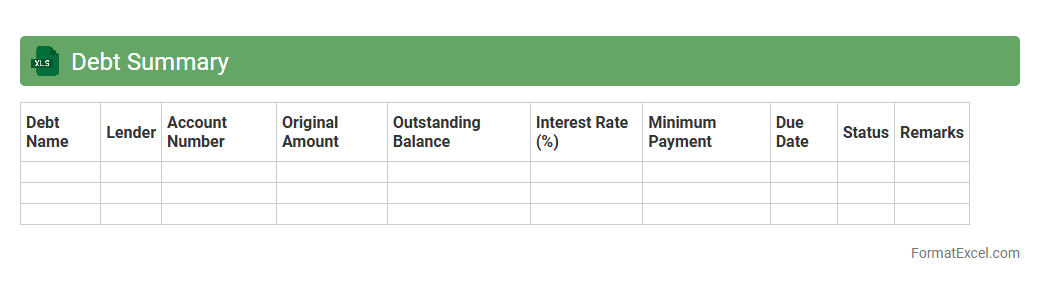
Debt Summary
A
Debt Summary Excel document is a tool designed to compile and organize all outstanding debts in a structured format, including details like creditors, balances, interest rates, and payment due dates. It enables users to track their liabilities efficiently, evaluate financial obligations, and plan repayment strategies more effectively. By consolidating debt information, it supports better decision-making and enhances financial management.
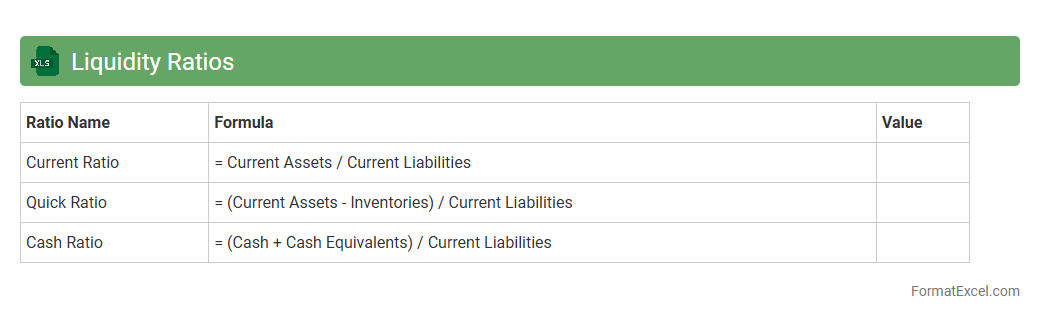
Liquidity Ratios
The
Liquidity Ratios Excel document is a financial tool designed to calculate and analyze key liquidity metrics such as the current ratio, quick ratio, and cash ratio using company financial data. It helps assess a business's ability to meet short-term liabilities, ensuring effective cash flow management and financial stability. By providing clear, automated calculations, this Excel sheet supports informed decision-making and risk assessment for investors and management.
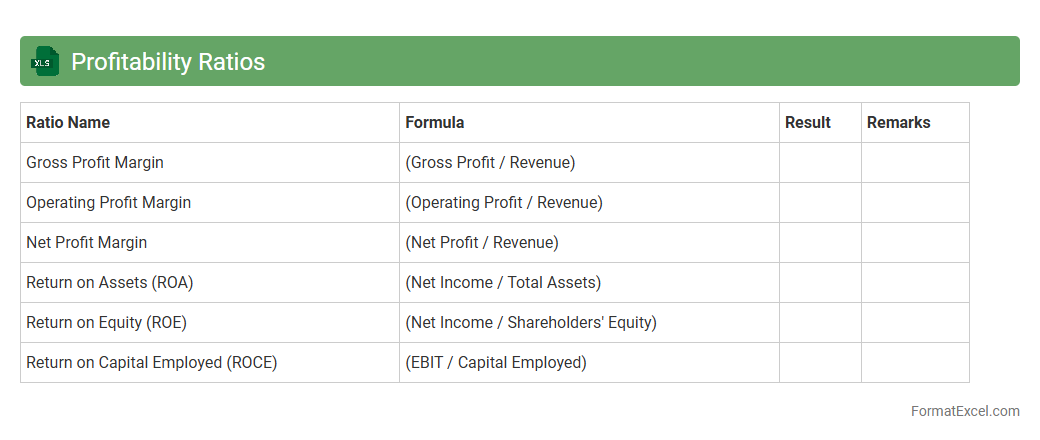
Profitability Ratios
A
Profitability Ratios Excel document is a spreadsheet tool designed to calculate and analyze key financial metrics such as net profit margin, return on assets, and return on equity. It helps businesses assess their ability to generate earnings relative to sales, assets, and shareholders' equity, offering clear insights into financial health. By using this document, companies can make informed decisions to improve operational efficiency and enhance overall profitability.
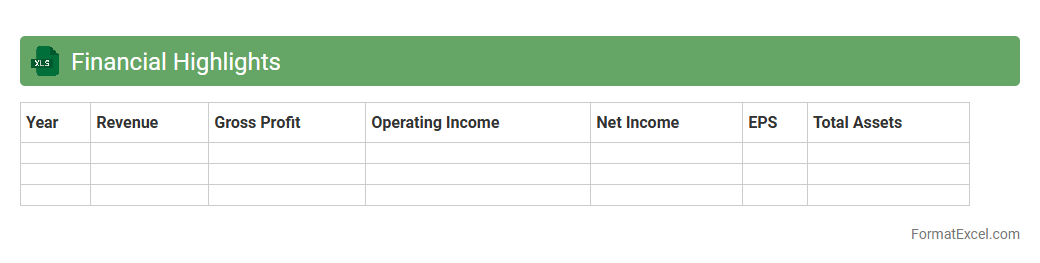
Financial Highlights
A
Financial Highlights Excel document is a structured spreadsheet that consolidates key financial metrics such as revenue, profit margins, expenses, and cash flow for quick analysis. It enables businesses and investors to monitor performance trends, compare fiscal periods, and make data-driven decisions efficiently. By organizing critical financial data in one place, it improves accuracy, transparency, and strategic financial planning.
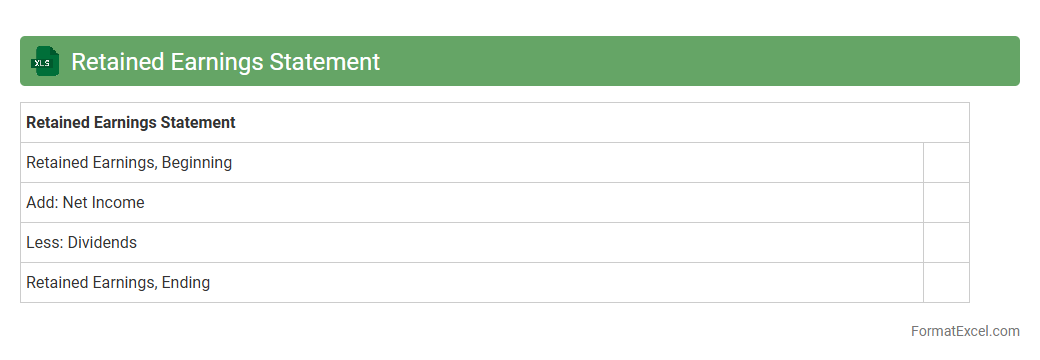
Retained Earnings Statement
A
Retained Earnings Statement Excel document tracks a company's accumulated net income retained rather than distributed as dividends, allowing for clear visualization of financial growth over time. It is useful for investors and management to assess how much profit has been reinvested in the business, supporting strategic decisions and financial planning. This document enhances transparency by providing detailed insight into changes in retained earnings during a specific period, aiding in accurate financial reporting and analysis.
Introduction to Financial Summary Format in Excel
A financial summary format in Excel helps organize key financial data efficiently. It provides a snapshot view of revenues, expenses, and profits. Excel's grid layout is ideal for summarizing financial information clearly.
Key Components of a Financial Summary
Core elements include revenue, expenses, net profit, and cash flow. Each component must be accurately represented for meaningful analysis. Using financial indicators ensures comprehensive reporting.
Setting Up Your Excel Worksheet
Begin with defining clear headers and categorizing financial data by type and period. Use separate columns for dates, descriptions, amounts, and totals. Proper worksheet structure supports easy data entry and analysis.
Essential Excel Functions for Financial Summaries
Functions like SUM, AVERAGE, and IF are vital to process financial data efficiently. These formulas automate calculations and reduce errors. Mastery of Excel functions enhances financial summary accuracy.
Sample Table Structures for Financial Data
A typical table includes rows for transactions and columns for date, description, amount, and category. Using filters and tables simplifies data review. Structured financial tables improve data clarity.
Formatting Tips for Readable Financial Reports
Apply consistent fonts, borders, and shading to differentiate sections. Use currency formatting and conditional formatting to highlight key metrics. Effective formatting techniques boost report readability.
Automating Calculations with Excel Formulas
Link cells with formulas to automatically update totals when new data is added. Use relative and absolute cell references wisely for dynamic calculations. Automation through Excel formulas saves time and ensures accuracy.
Visualizing Financial Data with Excel Charts
Graphs like bar, pie, and line charts help summarize trends and comparisons visually. Charts highlight performance metrics and financial health intuitively. Leveraging Excel charts supports impactful presentations.
Downloadable Financial Summary Excel Templates
Templates offer pre-designed layouts for quick financial report creation. Many available templates include built-in formulas and formatting. Using Excel templates accelerates the reporting process.
Best Practices for Accurate Financial Reporting
Regularly update data, double-check entries, and maintain backup copies. Implement version control and audit trails for transparency. Following best reporting practices ensures data integrity and compliance.