Stock Price History
A
Stock Price History Excel document records the past trading prices of stocks, including opening, closing, high, and low prices for specific dates. It helps investors analyze trends, identify patterns, and make informed decisions based on historical market performance. Utilizing this data allows for better risk management and strategic portfolio adjustments.
Dividend Yield Analysis
Dividend Yield Analysis Excel document provides a structured method to evaluate the
dividend yield of various stocks by calculating the ratio of dividends paid to the current share price. This analysis helps investors identify high-yield stocks, assess income potential, and make informed decisions about portfolio diversification. It also enables tracking of historical dividend trends, enhancing the ability to forecast future returns and manage investment risk effectively.
Moving Average Calculation
A
Moving Average Calculation Excel document is a tool designed to smooth out data fluctuations by averaging a set number of data points over a specific period, helping to identify trends. It is useful for analyzing financial data, sales figures, or any time series data to predict future performance and reduce noise from random variations. This document aids in decision-making by providing clear insights into long-term movement and patterns within the dataset.
Relative Strength Index
The
Relative Strength Index (RSI) Excel document is a tool designed to calculate and visualize RSI values for financial assets, aiding in the analysis of market momentum and potential price reversals. It uses historical price data to generate RSI figures, enabling traders and analysts to identify overbought or oversold conditions, which helps in making informed trading decisions. This document streamlines technical analysis by providing dynamic charts and automated computations within Excel, making it accessible and practical for both beginners and experts.
Earnings Per Share Trend
The
Earnings Per Share Trend Excel document tracks the fluctuations of a company's EPS over multiple periods, providing a clear visualization of financial performance and profitability trends. It helps investors and analysts make informed decisions by identifying growth patterns, potential risks, and the company's ability to generate profits for shareholders. This tool also supports forecasting future earnings and comparing performance across different companies or industries.
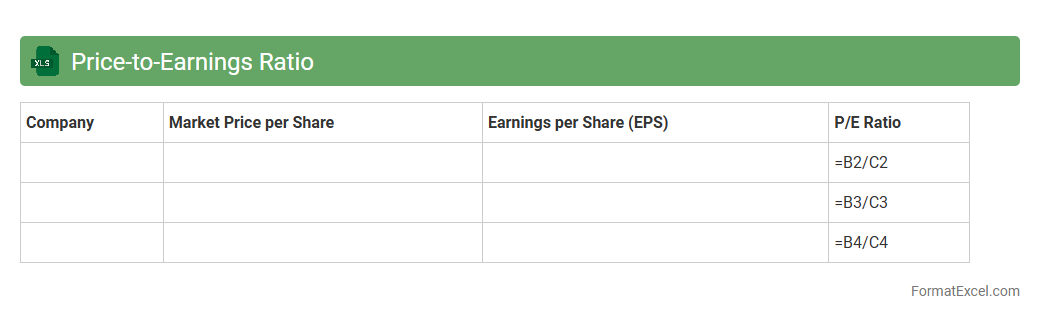
Price-to-Earnings Ratio
A
Price-to-Earnings Ratio Excel document is a spreadsheet tool designed to calculate and analyze the P/E ratio of various stocks by dividing the market price per share by earnings per share. It helps investors quickly assess the valuation of companies, compare stocks within the same industry, and make informed investment decisions based on historical or real-time financial data. By automating these calculations, the Excel document streamlines the evaluation process and supports strategic portfolio management.
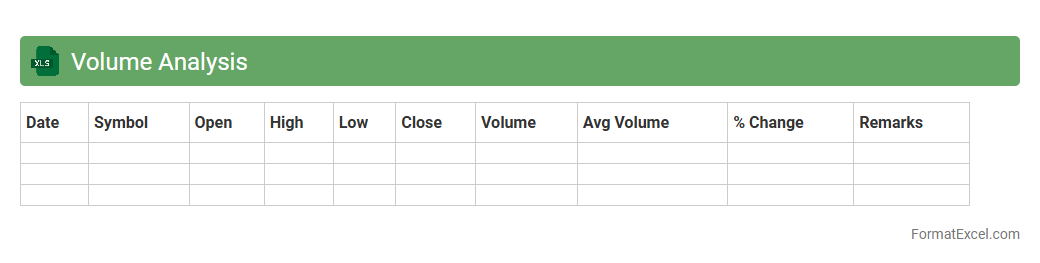
Volume Analysis
Volume Analysis Excel document is a powerful tool designed to organize, evaluate, and visualize data related to sales, production, or transaction volumes. It helps identify patterns, trends, and anomalies by enabling users to manipulate large datasets efficiently using formulas, pivot tables, and charts. By leveraging
Volume Analysis, businesses can make informed decisions to optimize inventory, forecast demand, and improve overall operational efficiency.
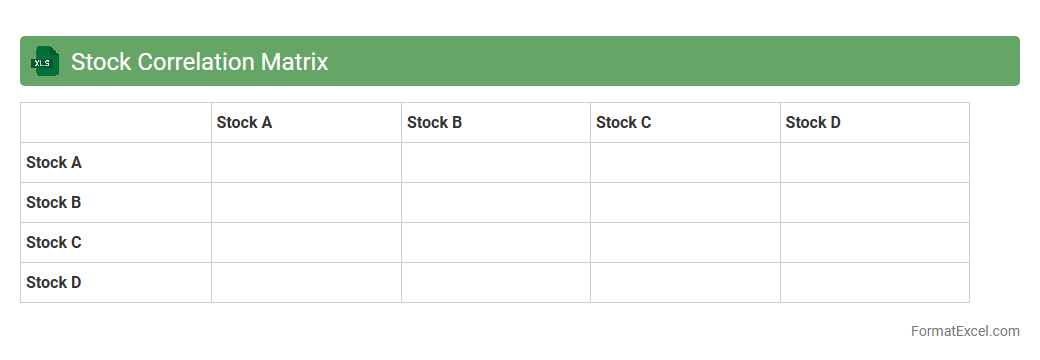
Stock Correlation Matrix
A
Stock Correlation Matrix Excel document displays the correlation coefficients between multiple stocks, helping investors understand the degree to which stock prices move in relation to each other. This matrix is essential for portfolio diversification, risk management, and identifying stocks with similar or opposite price movements. By analyzing these correlations, users can make informed decisions to optimize asset allocation and minimize potential losses.
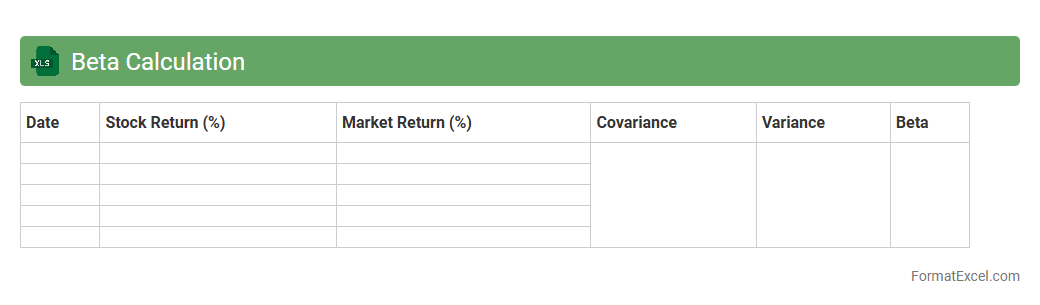
Beta Calculation
A
Beta Calculation Excel document is a financial tool designed to measure the volatility of a stock or portfolio relative to the overall market, typically using historical price data. It helps investors assess risk by quantifying how sensitive an asset's returns are compared to market movements, enabling better-informed decisions in portfolio management and asset allocation. By identifying the beta coefficient, users can optimize investment strategies to balance risk and potential returns effectively.
Support and Resistance Levels
A
Support and Resistance Levels Excel document is a tool that helps traders and investors identify key price points on a chart where an asset tends to stop and reverse, indicating potential buying or selling pressure. This document organizes historical price data and automatically calculates these crucial levels to inform strategic decisions. By analyzing these levels, users can optimize entry and exit points for trades, improving their chances of maximizing profits and minimizing losses.
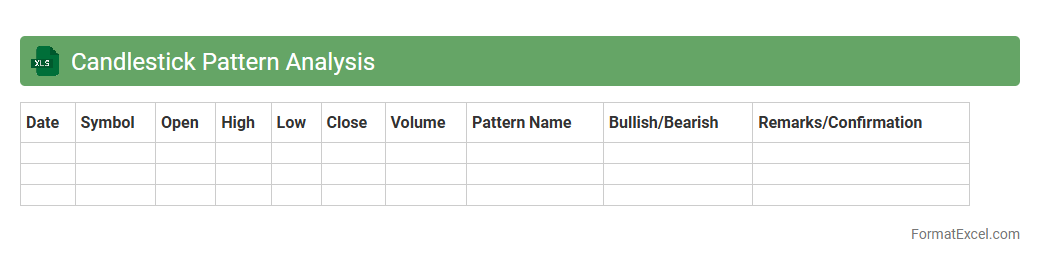
Candlestick Pattern Analysis
The
Candlestick Pattern Analysis Excel document is a powerful tool that organizes and interprets historical price data to identify key trading patterns and trends. By visually representing bullish and bearish signals through formatted cells, it helps traders make informed decisions based on market sentiment and price action. This analysis enhances risk management and strategy development by providing clear, data-driven insights into potential market movements.
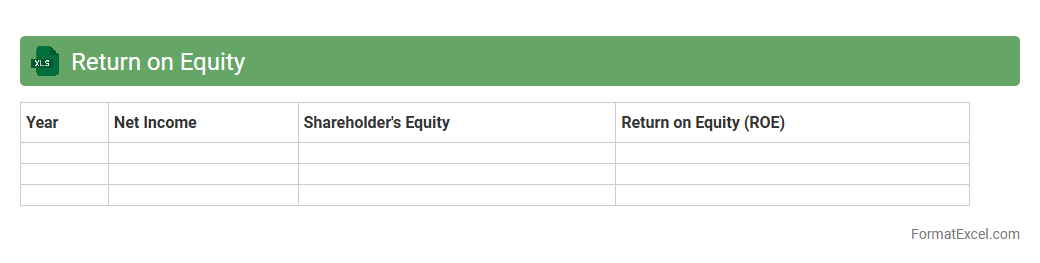
Return on Equity
A
Return on Equity (ROE) Excel document is a financial tool designed to calculate and analyze the profitability of a company relative to its shareholders' equity. It helps investors and management assess how effectively a firm is using equity investment to generate profits by breaking down net income and equity components in an organized spreadsheet format. This document is useful for making informed decisions on investment performance, comparing companies, and optimizing business strategies based on efficient equity utilization.
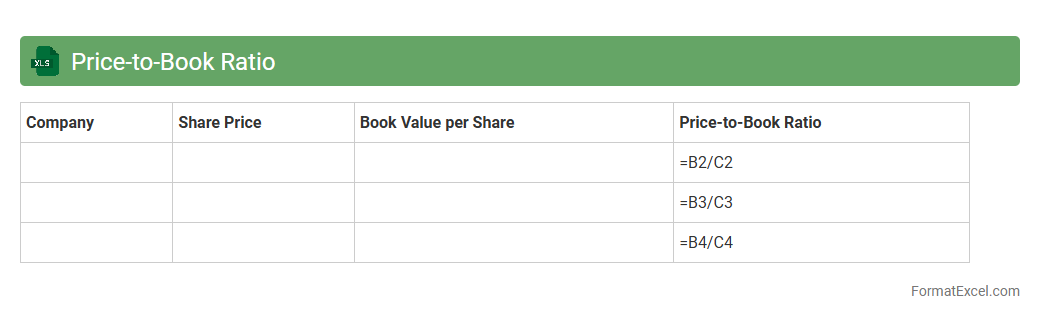
Price-to-Book Ratio
A
Price-to-Book Ratio Excel document is a financial tool designed to calculate and analyze the price-to-book (P/B) ratio of various companies by comparing their market price per share to their book value per share. This spreadsheet helps investors easily identify undervalued or overvalued stocks, enhancing investment decision-making with clear, organized data. By tracking the P/B ratio, users can assess a company's intrinsic value relative to its market price, providing critical insights for portfolio management and risk assessment.
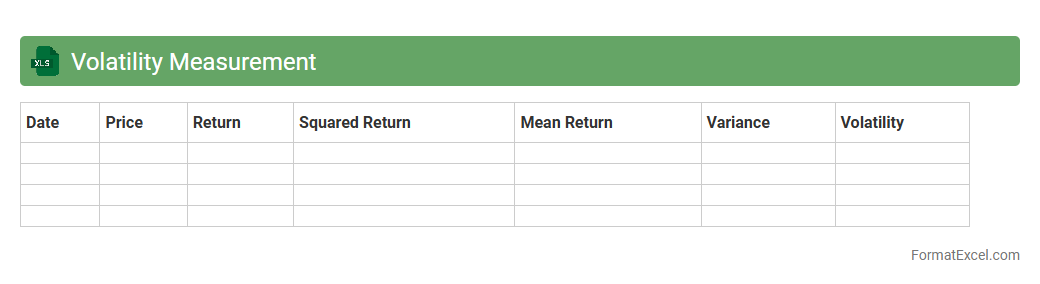
Volatility Measurement
The
Volatility Measurement Excel document is a tool designed to analyze and quantify the fluctuations in asset prices or financial instruments over a specific period. It helps investors and traders assess risk by calculating metrics such as standard deviation, variance, and price range, enabling informed decision-making. Utilizing this document enhances portfolio management by providing a clear insight into market volatility and potential investment stability.
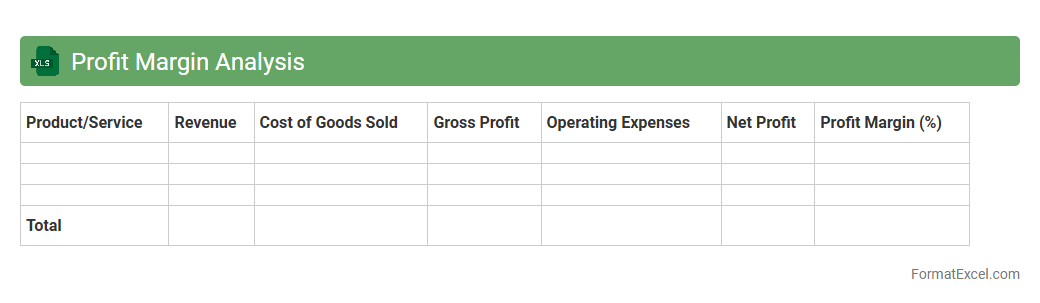
Profit Margin Analysis
Profit Margin Analysis Excel document is a powerful financial tool that calculates and visualizes key profit margins such as gross, operating, and net profit margins to evaluate a company's profitability. This document helps businesses identify cost efficiency, pricing strategies, and profit trends by providing detailed insights into revenue and expense relationships. Utilizing a
Profit Margin Analysis Excel allows decision-makers to optimize financial performance and make informed strategic plans based on accurate, data-driven profit metrics.
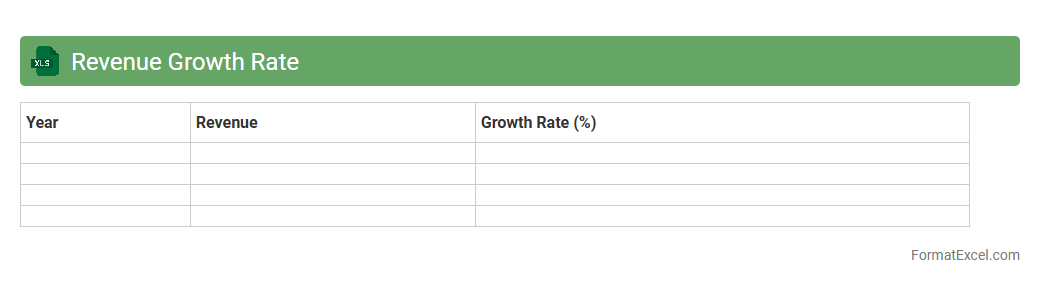
Revenue Growth Rate
A
Revenue Growth Rate Excel document is a spreadsheet tool designed to calculate the percentage increase in a company's revenue over specific periods, enabling businesses to track their financial performance efficiently. By inputting sales data and timeframes, the document automatically generates growth rates, helping in forecasting and strategic planning. This tool is essential for identifying trends, making data-driven decisions, and driving sustainable business expansion.
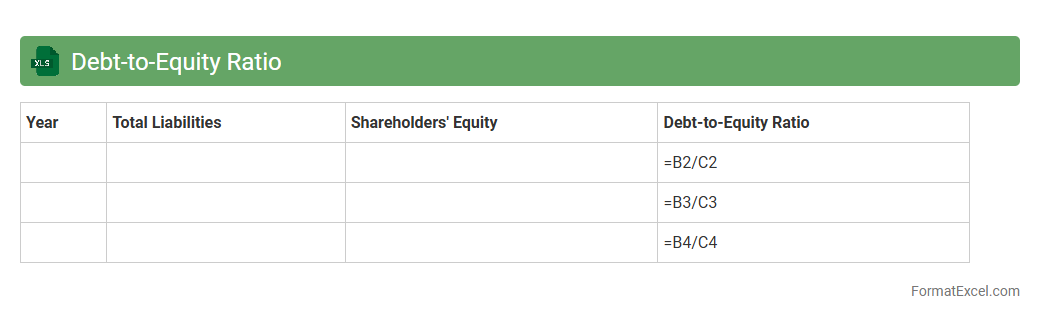
Debt-to-Equity Ratio
The
Debt-to-Equity Ratio Excel document is a financial tool used to calculate and analyze a company's financial leverage by comparing its total liabilities to shareholder equity. It helps investors, analysts, and managers assess the risk level and capital structure efficiency of a business by providing clear, organized data for quick decision-making. Utilizing this Excel sheet enables accurate tracking of debt relative to equity, essential for strategic planning, budgeting, and optimizing financial performance.
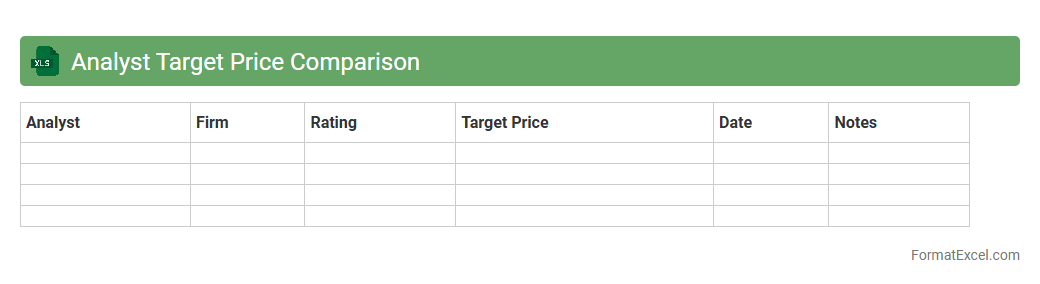
Analyst Target Price Comparison
The
Analyst Target Price Comparison Excel document compiles estimated future stock prices from multiple financial analysts, allowing investors to gauge market expectations and identify consensus price targets. By comparing these diverse forecasts, users can assess the potential risk and reward of a stock more effectively, aiding in making well-informed investment decisions. This tool streamlines data analysis by presenting projected price variations in a clear, organized format for quick reference and strategic planning.
Ex-Dividend Date Tracker
Ex-Dividend Date Tracker Excel document is a
financial tool that records and monitors the ex-dividend dates of stocks, helping investors identify when shares must be purchased to qualify for dividends. It organizes data such as company names, dividend amounts, and payment dates, providing a clear overview of upcoming dividend events. This tracker enhances decision-making by ensuring timely investments and optimizing dividend income strategies.
52-Week High/Low Tracker
The
52-Week High/Low Tracker Excel document is a tool designed to monitor the highest and lowest prices of stocks over the past year, helping investors identify market trends and price volatility. It allows users to quickly assess stock performance by highlighting critical price points, aiding in making informed buy or sell decisions. This tracker enhances portfolio management by providing clear visual insights into price fluctuations within a specific time frame.
Historical Volatility
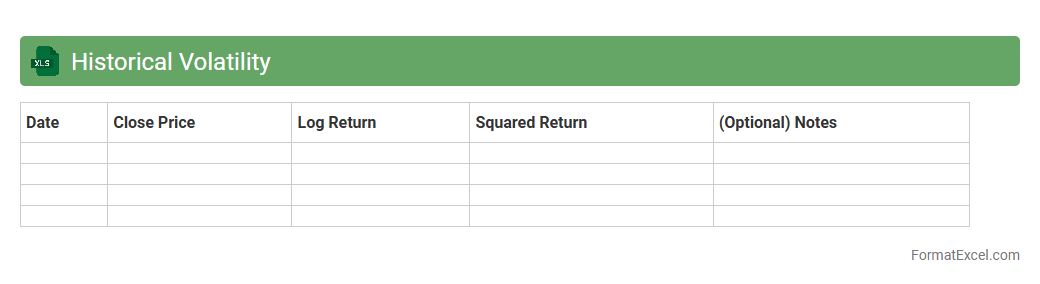
The
Historical Volatility Excel document calculates the statistical measure of price fluctuations for a specific asset over a defined period, based on past market data. This tool helps investors and analysts assess risk, identify price trends, and make informed decisions by quantifying market uncertainty. Utilizing the document enhances portfolio management strategies by providing insights into potential price movements and volatility patterns.
Insider Trading Activity
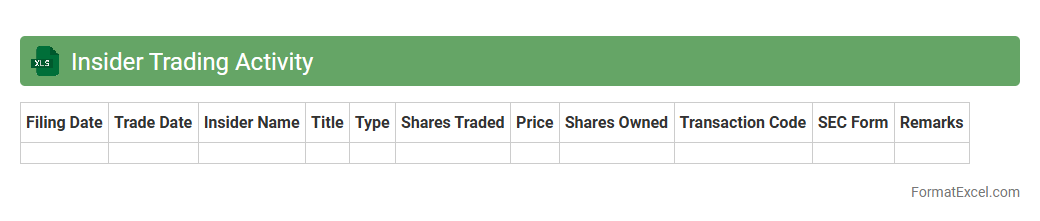
The
Insider Trading Activity Excel document is a comprehensive spreadsheet that tracks the buying and selling of stocks by company insiders such as executives, directors, and key shareholders. This document is useful for investors and analysts as it provides valuable insights into market sentiment, potential stock movements, and the confidence level of those with intimate knowledge of the company. By analyzing insider transactions, users can make more informed decisions and identify investment opportunities based on insider behavior.
Market Capitalization Trend
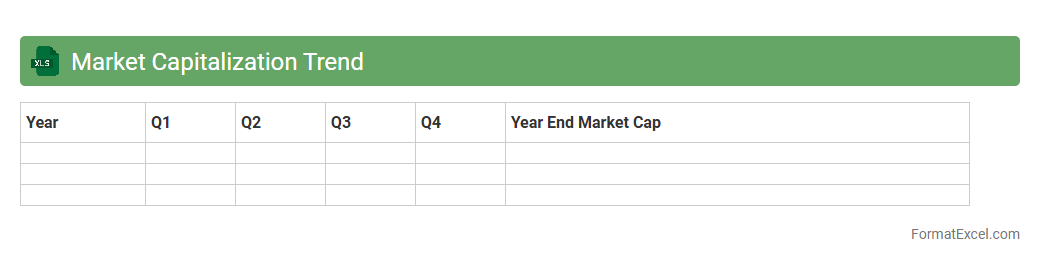
The
Market Capitalization Trend Excel document tracks the changes in a company's market value over time by analyzing stock price and outstanding shares. This data-driven tool enables investors and analysts to identify growth patterns, compare market performance, and make informed decisions. It is useful for forecasting future trends and assessing the financial health of businesses within various industries.
Short Interest Ratio
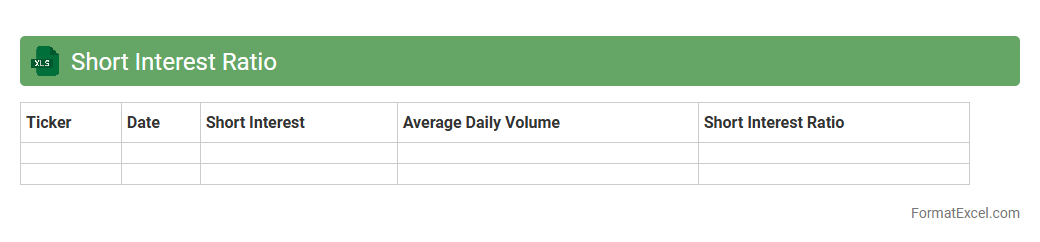
A
Short Interest Ratio Excel document is a spreadsheet tool that tracks the number of shares shorted relative to the average daily trading volume of a stock, helping investors gauge market sentiment and potential price movements. This ratio highlights stocks with significant short-selling activity, indicating potential bearish sentiment or upcoming short squeezes. Using such a document aids in making informed trading decisions, managing risk, and timing entry or exit points effectively in stock markets.
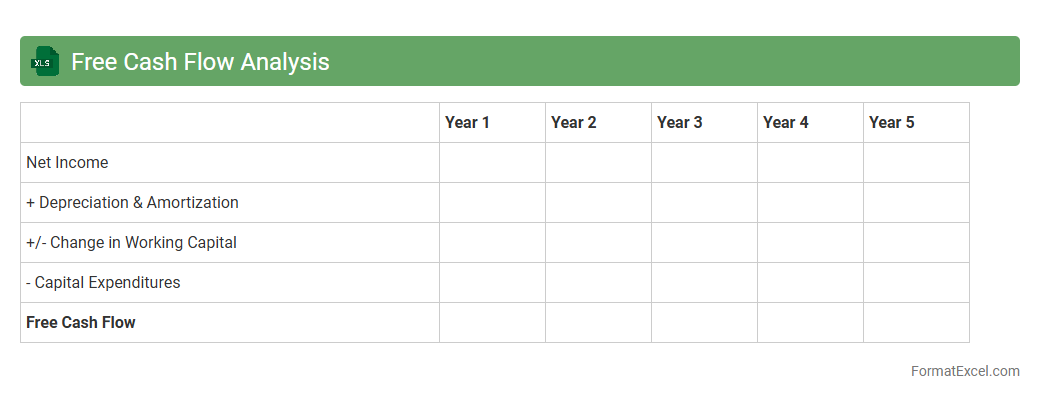
Free Cash Flow Analysis
A
Free Cash Flow Analysis Excel document is a financial tool used to evaluate a company's liquidity by measuring the cash generated after capital expenditures. This analysis helps investors and managers understand the actual cash available for expansion, debt repayment, or dividends, providing insight into financial health and operational efficiency. Utilizing this document enables more informed decision-making by highlighting cash flow trends and forecasting future financial stability.
Introduction to Stock Analysis in Excel
Stock analysis in Excel allows investors to systematically evaluate market data and make informed decisions. Excel provides versatile tools to organize, calculate, and visualize stock performance. Using Excel for analysis offers a customizable approach compared to fixed software.
Key Components of a Stock Analysis Template
A robust template includes sections for price data, fundamentals, technical indicators, and summary metrics. Inputs like stock ticker, dates, and volume are essential for accuracy. Well-structured templates streamline data entry and analysis processes.
Data Collection and Input Methods
Data can be imported via Excel's Data Import Wizard or connected APIs for live updates. Manual entry remains useful for tailored datasets or offline analysis. Structured input ensures reliability and consistency across stocks analyzed.
Setting Up the Stock Data Sheet
The stock data sheet captures daily or historical prices, including open, high, low, close, and volume. Proper column headers and date formats are critical for seamless calculations. This sheet forms the foundation for all analytical functions in the workbook.
Fundamental Analysis Metrics
Key metrics such as Price-to-Earnings (P/E), Earnings Per Share (EPS), and Return on Equity (ROE) form the basis for fundamental stock evaluation. These values indicate the financial health and profitability of a company. Including formulas for ratio calculations enhances template automation.
Technical Analysis Tools and Formulas
Technical indicators like Moving Averages, RSI, and MACD are commonly applied in Excel using formulas and dynamic ranges. These tools help identify stock price trends and potential buying or selling points. Customizable formulas adapt to different analysis strategies.
Visualizing Data with Excel Charts
Charts such as line graphs, candlestick, and bar charts improve data interpretation by highlighting trends visually. Embedding interactive charts enables users to monitor real-time stock movements intuitively. Visual aids support quicker decision-making based on analysis.
Automating Calculations with Excel Functions
Using Excel functions like SUM, AVERAGE, VLOOKUP, and IF conditions automates complex stock computations. Automation reduces human error and enhances efficiency in updating analysis results. Incorporating dynamic formulas helps maintain accuracy with changing data.
Interpreting Stock Analysis Results
Successful interpretation combines fundamental and technical signals to evaluate stock potential. Investors must contextualize numerical outputs within broader market conditions and personal risk tolerance. Clear summary dashboards aid in concise result communication.
Downloadable Excel Stock Analysis Template
Providing a ready-to-use, downloadable Excel stock analysis template accelerates learning and application for investors. These templates come pre-configured with formulas, charts, and data entry guides. Users can customize the template to fit individual investment strategies.