Cost Summary
A
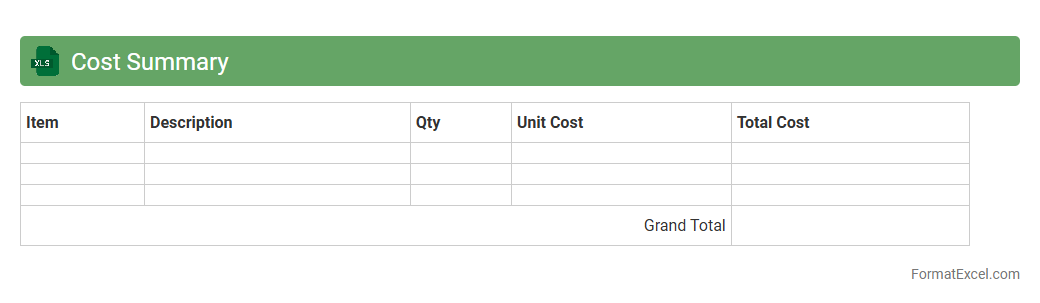
Cost Summary Excel document consolidates all project expenses into a clear, organized format, enabling efficient tracking and budgeting. It helps users quickly identify cost overruns, forecast future expenditures, and support financial decision-making with detailed breakdowns by category or time period. This tool is essential for maintaining control over project finances and ensuring alignment with budgetary goals.
Benefit Summary
A
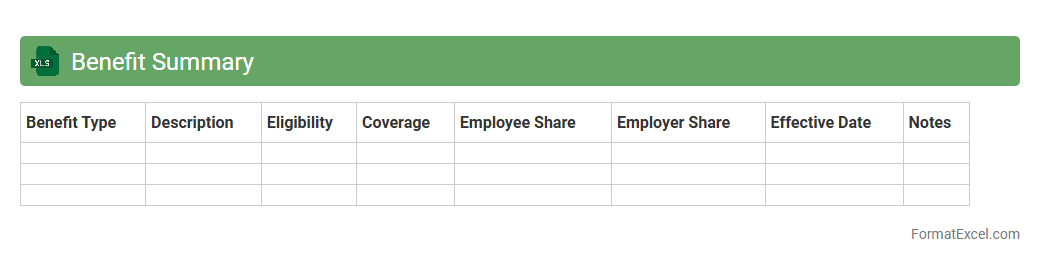
Benefit Summary Excel document is a structured spreadsheet that consolidates employee benefits information such as health insurance, retirement plans, and leave policies. It simplifies the comparison and analysis of various benefits, enabling better decision-making and effective communication with employees or stakeholders. This document improves transparency, streamlines benefits administration, and supports accurate record keeping for HR teams.
Net Present Value Calculation
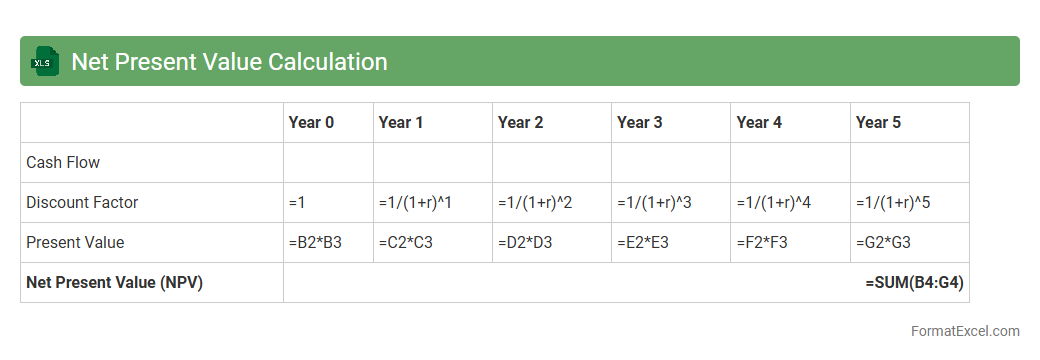
Net Present Value Calculation Excel document is a financial tool that helps evaluate the profitability of an investment by discounting future cash flows to their present value. It allows users to input cash inflows, outflows, and discount rates to determine the
net present value (NPV), aiding in informed decision-making. This tool is essential for businesses and investors to assess project viability and compare alternative investments effectively.
Payback Period Analysis
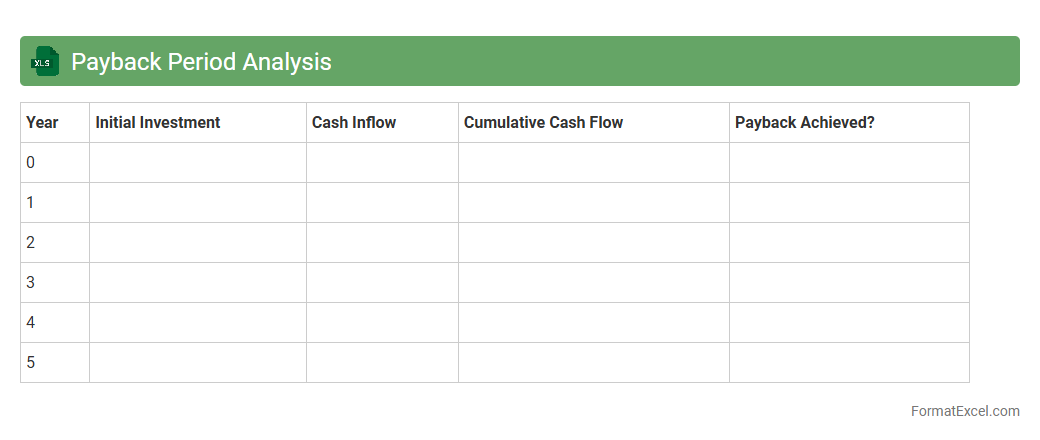
Payback Period Analysis in an Excel document is a financial tool used to determine the time required for an investment to generate enough cash flows to recover the initial cost. This analysis helps businesses evaluate the risk and liquidity of projects by providing a clear timeline for cost recovery, aiding in better decision-making and prioritization. Using
Payback Period Analysis ensures efficient capital allocation and supports strategic planning by highlighting the break-even point for investments.
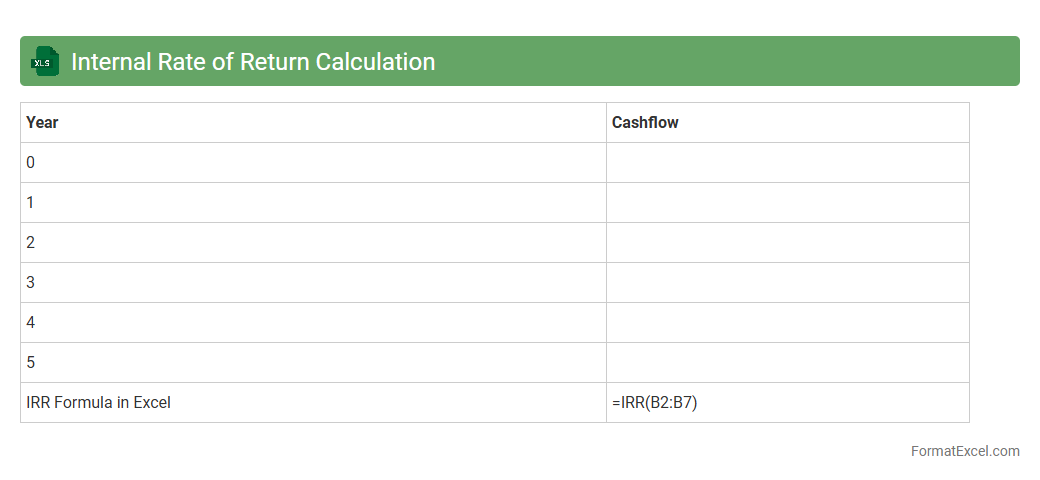
Internal Rate of Return Calculation
An
Internal Rate of Return (IRR) Calculation Excel document is a spreadsheet tool designed to compute the IRR for investment projects by analyzing cash inflows and outflows over time. It provides a clear view of the expected profitability and efficiency of investments, helping businesses and investors make informed financial decisions. This tool streamlines complex calculations, enabling accurate comparison of different projects and ensuring optimal capital allocation.
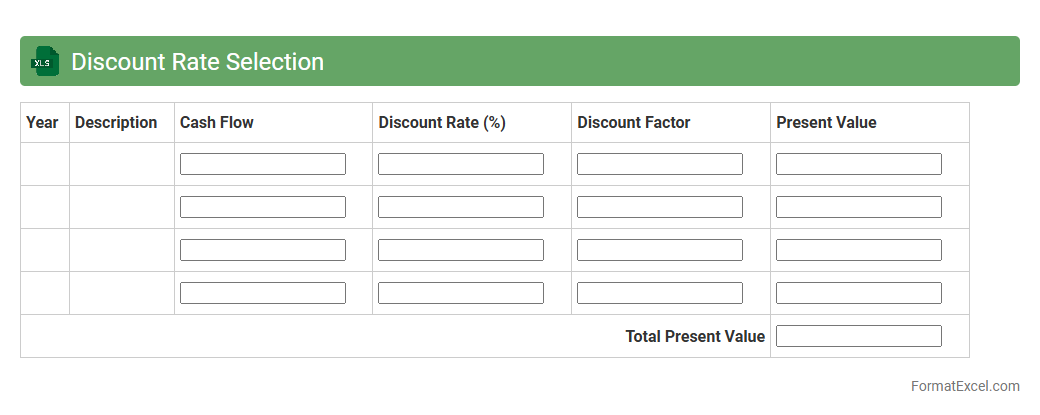
Discount Rate Selection
The
Discount Rate Selection Excel document is a tool designed to help analyze and determine the appropriate discount rate for financial evaluations and investment decisions. It streamlines the process of assessing risk, time value of money, and expected returns by aggregating relevant financial data and scenarios. This document is useful for businesses and investors aiming to make informed decisions on project valuations, capital budgeting, and cost of capital calculations.
Sensitivity Analysis
Sensitivity Analysis Excel documents enable users to evaluate how changes in input variables impact the outcomes of a financial model or decision-making process. By systematically adjusting key parameters, this tool identifies which factors have the most significant influence, allowing businesses to manage risks and optimize strategies effectively. Using
Sensitivity Analysis in Excel enhances predictive accuracy and supports data-driven decision-making in uncertain environments.
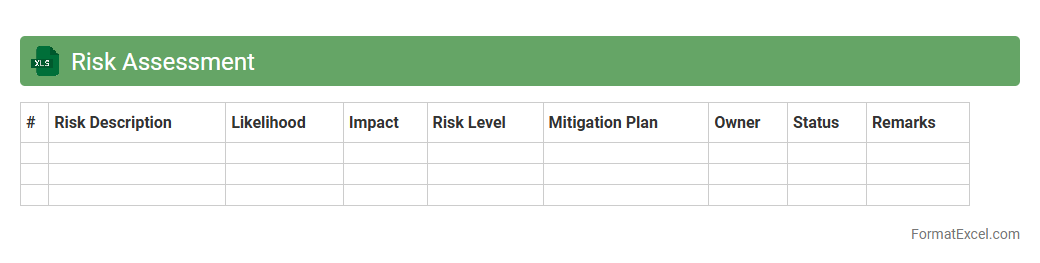
Risk Assessment
A
Risk Assessment Excel document is a structured spreadsheet used to identify, analyze, and prioritize potential risks within a project or organization. It helps in quantifying risks by assigning likelihood and impact scores, allowing teams to develop effective mitigation strategies and allocate resources efficiently. This tool enhances decision-making by providing clear visibility into risk factors, promoting proactive risk management and ensuring safer project outcomes.
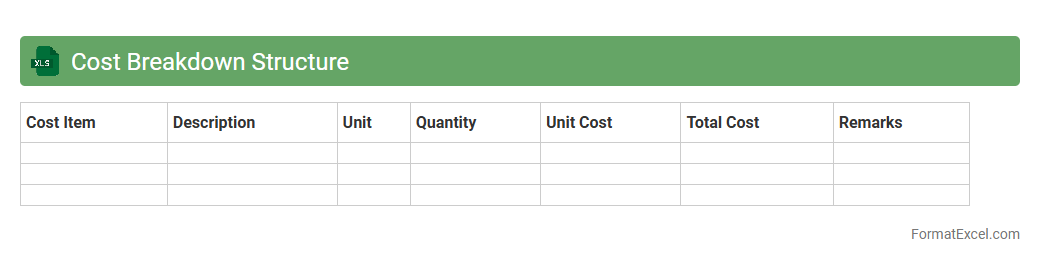
Cost Breakdown Structure
A
Cost Breakdown Structure (CBS) Excel document categorizes and organizes project costs into detailed, hierarchical segments, enabling clear visibility of expenses across various phases and components. It helps project managers allocate budgets accurately, monitor financial performance, and identify cost-saving opportunities. By providing a structured framework, the CBS Excel sheet enhances decision-making, improves cost control, and supports effective project financial management.
Benefit Breakdown Structure
The
Benefit Breakdown Structure (BBS) Excel document is a structured tool that organizes and categorizes anticipated benefits of a project or initiative into manageable components. It helps project managers and stakeholders visualize, quantify, and track benefits, ensuring alignment with strategic objectives and facilitating effective benefit realization. Using a BBS Excel template improves clarity in benefit management, enhances communication, and supports data-driven decision-making throughout the project lifecycle.
Assumption Documentation
The
Assumption Documentation Excel document serves as a structured repository for capturing and managing key assumptions made during project planning or financial forecasting. It provides clarity and consistency by centralizing assumptions, enabling teams to track changes, validate hypotheses, and make informed decisions. This document is essential for risk management and ensures transparency across stakeholders by clearly outlining the basis for projections and analyses.
Timeframe Analysis
Timeframe Analysis Excel document is a powerful tool that helps track and evaluate data trends over specified periods, enabling better decision-making. By organizing information into daily, weekly, or monthly intervals, it allows users to identify patterns, measure performance, and forecast future outcomes effectively. Utilizing
timeframe analysis enhances productivity and accuracy in project management, financial planning, and data-driven strategies.
Cash Flow Projection
A
Cash Flow Projection Excel document estimates future cash inflows and outflows over a specific period, helping businesses anticipate liquidity needs and plan expenses effectively. It provides a detailed view of expected revenue versus outgoing payments, enabling better financial decision-making and avoiding cash shortages. Utilizing this tool improves budgeting accuracy and supports strategic growth by ensuring funds are available when required.
Sensitivity Table
A
Sensitivity Table in Excel is a powerful tool used to analyze how different input variables impact the output of a formula or model, allowing users to assess risks and make informed decisions. It systematically varies key inputs to display results, enabling quick identification of factors that have the greatest influence on outcomes. This functionality is especially useful in financial modeling, forecasting, and scenario analysis for optimizing strategies and improving accuracy.
Quantitative Benefits
A
Quantitative Benefits Excel document systematically captures and analyzes measurable advantages such as cost savings, revenue growth, and productivity improvements. It helps organizations make data-driven decisions by providing clear visualization and comparison of financial metrics tied to projects or initiatives. Utilizing this tool enhances transparency and supports strategic planning through quantifiable evidence of benefits.
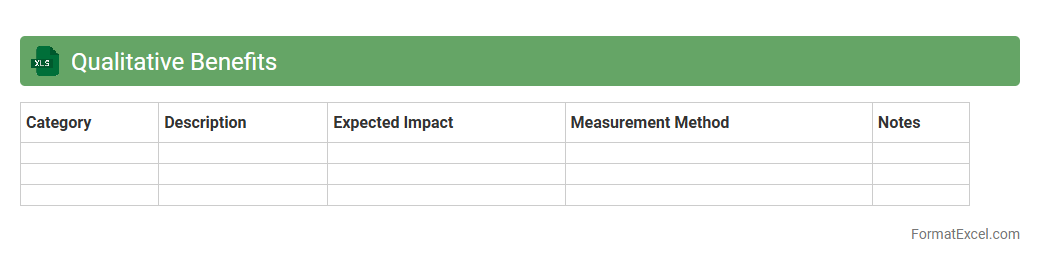
Qualitative Benefits
The
Qualitative Benefits Excel document is a tool designed to capture and analyze non-quantifiable advantages such as customer satisfaction, brand reputation, and employee morale. It helps organizations systematically record subjective benefits that impact business success but are difficult to measure numerically. By providing structured data on qualitative outcomes, it supports informed decision-making and strategic planning beyond purely financial metrics.
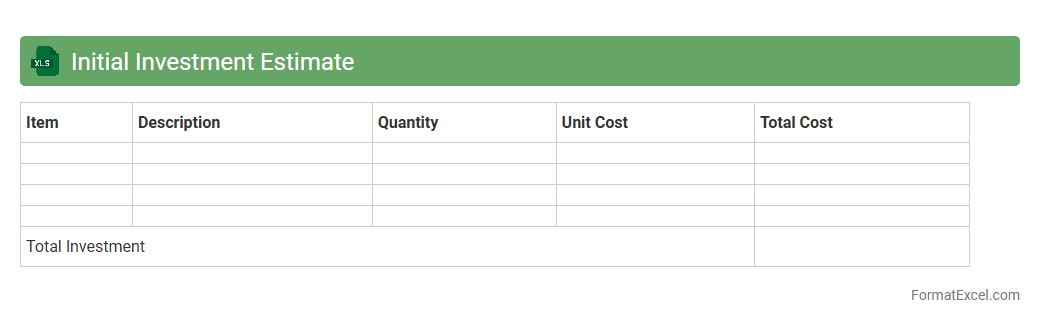
Initial Investment Estimate
The
Initial Investment Estimate Excel document is a financial planning tool that helps project stakeholders calculate the preliminary costs required to launch a project or business. It organizes expenses such as equipment, materials, labor, and contingencies into a clear, itemized format, enabling accurate budgeting and financial analysis. Using this document facilitates informed decision-making by providing a comprehensive overview of capital requirements and expected cash flow needs.
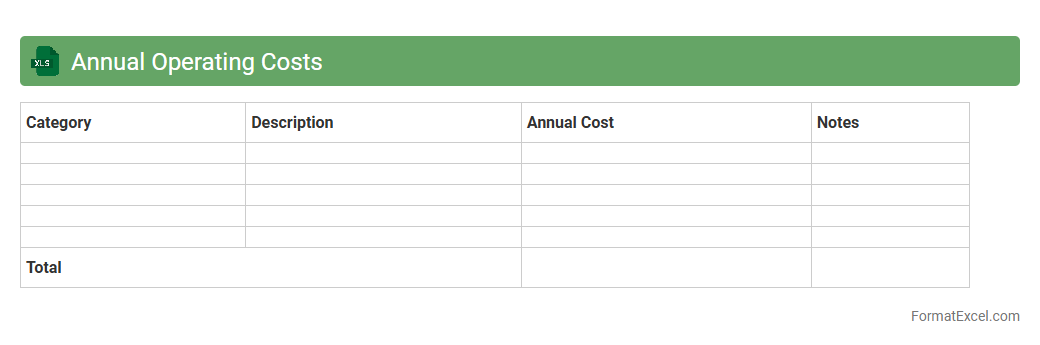
Annual Operating Costs
The
Annual Operating Costs Excel document is a detailed financial tool designed to track and analyze the ongoing expenses of a business or project over a one-year period. It categorizes costs such as utilities, salaries, maintenance, and supplies, allowing for precise budgeting and cost control. This document aids in optimizing resource allocation, forecasting future expenses, and enhancing financial decision-making for improved operational efficiency.
Potential Revenue Streams
The
Potential Revenue Streams Excel document is a strategic tool designed to identify, categorize, and quantify various sources of income for a business or project. It helps users analyze different revenue opportunities, forecast financial performance, and make informed decisions for sustainable growth. By organizing data in a clear, structured format, it enhances financial planning and supports targeted revenue optimization efforts.
Resource Allocation
A
Resource Allocation Excel document is a spreadsheet tool designed to plan, assign, and track resources such as personnel, equipment, and budget across various projects and tasks. It enables efficient management by providing a clear overview of resource availability, utilization, and potential bottlenecks. Using this document helps organizations optimize productivity, prevent overallocation, and ensure timely project completion.
Key Performance Indicators
A
Key Performance Indicators (KPI) Excel document is a structured spreadsheet used to track, analyze, and visualize critical business metrics that measure progress toward strategic goals. It enables organizations to monitor performance in real-time, identify trends, and make data-driven decisions that enhance operational efficiency. Using this tool improves accountability, ensures alignment across teams, and drives continuous improvement in achieving business objectives.
Scenario Comparison
A
Scenario Comparison Excel document is a tool designed to analyze and contrast multiple business or project scenarios side-by-side, allowing users to evaluate different outcomes based on varying inputs and assumptions. It helps in identifying the most efficient decision paths by clearly presenting financial metrics, risks, and benefits for each scenario. This document enhances strategic planning and risk management by providing a transparent framework for decision-makers to make data-driven choices.
Cost Savings Estimation
A
Cost Savings Estimation Excel document is a financial tool designed to calculate and project potential savings from various business activities or investments. It helps organizations identify areas where expenses can be reduced by comparing current costs against forecasted savings, enabling informed decision-making. This document is essential for budgeting, optimizing resource allocation, and improving overall financial efficiency.
Tangible vs Intangible Benefits
The
Tangible vs Intangible Benefits Excel document systematically categorizes and quantifies benefits into measurable financial gains and qualitative improvements, aiding in comprehensive project evaluation. This tool enhances decision-making by providing clear visualizations and comparisons of benefits, ensuring balanced consideration of both concrete and abstract outcomes. Organizations use it to prioritize initiatives, allocate resources efficiently, and justify investments with a structured benefits analysis.
Implementation Timeline
An
Implementation Timeline Excel document is a structured spreadsheet that outlines project tasks, deadlines, and milestones in a chronological order. It helps teams track progress, allocate resources efficiently, and ensure timely completion of project phases. By visualizing the entire implementation schedule, it enhances coordination and accountability across departments.
Introduction to Cost Benefit Analysis in Excel
Cost Benefit Analysis (CBA) in Excel is a systematic approach to evaluate the financial pros and cons of a project or decision. Utilizing Excel's powerful tools enhances accuracy and efficiency in the analysis process. Mastering Excel-based CBA helps professionals make informed decisions backed by data.
Importance of Standardized Cost Benefit Analysis Formats
Standardized formats ensure consistency and comparability across various projects and analyses. They simplify data entry, reduce errors, and make interpretation easier for stakeholders. Implementing a standard CBA template promotes transparency and reliability.
Key Components of a Cost Benefit Analysis Template
A well-structured template includes sections for costs, benefits, net present value, and payback periods. It should clearly list all relevant financial inputs and expected outcomes. The key components drive comprehensive and accurate project evaluations.
Step-by-Step Guide to Setting Up the Format in Excel
Begin by outlining your cost and benefit categories in separate columns. Use formulas to calculate totals, differences, and ratios such as ROI or NPV. Following a step-by-step format ensures clarity and minimizes mistakes during setup.
Essential Columns and Rows for Clarity
Include columns for description, unit cost, quantity, total cost, benefit value, and net benefit. Rows should represent different time periods or project phases for time-based analysis. Clear columns and rows help visualize the flow and impact of costs and benefits.
Sample Formulas for Calculating Costs and Benefits
Common formulas include =SUM() for totals, =NPV() for present value calculations, and simple subtraction for net benefits. Using relative and absolute cell references enhances formula flexibility. These sample formulas automate and improve accuracy in the analysis.
Tips for Data Input and Validation
Use data validation rules to restrict inputs to acceptable ranges and formats. Consistently format cells for currency or percentages to avoid misinterpretation. Implementing data validation minimizes input errors and strengthens analysis integrity.
Visualizing Results with Charts and Graphs
Graphs such as bar charts and pie charts can illustrate cost distributions and benefit comparisons effectively. Dynamic charts linked to data enable real-time updates as inputs change. Visualization of results aids in communicating findings to decision-makers.
Downloadable Cost Benefit Analysis Excel Template
Finding a downloadable template saves time and ensures professional quality in the setup process. Many templates include built-in formulas and charts tailored for CBA. Accessing a downloadable template provides a ready-made solution to streamline analysis.
Best Practices for Maintaining and Updating Your Analysis
Regularly update the analysis with new data and review assumptions for accuracy. Backup versions before major changes help track progress and avoid data loss. Following best practices ensures your cost benefit analysis remains relevant and reliable.