Student Performance Summary
The
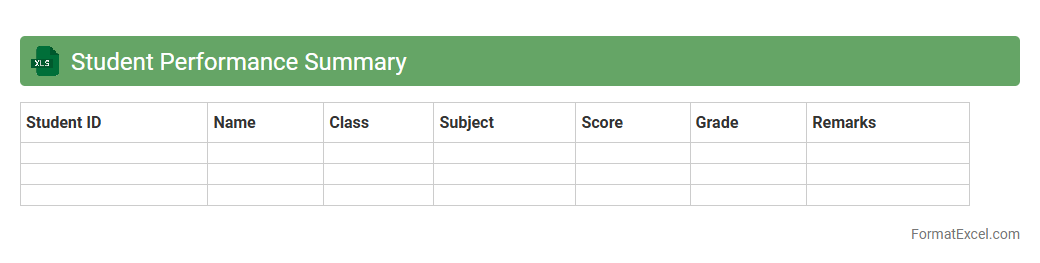
Student Performance Summary Excel document is a comprehensive tool that consolidates academic data such as grades, attendance, and assessment scores into an easily analyzable format. It allows educators and administrators to track progress, identify trends, and pinpoint areas needing improvement for individual students or groups. This organized summary enhances decision-making, supports targeted interventions, and streamlines reporting processes in educational settings.
Subject-wise Score Breakdown
The
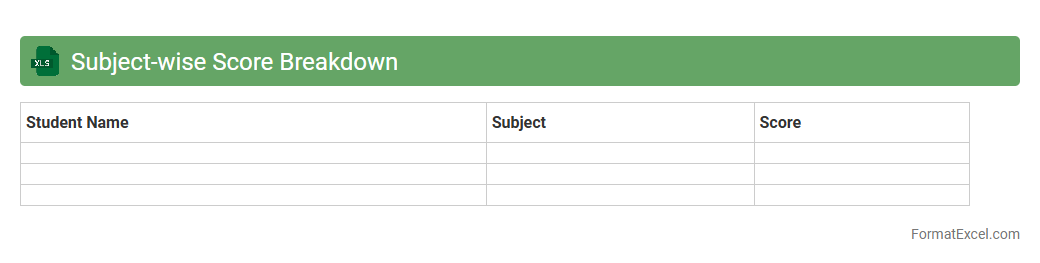
Subject-wise Score Breakdown Excel document organizes individual scores across different subjects, enabling detailed analysis of academic performance. It helps identify strengths and weaknesses in specific areas, facilitating targeted improvement strategies. Educators and students can track progress, compare results, and make informed decisions based on precise data.
Class Average Calculation
A
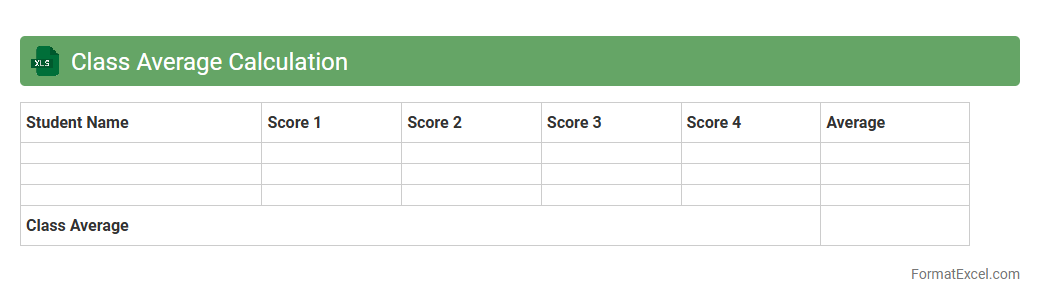
Class Average Calculation Excel document is a spreadsheet designed to compute the mean score of all students in a class by organizing individual grades and applying formula functions such as AVERAGE. It streamlines the grading process, making it easier for educators to analyze overall student performance and identify trends or areas needing improvement. This tool enhances efficiency by automating calculations and providing clear, instant results essential for academic assessment and reporting.
Highest and Lowest Marks Identification
The
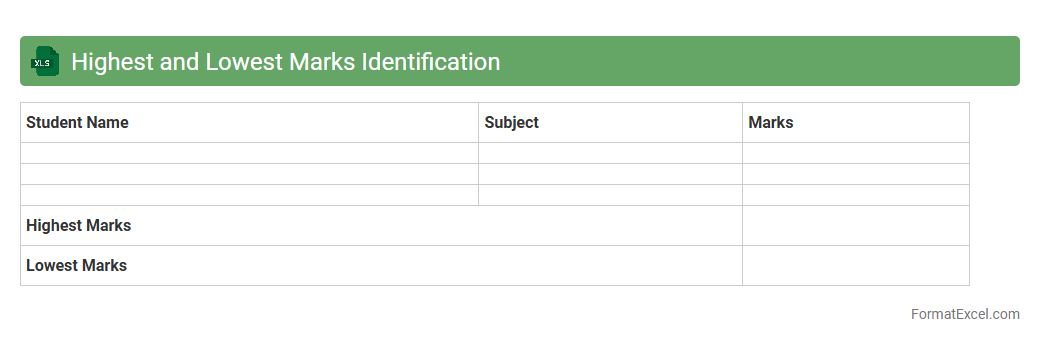
Highest and Lowest Marks Identification Excel document is a tool designed to quickly analyze student performance by identifying the maximum and minimum scores in a dataset. It helps educators and administrators efficiently pinpoint top achievers and those in need of support, enabling targeted interventions for academic improvement. This document leverages Excel functions like MAX and MIN to streamline data processing and enhance decision-making based on student marks.
Pass and Fail Count
A
Pass and Fail Count Excel document is a spreadsheet used to track the number of successful (pass) and unsuccessful (fail) outcomes in a given dataset or process. It helps in quickly assessing performance metrics, quality control, and identifying areas that require improvement. This tool is particularly useful for project management, product testing, and data analysis to ensure effective decision-making based on clear success and failure statistics.
Grade Distribution
A
Grade Distribution Excel document organizes student grades into categories, enabling educators to analyze performance trends across assignments, exams, or class sections. It helps identify areas where students excel or struggle, facilitating targeted instructional adjustments and ensuring fair assessment practices. This tool also streamlines reporting and communication with stakeholders by providing clear, visual summaries of academic achievement.
Top Scorers List
A
Top Scorers List Excel document is a structured spreadsheet that records and ranks individuals or teams based on their performance scores, allowing easy tracking and comparison. It organizes data efficiently through customized columns, formulas, and sorting features to highlight the highest achievers over a given period. This tool is invaluable for educators, coaches, and managers who want to analyze performance trends, motivate participants, and make informed decisions based on accurate statistics.
Weak Subject Identification
The
Weak Subject Identification Excel document is a tool designed to analyze and pinpoint underperforming subjects or topics based on student performance data. It helps educators quickly identify areas where students struggle the most, enabling targeted interventions and resource allocation. Using this document enhances curriculum planning and improves overall academic outcomes by focusing efforts on weaker subjects.
Student-wise Progress Tracking
The
Student-wise Progress Tracking Excel document systematically records individual student performance across various subjects and assessments, enabling educators to monitor academic growth effectively. This tool allows for quick identification of strengths and weaknesses, facilitating personalized learning strategies and targeted interventions. By organizing data clearly, it enhances decision-making and promotes improved student outcomes over time.
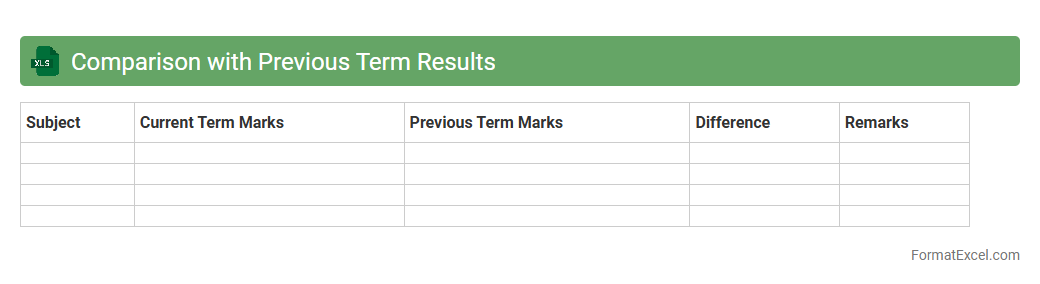
Comparison with Previous Term Results
The
Comparison with Previous Term Results Excel document organizes and contrasts student performance data across different academic terms, highlighting trends and areas of improvement. By analyzing this comparative data, educators and administrators can identify patterns in learning outcomes, enabling targeted interventions and informed decision-making. This tool supports enhanced academic planning and helps track progress toward educational goals effectively.
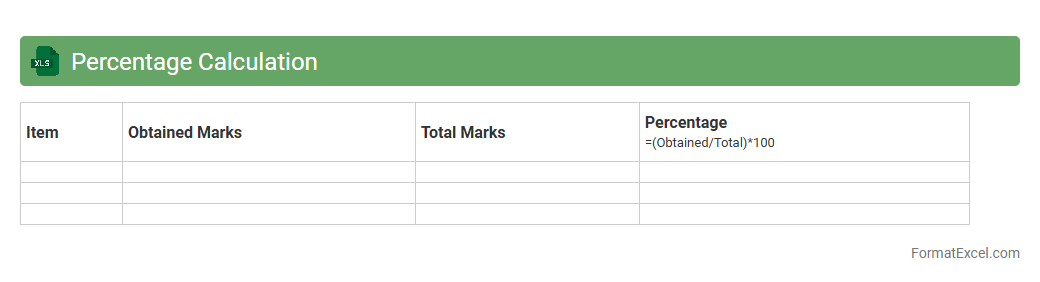
Percentage Calculation
A
Percentage Calculation Excel document is a spreadsheet tool designed to compute percentages efficiently, enabling users to analyze data related to growth rates, discounts, profit margins, and statistical proportions. It automates complex percentage formulas, reducing errors and saving time in financial analysis, sales reporting, and academic performance evaluation. This document enhances decision-making by providing clear insights through visual percentage breakdowns and comparative data metrics.
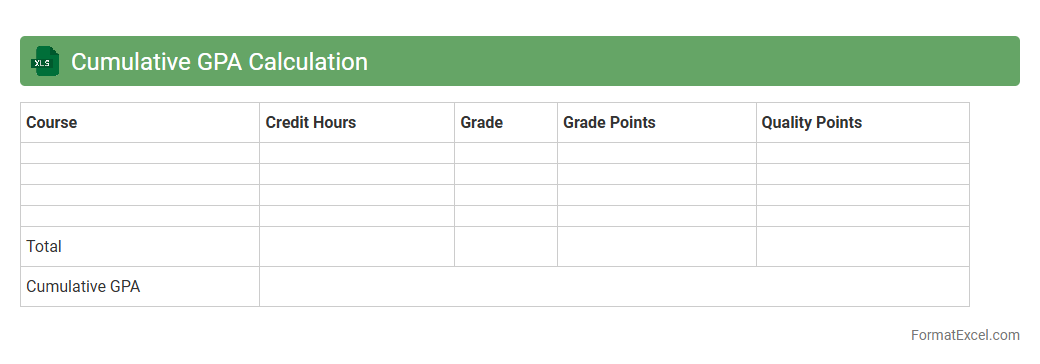
Cumulative GPA Calculation
A
Cumulative GPA Calculation Excel document systematically tracks and calculates the weighted average of all your grades across multiple semesters or courses, ensuring accurate academic performance assessment. This tool simplifies GPA management by automatically updating calculations when new grades or credit hours are entered, providing real-time insights into your overall academic standing. Its use streamlines academic planning, helps identify areas for improvement, and supports goal setting for achieving target GPA benchmarks.
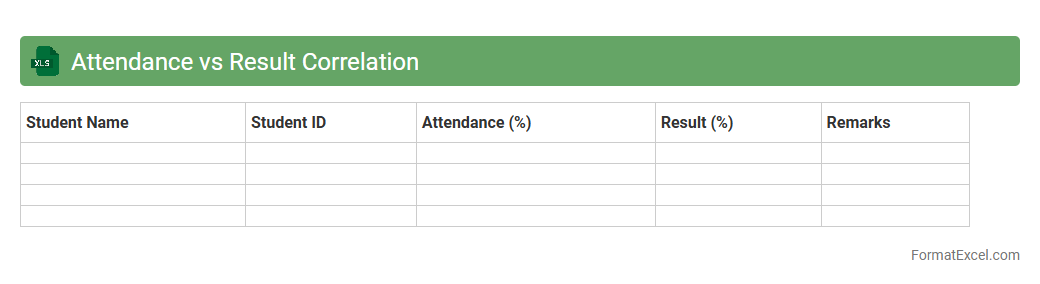
Attendance vs Result Correlation
The
Attendance vs Result Correlation Excel document analyzes the relationship between students' attendance rates and their academic performance, providing valuable insights through data visualization and statistical metrics. By tracking attendance patterns alongside exam scores, this tool helps educators identify trends, predict outcomes, and implement targeted interventions to improve student success. It is essential for optimizing teaching strategies and enhancing overall educational effectiveness based on empirical data.
Marks Improvement Index
The
Marks Improvement Index Excel document is a powerful tool designed to track and analyze students' academic progress over time by comparing their marks across different assessments. It helps educators identify areas where students show significant improvement or decline, enabling targeted interventions and personalized learning strategies. By consolidating performance data, this index supports data-driven decision-making to enhance teaching effectiveness and student outcomes.
Gender-wise Result Analysis
The
Gender-wise Result Analysis excel document systematically organizes and compares performance data between different genders, enabling identification of trends and disparities in educational or organizational outcomes. By breaking down results based on gender, it provides actionable insights for educators, HR professionals, and policymakers to implement targeted strategies for equity and improvement. This tool enhances data-driven decision-making, facilitating a more inclusive and balanced approach to performance evaluation.
Subject Difficulty Analysis
Subject Difficulty Analysis Excel document is a comprehensive tool that helps educators and students evaluate the complexity of various subjects based on assessment results and learning outcomes. By systematically organizing data on topics, question types, and performance metrics, it identifies areas where learners struggle the most, enabling targeted improvement strategies. This
data-driven approach enhances academic planning, resource allocation, and personalized learning pathways for better educational results.
Marks Trend Over Multiple Exams
The
Marks Trend Over Multiple Exams Excel document tracks students' performance across several assessments, allowing educators and students to identify patterns and fluctuations in scores over time. By analyzing this data, teachers can pinpoint areas needing improvement and tailor instructional strategies accordingly. This tool facilitates effective progress monitoring, ensuring targeted interventions to enhance academic outcomes.
Custom Ranking Generation
A
Custom Ranking Generation Excel document is a specialized tool designed to organize, calculate, and visualize ranking data based on user-defined criteria. It allows businesses and individuals to efficiently prioritize options, products, or services by applying weighted scores and formulas tailored to specific goals. This document enhances decision-making processes by providing clear, data-driven insights and facilitating easy adjustments to ranking parameters.
Outlier Detection in Scores
Outlier Detection in Scores Excel documents identifies data points significantly different from the majority, highlighting anomalies or errors in datasets. This technique improves data quality by enabling the removal or further analysis of extreme scores, ensuring accurate statistical results and reliable decision-making.
Outlier Detection is essential for uncovering trends, enhancing model performance, and maintaining data integrity in score analysis.
Result Visualization Dashboard
A
Result Visualization Dashboard Excel document is a powerful tool that transforms complex data into clear, interactive charts and graphs for easy analysis. It allows users to track key performance indicators, monitor trends, and make data-driven decisions efficiently. This dashboard improves productivity by consolidating multiple data sources into a single, visually intuitive interface, enabling quick insights and strategic planning.
Semester-wise Result Compilation
The
Semester-wise Result Compilation Excel document systematically organizes student grades and academic performance across multiple semesters, allowing easy tracking of progress and identification of trends. It serves as a centralized data repository that simplifies the analysis of subject-wise results, overall scores, and grade point averages in an accessible, digital format. Educational institutions and students benefit from its ability to generate reports, monitor academic achievements, and facilitate informed decision-making for future course selections or interventions.
Distinction Holder Identification
The
Distinction Holder Identification Excel document is a structured tool designed to systematically record and track individuals who have received academic or professional distinctions. It consolidates vital data such as names, award types, dates, and related achievements, facilitating easy access and management of recognition records. This document enhances organizational efficiency by providing a clear overview of distinction holders, supporting reporting, analysis, and decision-making processes.
Remedial Need Assessment
A
Remedial Need Assessment Excel document is a structured tool designed to evaluate and identify specific areas where individuals or groups require additional support or intervention. It organizes data on learning gaps, skill deficiencies, and performance metrics, enabling educators or managers to target resources effectively. This document aids in creating personalized action plans, enhancing overall outcomes by addressing precise needs systematically.
Success Rate by Section
The
Success Rate by Section Excel document tracks performance metrics across different sections or categories, enabling detailed analysis of outcomes and identification of strengths and weaknesses. By organizing data into sections, it provides a clear overview of success percentages, facilitating targeted improvements and strategic decision-making. This tool is essential for monitoring progress, optimizing processes, and enhancing overall efficiency in various projects or business areas.
Percentage of Students Achieving Above 75
The
Percentage of Students Achieving Above 75 Excel document tracks the proportion of students scoring above 75% in assessments, providing a clear metric of academic performance. It enables educators to identify trends in student achievement, target areas needing improvement, and allocate resources effectively. This data-driven approach enhances decision-making to boost overall educational outcomes.
Introduction to Student Result Analysis in Excel
Student result analysis in Excel involves organizing and evaluating academic data using the spreadsheet software. It helps educators track performance trends and identify areas for improvement efficiently. Excel's versatile tools make data handling and interpretation straightforward.
Importance of Structured Result Analysis
A structured result analysis provides clarity and consistency when reviewing student performance. It ensures that all data points are systematically captured, preventing errors and omissions. This approach improves educational decision-making based on reliable academic insights.
Key Components of a Student Result Analysis Format
Essential components include student details, subject scores, totals, averages, grades, and remarks. Incorporating these elements helps present a comprehensive overview of performance. Each component plays a crucial role in detailed academic evaluation.
Setting Up the Excel Spreadsheet
Begin by creating headers for each data category, setting an organized worksheet foundation. Use clear labels like Name, Roll Number, and Subject Scores to maintain consistency. Proper setup is vital for seamless data management.
Essential Columns for Student Data
Important columns should cover identifying information (Name, ID), individual subject marks, total marks, percentage, and grade. Including these allows for detailed tracking and analysis of individual and overall performance. Structured columns facilitate accurate data recording.
Incorporating Formulas for Result Calculation
Excel formulas like SUM, AVERAGE, and IF help automate the calculation of totals, percentages, and grades. This reduces manual errors and speeds up result processing. Applying formulas correctly is key to reliable score computation.
Visualizing Performance with Charts and Graphs
Charts such as bar graphs and pie charts illustrate performance trends visually, making data interpretation easier. Visual tools highlight strengths and weaknesses across students or subjects. Utilizing Excel's chart features enhances data visualization.
Tips for Enhancing Data Accuracy
Ensure data accuracy by double-checking inputs, locking formula cells, and using data validation tools. Regularly reviewing and updating entries prevents discrepancies. Maintaining data quality is crucial for precise result analysis.
Automating Result Reports with Excel Features
Excel's features like pivot tables and macros enable automation of repetitive tasks and report generation. Automation saves time and produces standardized, error-free result reports. Leveraging these tools boosts efficiency in academic reporting.
Downloadable Student Result Analysis Excel Templates
Pre-designed Excel templates provide ready-to-use formats for quick student result analysis. These templates save effort and ensure best practices are followed in data recording. Using templates streamlines the analysis process with convenience.