Assets
An
Assets Excel document is a spreadsheet used to track and manage a company's or individual's valuable items, such as equipment, property, or investments. It helps in organizing asset details like purchase date, value, depreciation, and location for efficient financial planning and reporting. Using this document improves accuracy in asset management, ensuring better decision-making and compliance with accounting standards.
Liabilities
A
Liabilities Excel document is a structured spreadsheet used to track and manage financial obligations such as loans, accounts payable, and other debts. It helps individuals and businesses maintain accurate records of what they owe, facilitating better cash flow management and financial planning. By organizing liabilities clearly, the document supports timely payments and improved credit management.
Equity
An
Equity Excel document is a spreadsheet designed to track and analyze ownership stakes, share distributions, and related financial data within a business or investment portfolio. It helps users manage complex equity structures by providing clear visibility of shareholder information, stock options, and dilution impacts. This tool streamlines decision-making, ensures accurate reporting, and supports strategic planning in equity management.
Current Assets
A
Current Assets Excel document is a spreadsheet designed to track and manage an organization's short-term assets, such as cash, accounts receivable, inventory, and other assets expected to be converted into cash within one year. This tool allows businesses to analyze liquidity, monitor asset performance, and make informed financial decisions. By organizing and updating current asset data regularly, companies can optimize working capital and improve cash flow management.
Non-Current Assets
A
Non-Current Assets Excel document is a financial tool used to track and manage long-term assets such as property, equipment, and intangible assets. It helps businesses monitor depreciation, book value, and asset life cycles, providing clear insights into the company's financial health. This document aids in accurate financial reporting, budgeting, and making informed investment decisions.
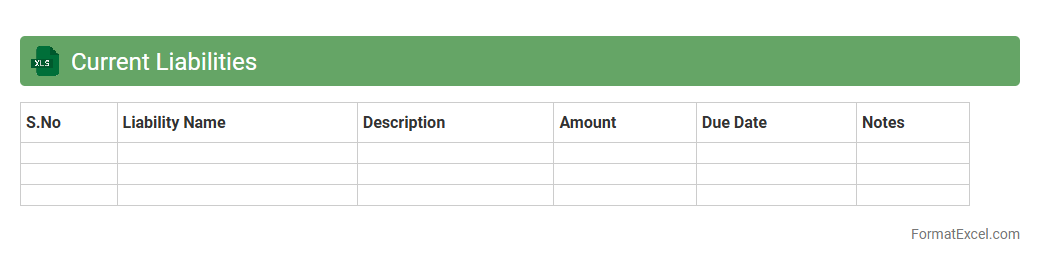
Current Liabilities
A Current Liabilities Excel document is a spreadsheet designed to track and manage a company's short-term financial obligations, such as accounts payable, accrued expenses, and short-term loans due within one year. This tool enables businesses to maintain an organized record of debts, facilitating accurate financial analysis and ensuring timely payments. Using a
Current Liabilities Excel document improves cash flow management and supports strategic decision-making by providing a clear overview of upcoming financial responsibilities.
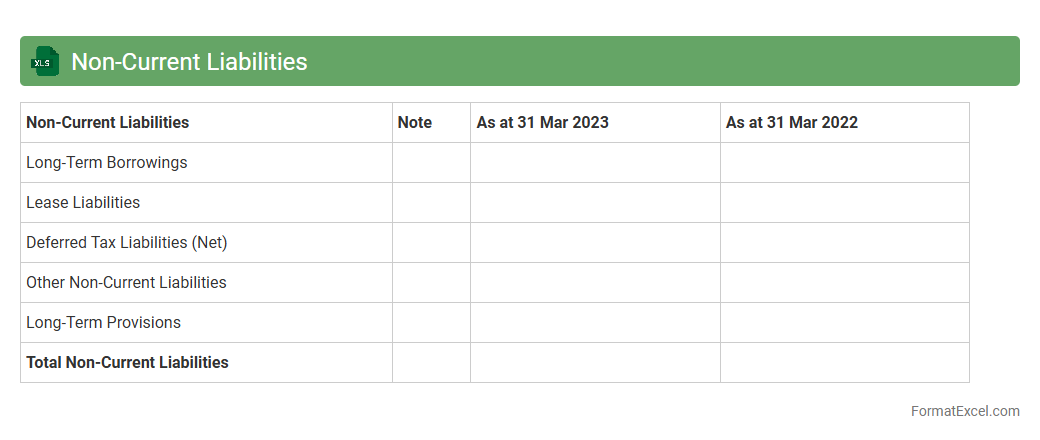
Non-Current Liabilities
A
Non-Current Liabilities Excel document is a financial tool designed to detail long-term debt and obligations that a company needs to settle beyond one fiscal year. It organizes liabilities such as bonds payable, long-term loans, and lease obligations, facilitating better tracking and management of a business's financial commitments. This document aids stakeholders in evaluating the company's financial health and long-term solvency by providing clear visibility into its future payment obligations.
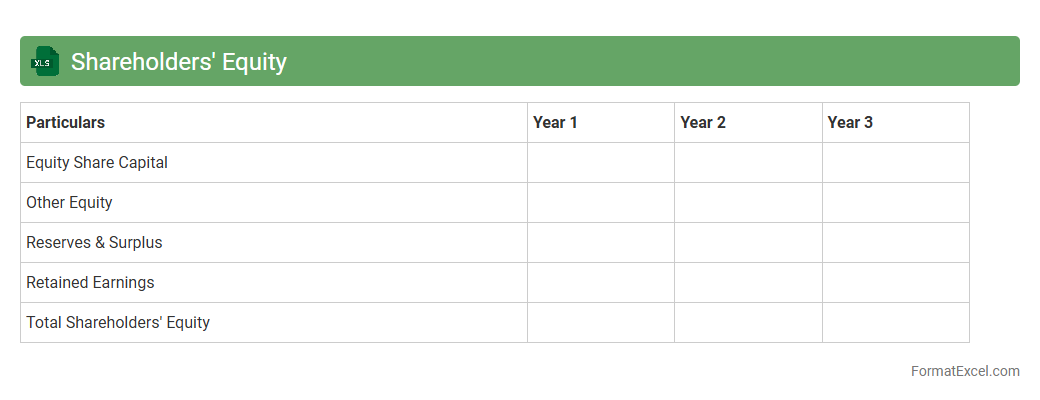
Shareholders' Equity
A
Shareholders' Equity Excel document is a financial tool that organizes and tracks the ownership value held by shareholders in a company, including common stock, retained earnings, and additional paid-in capital. It enables users to analyze equity fluctuations over time, assess company financial health, and support decision-making for investors, accountants, and financial analysts. This document is essential for preparing balance sheets, calculating book value per share, and ensuring transparent reporting for regulatory compliance.
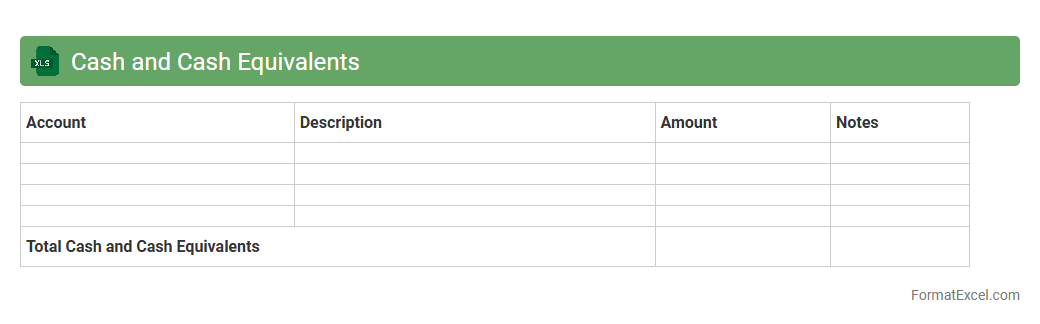
Cash and Cash Equivalents
A
Cash and Cash Equivalents Excel document is a financial tool used to track and manage liquid assets such as currency, bank accounts, and short-term investments. It helps businesses maintain accurate records of their available cash flow, ensuring efficient budgeting and financial planning. This document is essential for monitoring liquidity, detecting discrepancies, and supporting timely decision-making in financial operations.
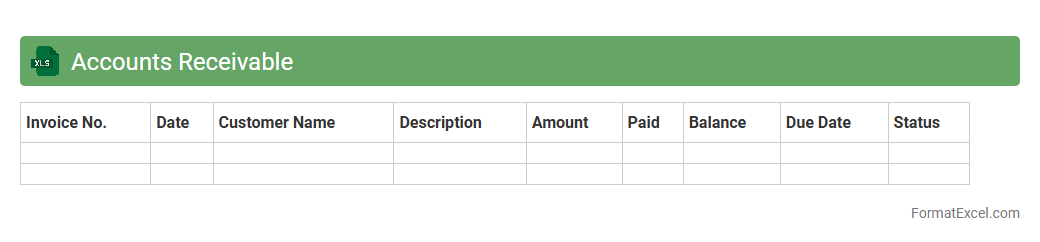
Accounts Receivable
An
Accounts Receivable Excel document is a spreadsheet used to track amounts owed to a business by its customers for products or services delivered. It helps monitor outstanding invoices, payment due dates, and customer balances, enabling efficient cash flow management. This tool simplifies financial record-keeping, improves collections processes, and supports accurate financial reporting.
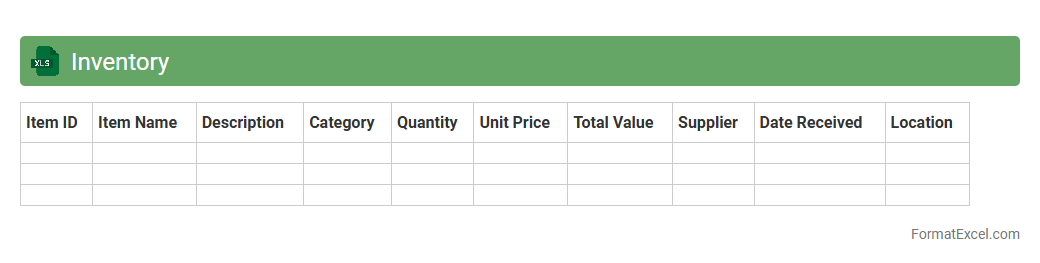
Inventory
An
Inventory Excel document is a structured spreadsheet used to track and manage stock levels, product details, and sales data efficiently. It allows businesses to monitor inventory in real-time, helping prevent stockouts and overstock situations by providing accurate and organized data. By leveraging functions like formulas and pivot tables, users can analyze trends, forecast demand, and optimize supply chain management effectively.
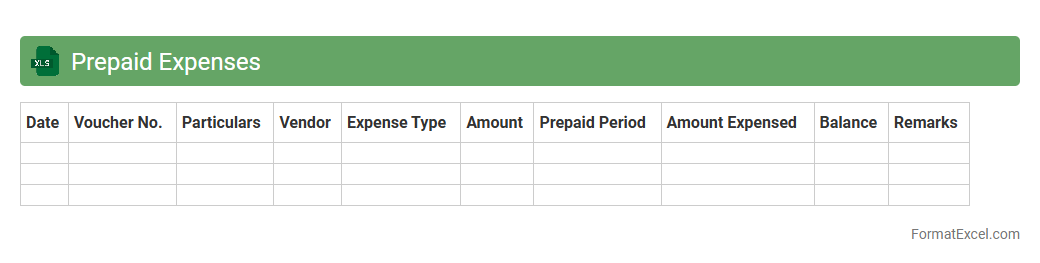
Prepaid Expenses
A
Prepaid Expenses Excel document is a financial tool used to track and manage payments made in advance for services or goods, such as insurance or rent, before their actual use. It helps in accurately recording these expenses over time, ensuring proper allocation in accounting periods and improving cash flow visibility. This document aids businesses in maintaining organized financial records and enhances budgeting and forecasting accuracy.
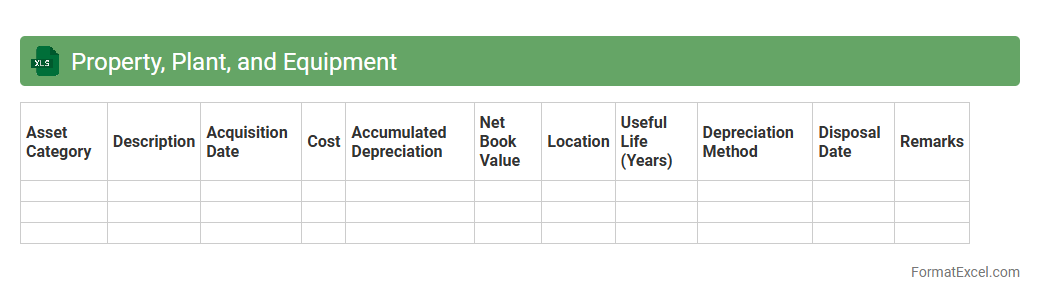
Property, Plant, and Equipment
A
Property, Plant, and Equipment (PP&E) Excel document is a structured spreadsheet used to track and manage a company's tangible fixed assets, including land, buildings, machinery, and equipment. It helps in recording acquisition costs, depreciation schedules, asset valuation, and disposal information, ensuring accurate financial reporting and compliance with accounting standards. This tool is essential for asset management, budgeting, and strategic decision-making by providing clear visibility into asset lifecycle and value.
Intangible Assets
An
Intangible Assets Excel document is a structured spreadsheet used to record, track, and analyze non-physical assets such as patents, trademarks, copyrights, and goodwill. It helps businesses maintain accurate financial records, calculate amortization schedules, and assess the value and lifespan of intangible assets for informed decision-making. Using this document enhances asset management, compliance with accounting standards, and strategic planning.
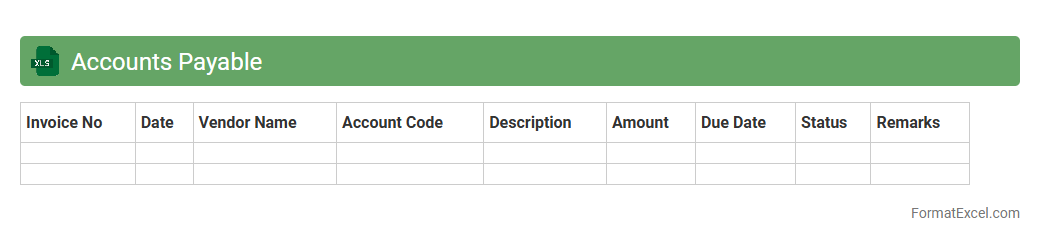
Accounts Payable
An
Accounts Payable Excel document is a spreadsheet used to manage and track a company's outstanding payments to suppliers and vendors. It helps organize invoice data, due dates, and payment statuses, ensuring timely payments and accurate financial records. Utilizing this tool improves cash flow management and enhances the efficiency of the accounts payable process.
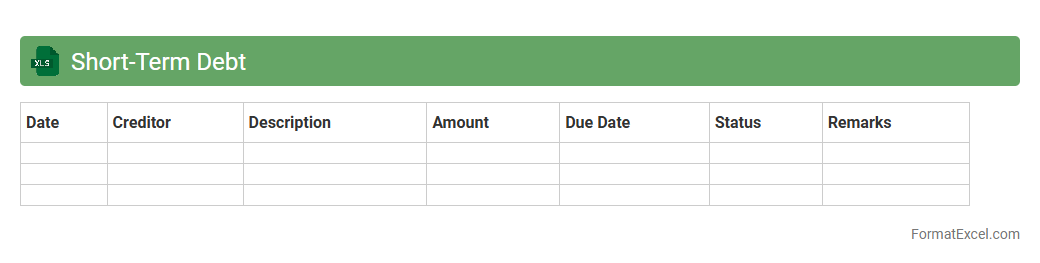
Short-Term Debt
A
Short-Term Debt Excel document is a financial tool designed to track and manage obligations due within one year, such as accounts payable, short-term loans, and credit lines. It helps organizations monitor repayment schedules, interest rates, and outstanding balances, ensuring liquidity and avoiding cash flow issues. This document is essential for accurate budgeting, financial forecasting, and maintaining a healthy balance sheet.
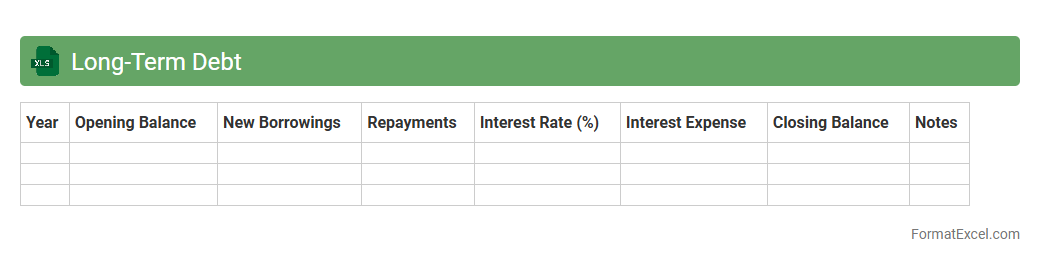
Long-Term Debt
A
Long-Term Debt Excel document is a financial tool used to track and manage an organization's obligations that are due beyond one year. It helps in forecasting debt payments, analyzing interest expenses, and maintaining a clear overview of loan schedules and outstanding balances. This document is essential for strategic financial planning, ensuring accurate budgeting, and improving debt management efficiency.
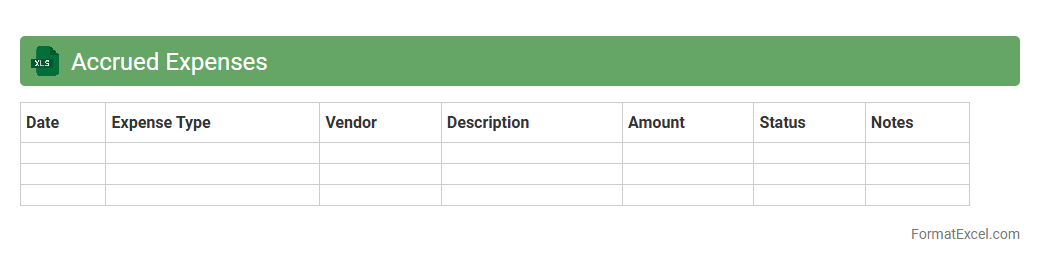
Accrued Expenses
An
Accrued Expenses Excel document is a financial tool used to record and track expenses that have been incurred but not yet paid. It helps businesses maintain accurate accounting by ensuring liabilities are recognized in the period they occur, improving financial reporting and budgeting accuracy. This document is essential for managing cash flow, forecasting future payments, and maintaining compliance with accounting standards.
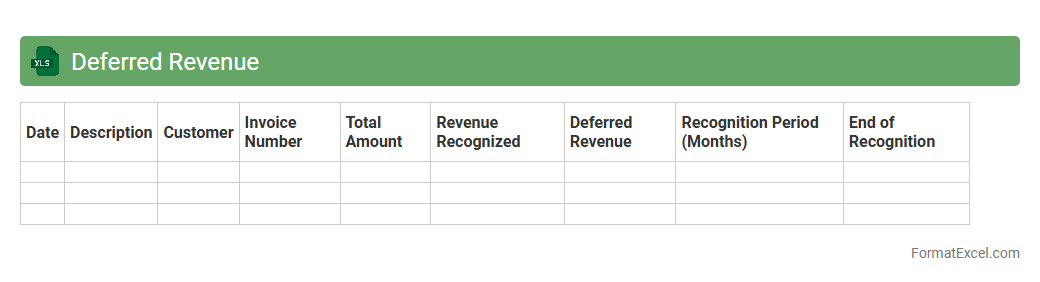
Deferred Revenue
A
Deferred Revenue Excel document is a financial tool used to track and manage income received in advance for goods or services yet to be delivered. It helps businesses accurately record liabilities and recognize revenue over time, ensuring compliance with accounting standards like GAAP or IFRS. By organizing deferred revenue data, the document improves financial reporting accuracy and supports better cash flow management.
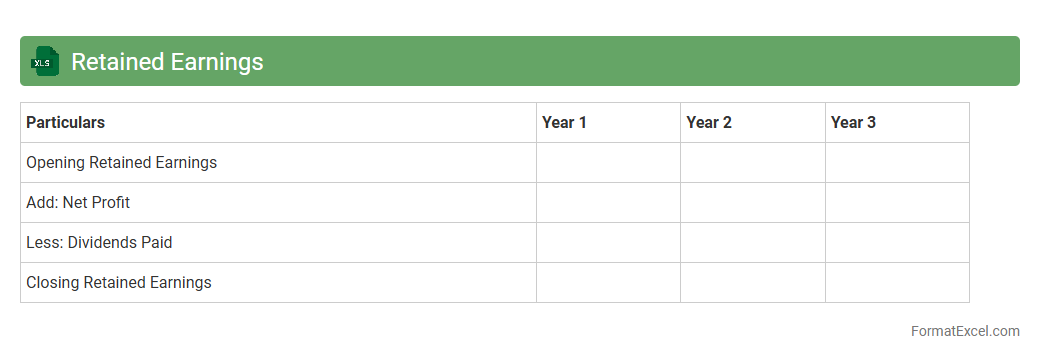
Retained Earnings
A
Retained Earnings Excel document is a financial tool used to track a company's cumulative net income minus dividends paid to shareholders, reflecting the portion of profits reinvested back into the business. It helps businesses and investors analyze financial health by providing clear insights into profit retention, growth potential, and dividend policies over time. Using this document facilitates accurate record-keeping, financial forecasting, and strategic decision-making based on historical retention data.
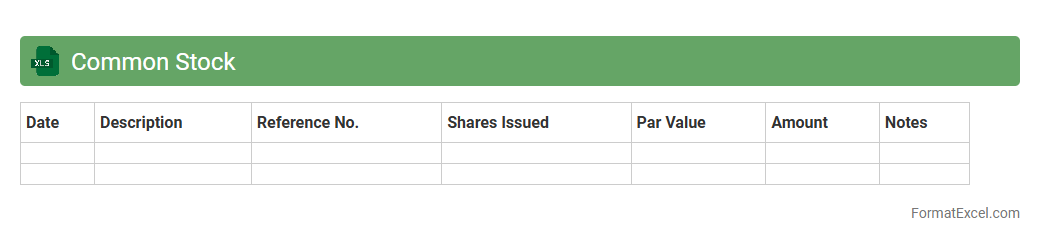
Common Stock
A
Common Stock Excel document is a spreadsheet used to track and manage shares of common stock within a company or personal investment portfolio. It helps calculate ownership percentages, dividends, and stock transaction history, providing clear insights into shareholder equity and investment performance. This tool is essential for making informed financial decisions and maintaining accurate records in equity management.
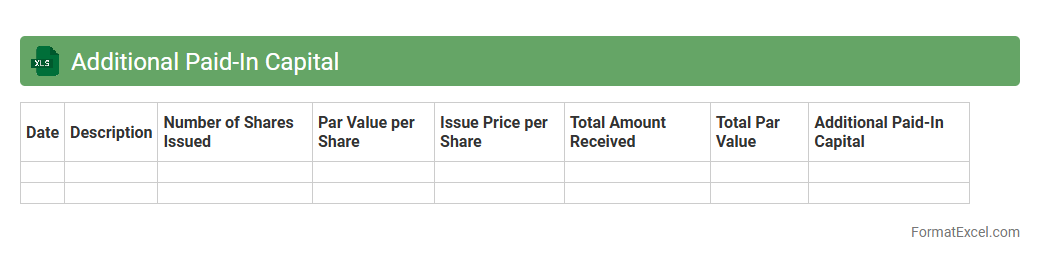
Additional Paid-In Capital
An
Additional Paid-In Capital Excel document tracks the amount investors have paid above the par value of a company's common stock, providing a clear summary of equity financing. This document is useful for analyzing the capital structure, understanding shareholder contributions, and assisting in financial reporting and decision-making. It enables accurate monitoring of equity transactions and supports investors and management in assessing company valuation and funding sources.
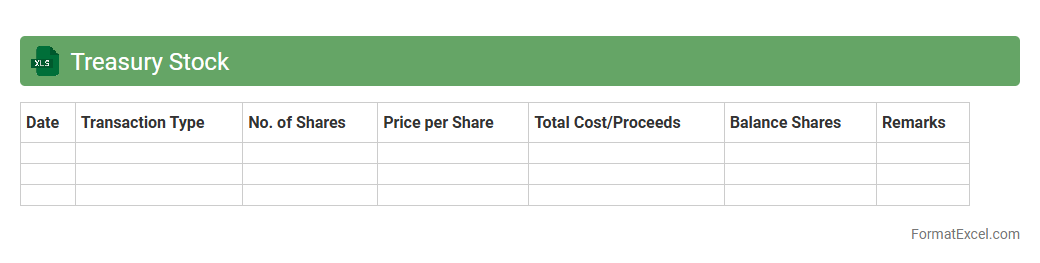
Treasury Stock
A
Treasury Stock Excel document is a spreadsheet used to record and analyze a company's repurchased shares that are held in its treasury. It provides detailed tracking of the number of shares bought back, their cost, and the impact on equity, helping in financial reporting and decision-making. This tool is useful for investors, accountants, and financial analysts to monitor stock buybacks and assess their effect on shareholder value.
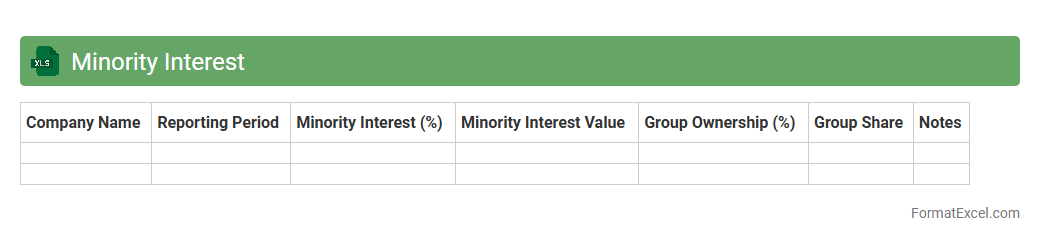
Minority Interest
A
Minority Interest Excel document is a financial tool designed to track and analyze the ownership percentage and value of minority shareholders in a subsidiary company. It helps businesses accurately consolidate financial statements by reflecting the portion of net assets and income not attributable to the parent company. This document is essential for ensuring precise financial reporting and compliance with accounting standards like IFRS and GAAP.
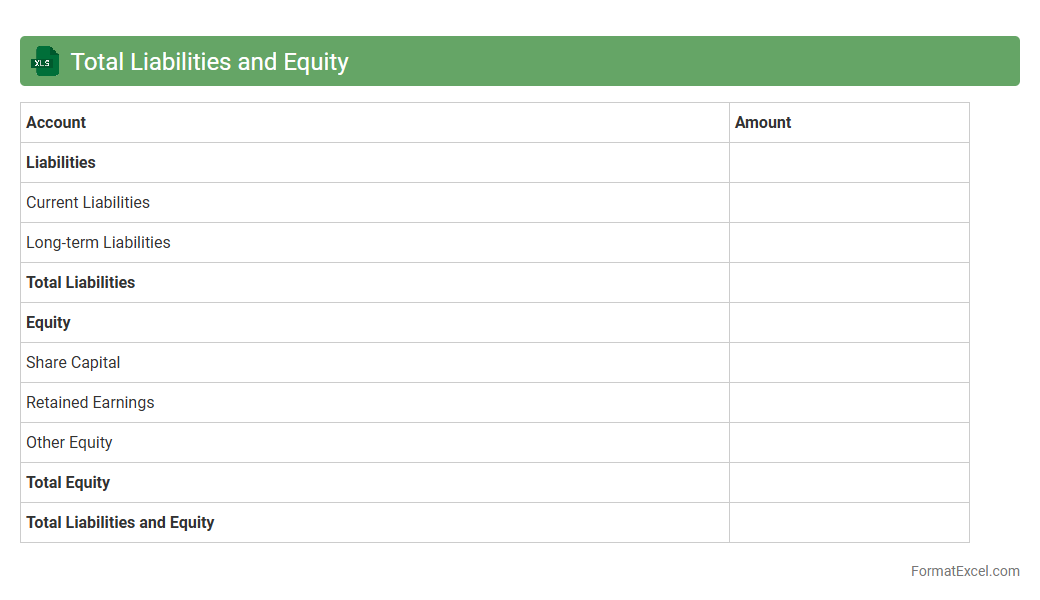
Total Liabilities and Equity
A
Total Liabilities and Equity Excel document itemizes a company's total financial obligations and shareholder equity, providing insight into the sources of funding for its assets. This financial statement is essential for analyzing the company's financial structure, assessing its leverage, and understanding the balance between debt and ownership financing. Using this document helps investors, analysts, and management make informed decisions regarding financial stability and strategic planning.
Introduction to Balance Sheet Format in Excel
The balance sheet format in Excel helps organizations systematically track assets, liabilities, and equity. Excel provides a flexible platform to design clear and professional financial statements. Understanding this format boosts financial transparency and decision-making.
Key Components of a Balance Sheet
A balance sheet contains three main sections: assets, liabilities, and shareholders' equity. Assets are resources owned, liabilities are obligations owed, and equity represents the owner's residual interest. Properly categorizing these components is crucial for accuracy.
Benefits of Using Excel for Balance Sheets
Excel offers dynamic calculation capabilities with built-in formulas that simplify balance sheet management. Its customizability and ease of data entry make it ideal for businesses of all sizes. Additionally, Excel's visualization tools improve financial analysis and reporting.
Step-by-Step Guide to Create a Balance Sheet in Excel
Start by listing assets, liabilities, and equity in separate sections using rows and columns. Use cell references and formulas like SUM to automate calculations. Ensure balance by checking that total assets equal total liabilities plus equity, highlighting the accounting equation.
Sample Balance Sheet Template Layout
A typical balance sheet in Excel includes headers for current and non-current assets, current and long-term liabilities, and equity sections. Use clear labels and organized rows for easy navigation. Formatting with gridlines and bold headings enhances readability.
Essential Formulas for Automating Balance Sheets
Use formulas such as SUM to total columns of assets or liabilities automatically. Apply IF functions for conditional formatting to highlight errors or imbalances. These formulas streamline updates and maintain data integrity within the balance sheet.
Customizing Balance Sheet Formats for Your Business
Adapt the balance sheet layout to reflect your industry's specific accounts and reporting needs. Customization includes adding unique account categories or changing labels to fit your business. Maintaining clarity and compliance is essential for effective financial reporting.
Common Mistakes to Avoid in Excel Balance Sheets
Avoid manual data entry errors, unmatched totals, and inconsistent formatting which can cause financial inaccuracies. Not using cell references and hardcoding numbers leads to fragile spreadsheets. Always validate that your balance sheet accurately reflects financial data.
Tips for Presenting Balance Sheet Data Clearly
Use consistent fonts, aligned columns, and conditional formatting to highlight key figures. Group related accounts logically and provide summary totals for sections. Clear presentation aids stakeholders in quickly understanding the financial position.
Downloadable Balance Sheet Excel Templates
Many websites offer free and customizable Excel templates for balance sheets that simplify setup. These templates are pre-formatted with sample data and formulas, saving time. Using reliable templates reduces errors and enhances your financial documentation process.