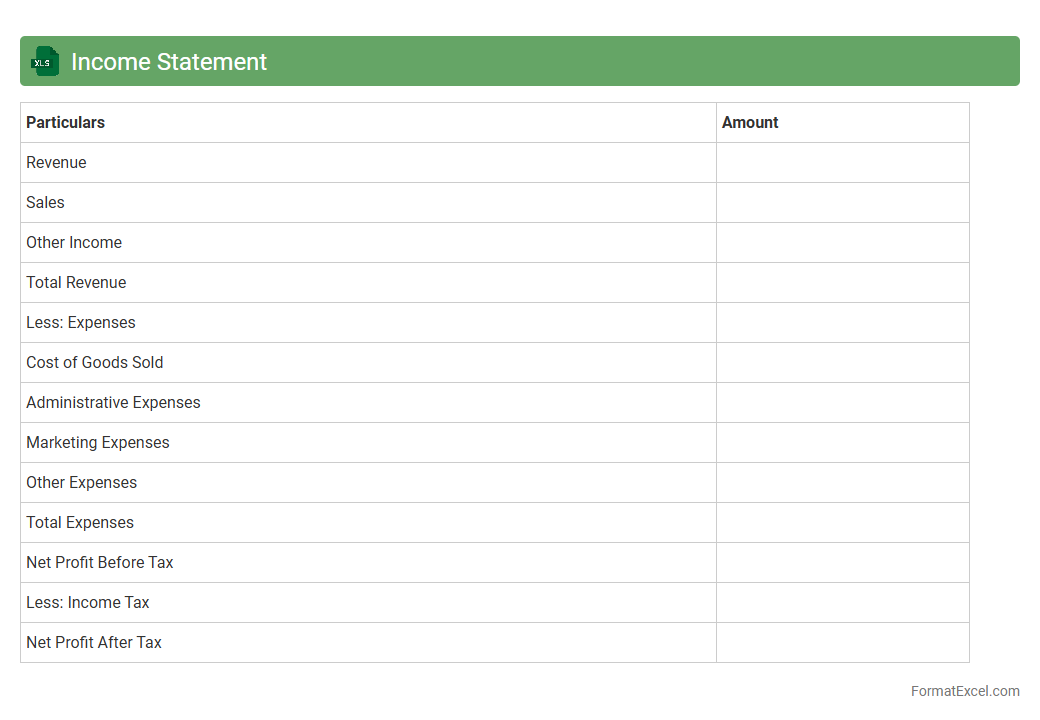
Income Statement
An
Income Statement Excel document is a digital spreadsheet template designed to record and analyze a company's revenues, expenses, and profits over a specific period. It helps users track financial performance, identify trends, and make informed business decisions by organizing data into clear, customizable categories. Utilizing this tool enhances accuracy in financial reporting and facilitates efficient budget planning and forecasting.
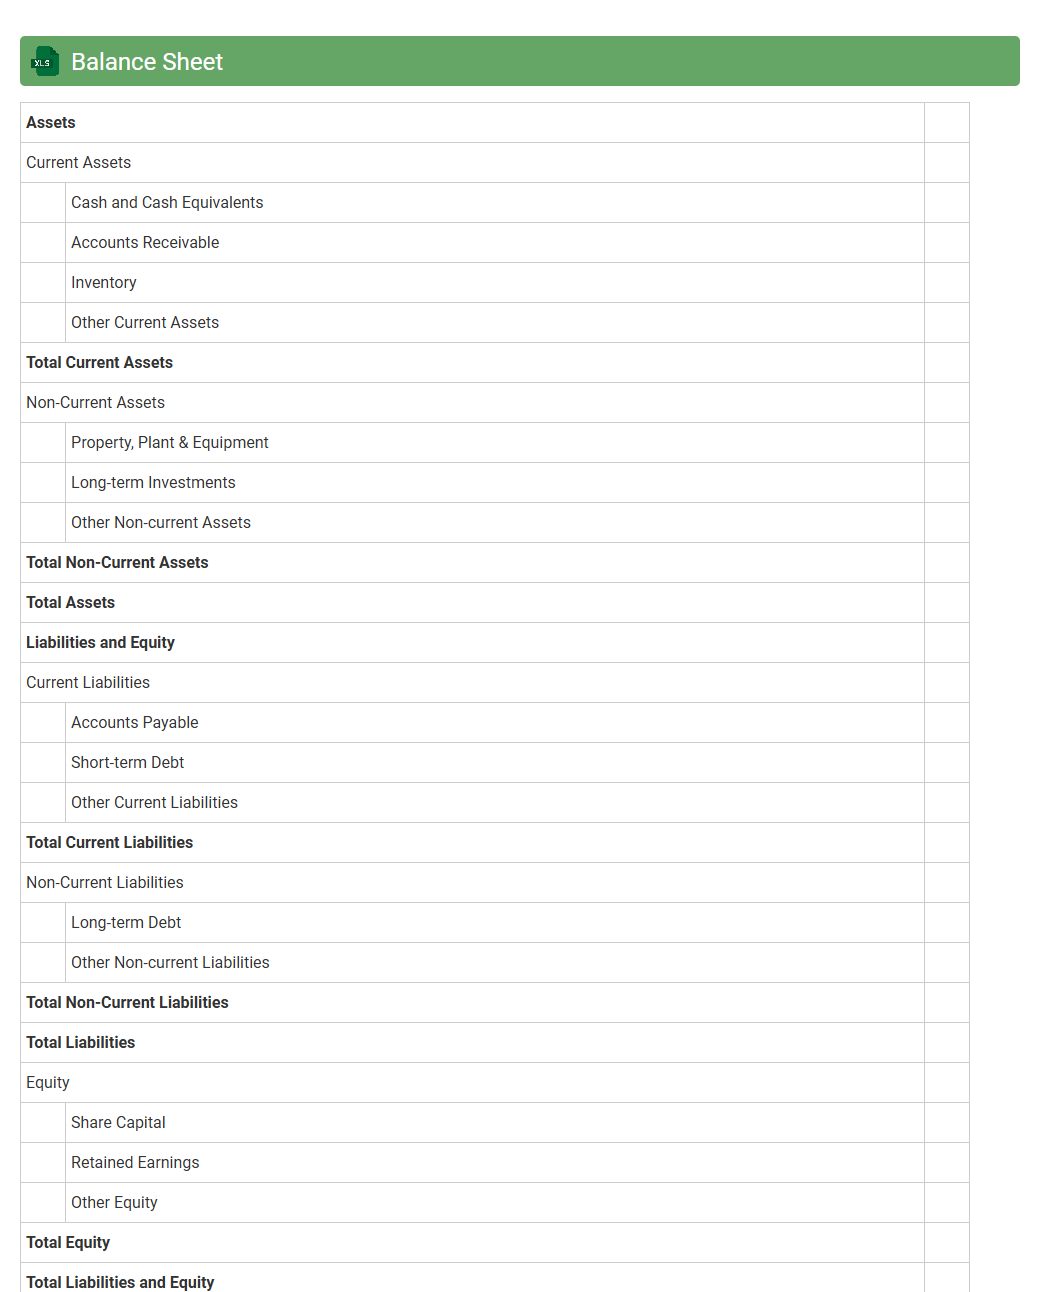
Balance Sheet
A
Balance Sheet Excel document is a digital spreadsheet tool designed to organize and present a company's financial position by listing assets, liabilities, and equity at a specific point in time. It helps users quickly analyze financial health, track net worth, and make informed decisions regarding budgeting, investments, and risk management. The spreadsheet format allows for easy updating, customization, and integration with other financial data for comprehensive reporting.
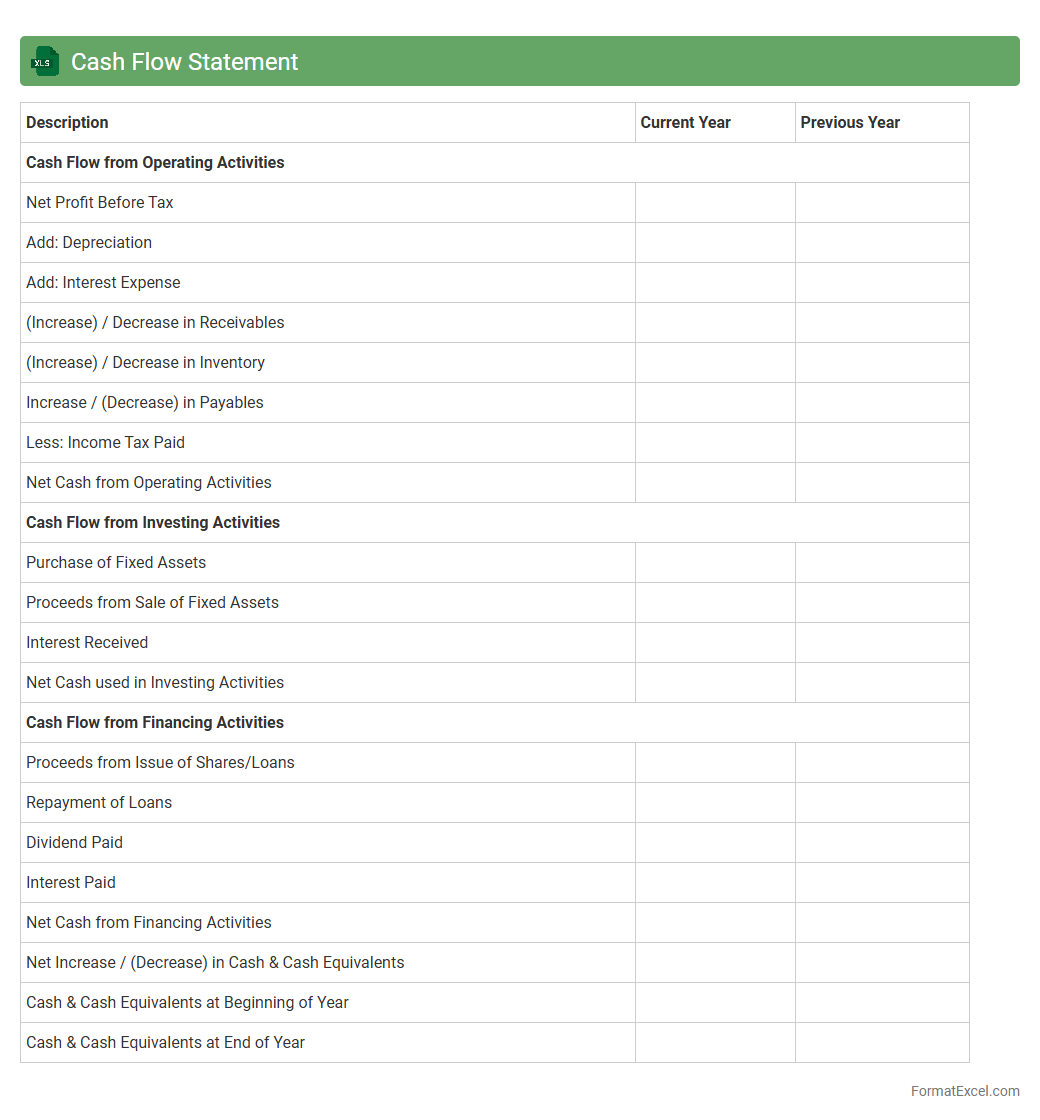
Cash Flow Statement
A
Cash Flow Statement Excel document is a financial tool that tracks the inflows and outflows of cash within a business over a specific period. It helps users monitor liquidity, ensuring that a company has enough cash to meet its obligations and make informed financial decisions. By analyzing this statement, businesses can optimize cash management, forecast future cash needs, and improve overall financial stability.
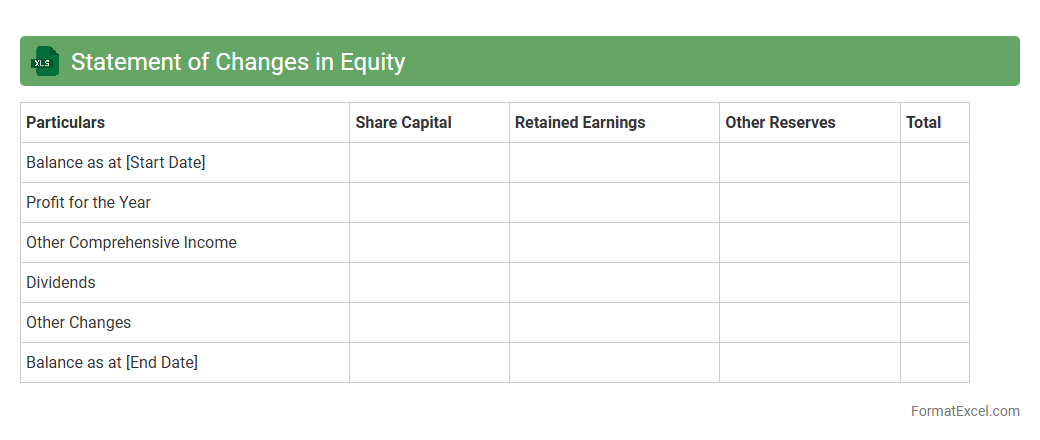
Statement of Changes in Equity
The
Statement of Changes in Equity Excel document tracks a company's equity movements over a specific period, detailing share capital, retained earnings, and other comprehensive income. It is useful for investors and management to analyze ownership changes, profit distribution, and financial stability. By providing a clear breakdown of equity fluctuations, it supports informed decision-making and strategic planning.
Notes to Financial Statements
A
Notes to Financial Statements Excel document provides detailed explanations and additional context to the figures presented in the financial reports, enhancing transparency and comprehension. It includes information on accounting policies, contingent liabilities, and significant transactions, which helps stakeholders make informed decisions. This document is essential for auditors, investors, and analysts to assess the accuracy and reliability of financial data.
Management Discussion and Analysis
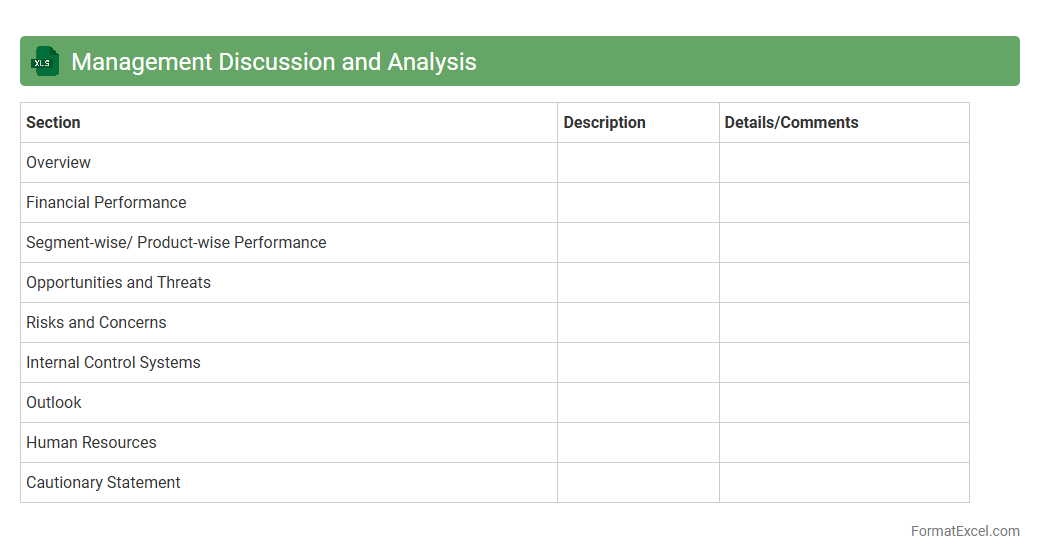
The
Management Discussion and Analysis (MD&A) Excel document is a structured tool designed to organize and analyze financial data, operational metrics, and strategic insights. It aids management in presenting a clear, concise overview of a company's financial performance, risks, and future outlook in a format suitable for stakeholders and regulatory requirements. Utilizing this document enhances decision-making by providing a comprehensive view of trends, variances, and management's narrative in a data-driven manner.
Auditor’s Report
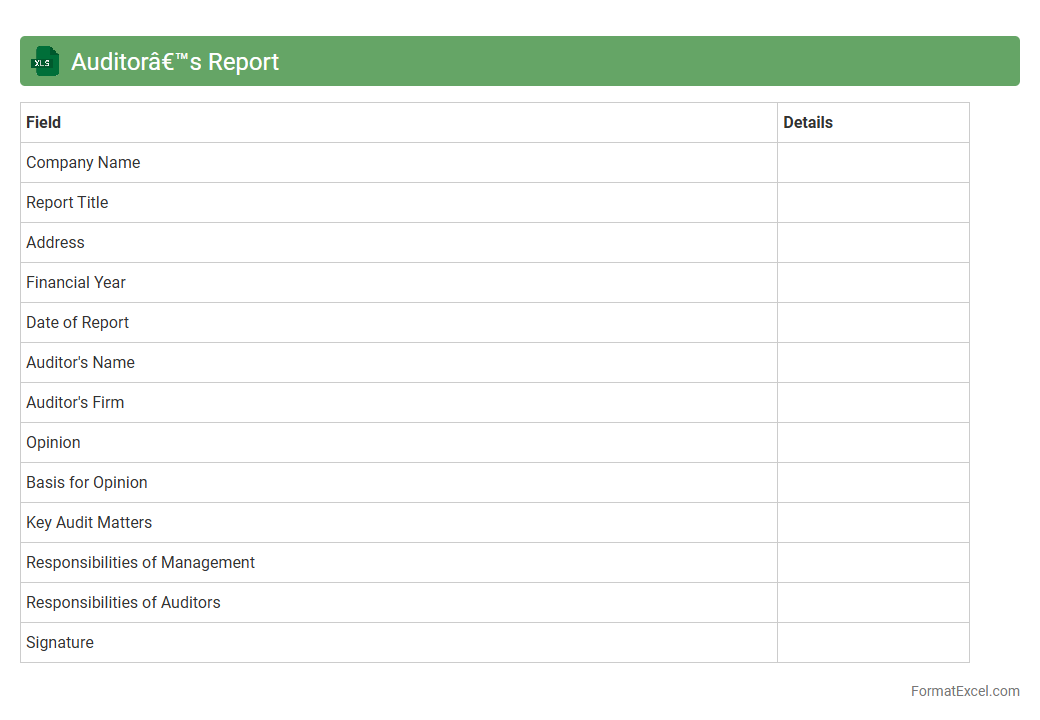
The
Auditor's Report Excel document is a structured spreadsheet designed to compile and analyze financial audit findings efficiently. It enables users to organize audit data, track discrepancies, and generate comprehensive reports that support transparency and compliance with regulatory standards. This tool facilitates accurate financial reviews, streamlines audit processes, and enhances decision-making by providing clear and accessible audit insights.
Corporate Governance Report
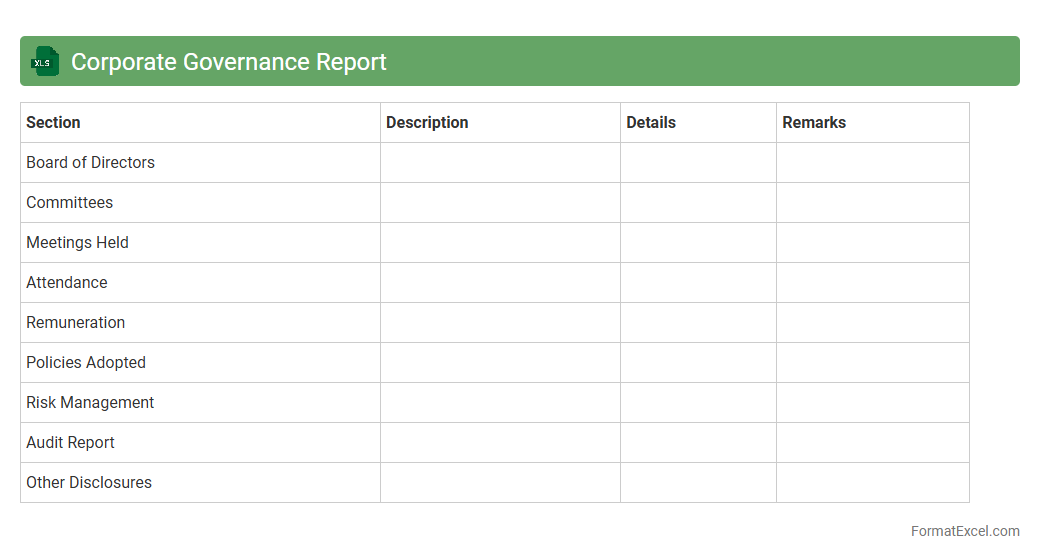
The
Corporate Governance Report Excel document is a structured file that compiles key data on a company's governance practices, board composition, compliance status, and stakeholder engagement metrics. It helps investors, analysts, and regulatory bodies assess transparency, accountability, and risk management within an organization. By providing a clear overview of governance frameworks, this report supports informed decision-making and enhances corporate accountability.
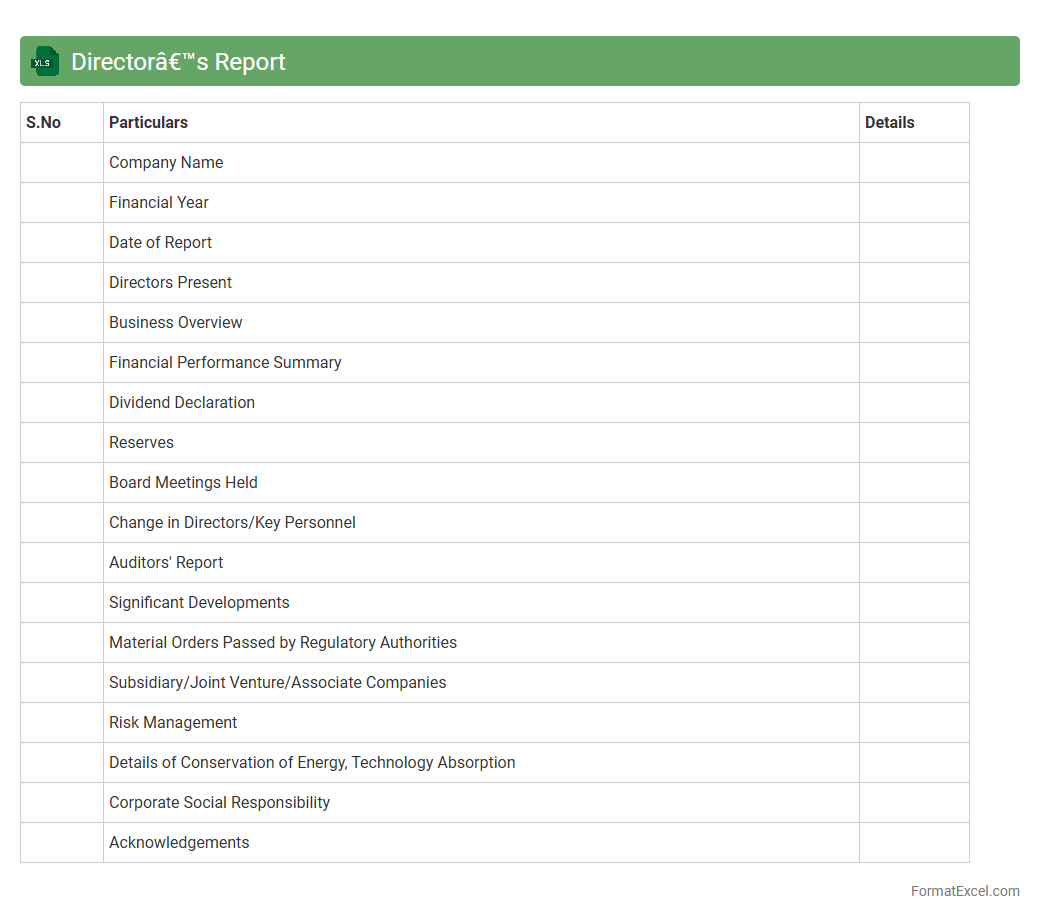
Director’s Report
The
Director's Report Excel document is a structured file used to compile and present key financial and operational data required for board meetings and regulatory compliance. It streamlines the process of summarizing company performance, enabling directors to make informed decisions based on accurate, up-to-date information. This document enhances transparency and accountability by providing a clear overview of business metrics and strategic initiatives.
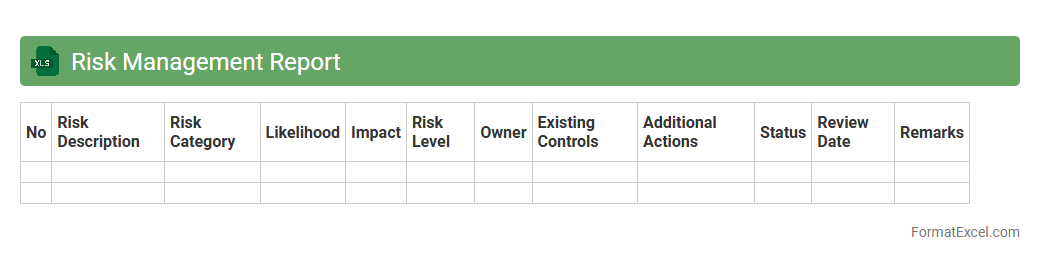
Risk Management Report
A
Risk Management Report Excel document systematically compiles potential risks, their impact, and mitigation strategies in a structured format, enabling clear identification and assessment. It serves as a vital tool for tracking risk status, prioritizing issues based on severity, and facilitating informed decision-making. Utilizing this report enhances organizational preparedness and helps minimize financial and operational disruptions.
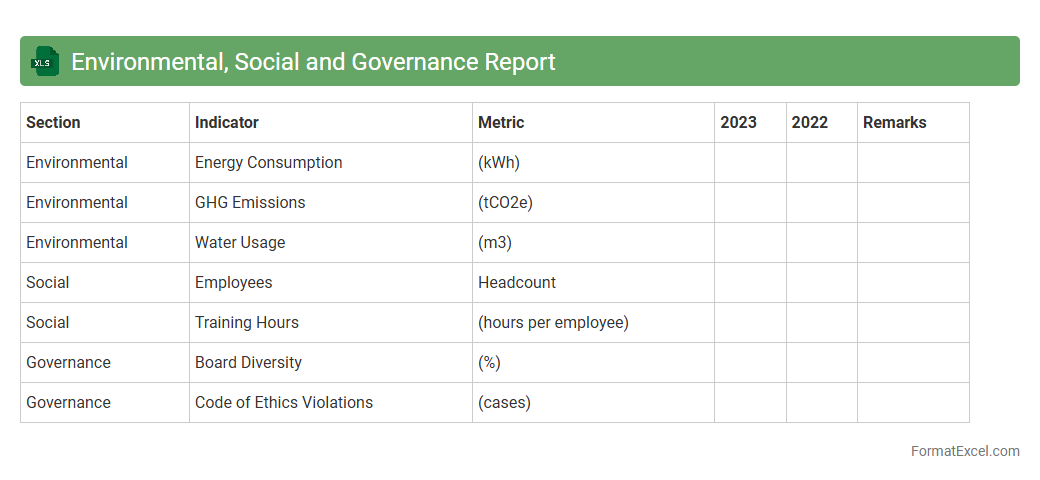
Environmental, Social and Governance Report
An
Environmental, Social and Governance (ESG) Report Excel document systematically organizes data related to a company's sustainability practices, social responsibility efforts, and governance policies. This document enables stakeholders to analyze performance metrics such as carbon emissions, labor practices, and board diversity efficiently. Utilizing an ESG report in Excel supports informed decision-making by providing clear, transparent, and comparable data crucial for investors, regulators, and corporate managers.
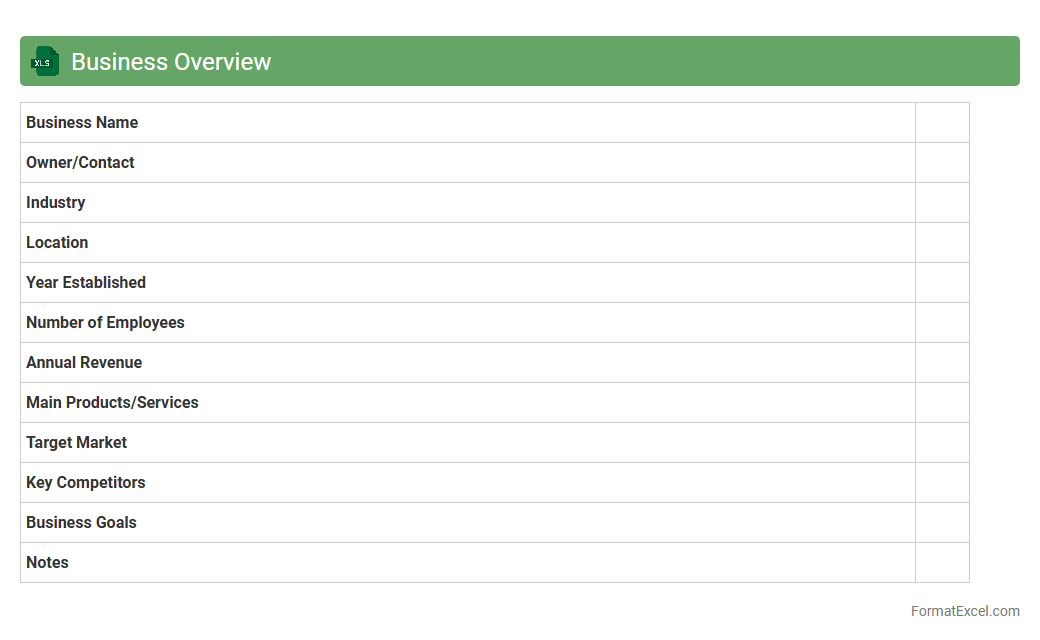
Business Overview
A
Business Overview Excel document is a structured spreadsheet that consolidates essential company data such as financial metrics, project statuses, and operational KPIs, providing a comprehensive snapshot of business performance. This tool enables stakeholders to analyze trends, make data-driven decisions, and monitor progress efficiently through customizable charts and tables. By centralizing core information, it enhances strategic planning, resource allocation, and communication across departments.
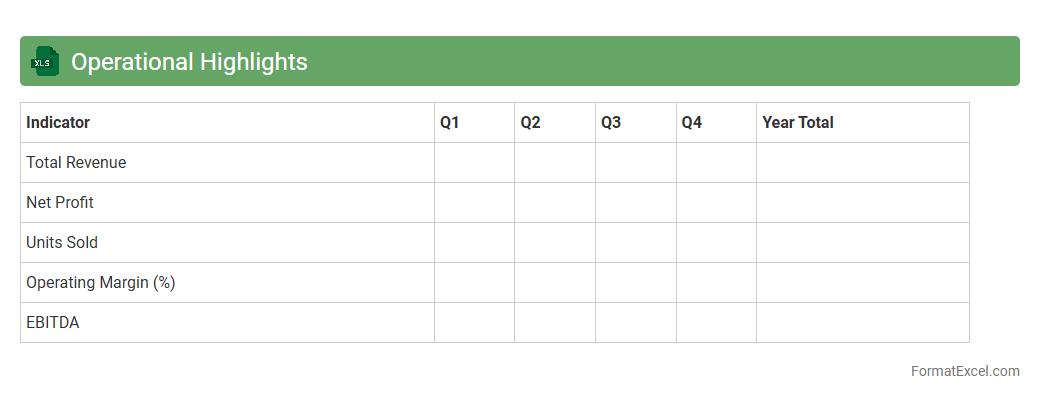
Operational Highlights
The
Operational Highlights Excel document is a comprehensive tool designed to track and analyze key performance indicators and business metrics in a structured format. It enables users to visualize operational data, identify trends, and make informed decisions based on real-time insights. By consolidating critical information in one place, this document enhances efficiency, improves reporting accuracy, and supports strategic planning efforts across departments.
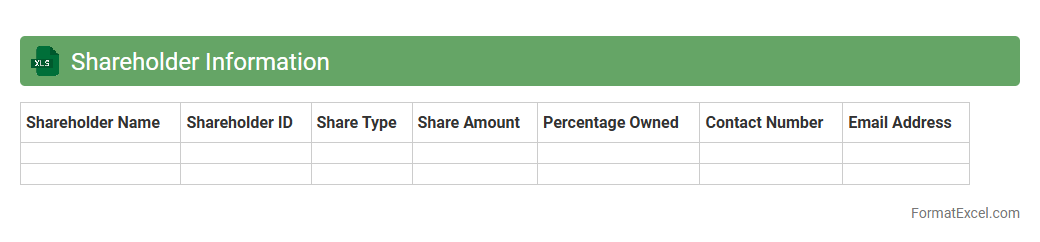
Shareholder Information
A
Shareholder Information Excel document compiles essential data about company shareholders, including names, contact details, shareholdings, and transaction history. It allows businesses to track ownership distribution, manage shareholder communications, and ensure compliance with corporate governance regulations. This organized format facilitates quick analysis and reporting, aiding strategic decision-making and investor relations management.
Dividend Policy
A
Dividend Policy Excel document is a financial tool used to analyze and determine the distribution of a company's earnings to shareholders in the form of dividends. It helps businesses model various dividend payout scenarios, assess their impact on retained earnings, and support strategic decision-making for sustainable growth. By using this document, companies can optimize shareholder value while maintaining adequate reinvestment for future expansion.
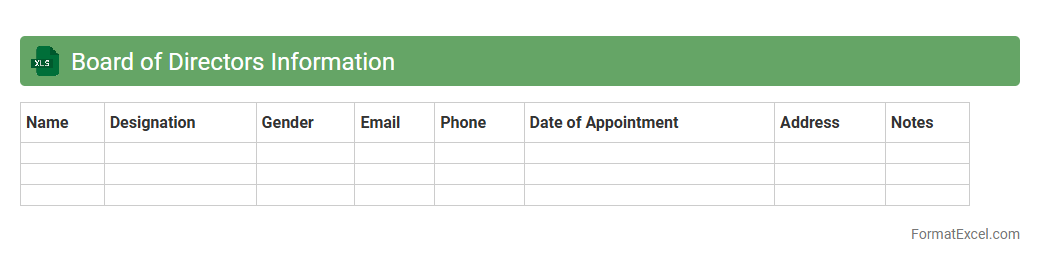
Board of Directors Information
The
Board of Directors Information Excel document is a structured file that compiles essential data about company board members, including names, roles, contact information, and tenure. This document is useful for tracking governance, facilitating communication, and ensuring compliance with corporate regulations. It streamlines decision-making processes by providing a clear overview of the board's composition and expertise.
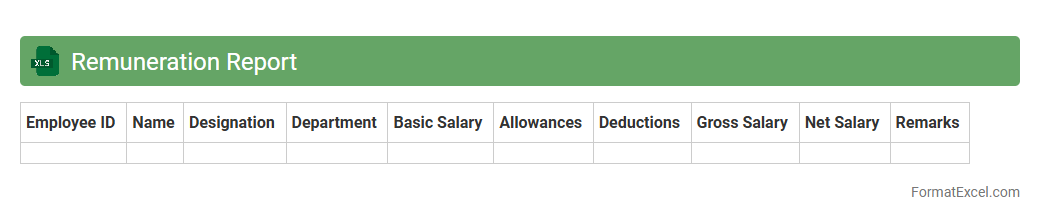
Remuneration Report
A
Remuneration Report Excel document systematically records and analyzes employee compensation details, including salaries, bonuses, and benefits. It enables organizations to review pay structures, ensure compliance with compensation policies, and support transparent decision-making processes. By providing clear data insights, this report helps optimize workforce cost management and enhances payroll accuracy.
Sustainability Report
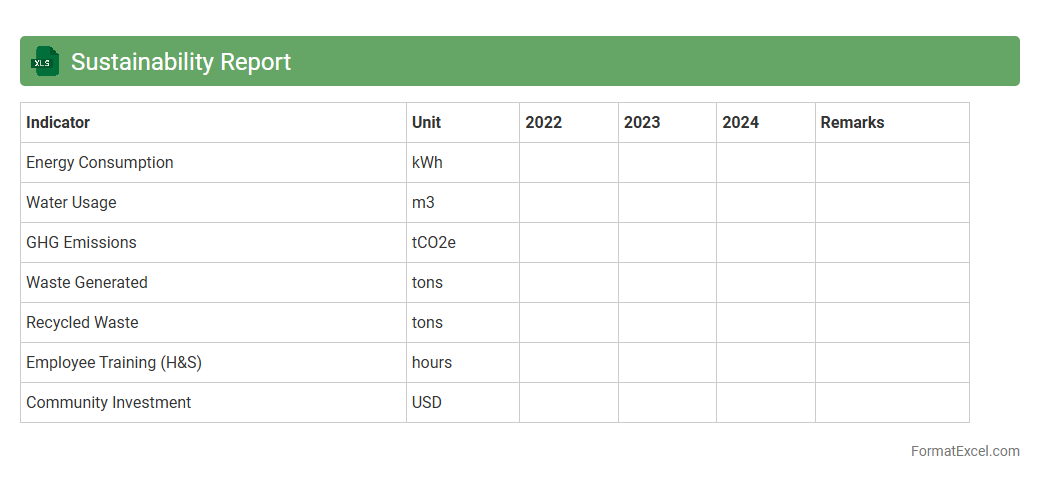
A
Sustainability Report Excel document is a structured spreadsheet designed to compile, analyze, and present data related to environmental, social, and governance (ESG) performance. It enables organizations to track key sustainability metrics such as carbon footprint, energy consumption, waste management, and social impact indicators in an organized and easily accessible format. This tool supports informed decision-making, compliance with reporting standards, and transparency for stakeholders seeking to evaluate corporate sustainability efforts.
Key Performance Indicators
A
Key Performance Indicators (KPI) Excel document is a structured spreadsheet designed to track, measure, and analyze critical business metrics in real-time. This tool helps organizations monitor progress against strategic goals by consolidating quantitative data such as sales figures, customer satisfaction scores, and operational efficiency measures. Utilizing KPI Excel documents enhances decision-making efficiency by providing visual charts, automated calculations, and easy customization tailored to specific industry needs.
Segment Information
Segment Information excel document organizes financial and operational data by business units or geographic locations, providing detailed insights into individual performance. It is useful for analyzing revenue streams, cost structures, and profitability across different segments, enabling better decision-making and resource allocation. This document supports strategic planning by highlighting key trends and variances within specific market segments, making
Segment Information essential for comprehensive financial analysis.
Five-Year Financial Summary
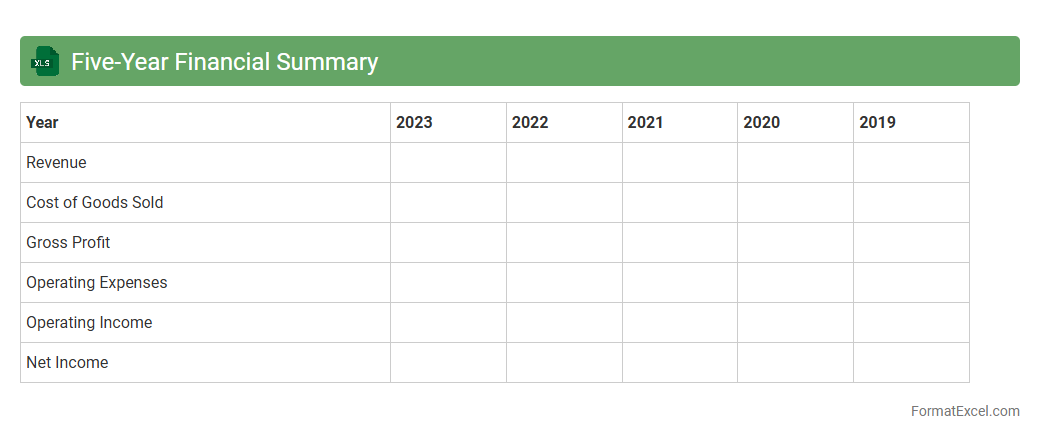
A
Five-Year Financial Summary Excel document consolidates key financial data such as revenue, expenses, net profit, and cash flow over a five-year period, enabling clear trend analysis and performance assessment. This tool is essential for investors, analysts, and management to evaluate financial stability, forecast future growth, and make informed strategic decisions. By organizing data in a structured manner, it simplifies complex financial information and enhances accuracy in reporting and comparison.
Major Shareholders
The
Major Shareholders Excel document compiles detailed information on significant equity holders within a company, including their ownership percentages and transaction history. This tool is essential for analyzing power dynamics, voting rights, and potential influence on corporate decisions. It supports strategic planning, investor relations, and compliance by providing clear visibility into shareholder structures.
Related Party Transactions
A
Related Party Transactions Excel document is a specialized spreadsheet used to record, track, and analyze financial dealings between a company and its related parties, such as subsidiaries, affiliates, or key management personnel. This tool is essential for ensuring transparency, compliance with accounting standards, and regulatory requirements by maintaining detailed records of these transactions. It helps stakeholders identify potential conflicts of interest, monitor contract terms, and evaluate the financial impact on the organization.
Financial Ratios
A
Financial Ratios Excel document is a spreadsheet tool designed to calculate and analyze key financial metrics such as liquidity, profitability, efficiency, and solvency ratios. It helps businesses and investors assess financial health, make informed decisions, and identify trends by organizing data in a clear, accessible format. Utilizing this document streamlines financial analysis, enabling quick comparisons across periods or companies for strategic planning and performance evaluation.
Future Outlook
The
Future Outlook Excel document is a powerful tool designed to project and analyze financial and business trends over a specified period. It helps users make informed decisions by organizing data, forecasting revenue, expenses, and growth opportunities using customizable models and formulas. This document enhances strategic planning, budgeting accuracy, and risk management by providing clear insights into potential future scenarios.
Introduction to Annual Report Formats
An annual report format serves as a structured template to present a company's yearly performance clearly. Using the right format ensures all vital information is communicated effectively to stakeholders. Excel is a popular tool for designing and organizing these detailed financial documents.
Key Components of an Annual Report
Effective annual reports include sections such as the executive summary, financial statements, and management discussion. These components provide stakeholders with a comprehensive view of the company's health and strategy. Each part plays a unique role in conveying data and insights succinctly.
Benefits of Using Excel for Annual Reports
Excel offers powerful data analysis, visualization, and customization features ideal for annual report creation. Its flexibility allows users to design dynamic reports that can be easily updated and shared. Additionally, Excel's formulas and charts help present financial data accurately.
Essential Sections to Include in Your Excel Report
Include financial summaries, profit and loss statements, balance sheets, and cash flow analysis as core sections. Supplement these with charts, notes, and performance metrics to enhance readability. Covering all essential areas ensures a well-rounded annual report.
Step-by-Step Guide to Creating an Annual Report in Excel
Start by outlining your report's structure, inputting raw data, and formatting tables for clarity. Next, use Excel tools like pivot tables and charts for insightful visualization. Finally, review for accuracy and design consistency before finalizing your report.
Sample Annual Report Layouts in Excel
Explore templates featuring clear navigation, summarized metrics, and visual aids like bar graphs or pie charts. These layouts facilitate easy data interpretation and professional presentation. Selecting a sample layout saves time and enhances efficiency.
Tips for Formatting Your Annual Report in Excel
Use consistent fonts, color schemes, and cell styles to maintain visual coherence throughout the document. Highlight critical figures with bold or colored fonts to draw attention. Proper formatting promotes readability and emphasizes key information.
Common Mistakes to Avoid in Excel Annual Reports
Avoid cluttered layouts, inconsistent data, and missing legends for charts to maintain report precision. Double-check formulas and data entries to prevent errors. Clear organization and accuracy are vital components of trustworthy reports.
Best Excel Templates for Annual Reports
Choose templates that balance detail with simplicity, featuring ready-made financial tables and customizable graphs. The best templates allow for easy updates and support dynamic data importing. Utilizing high-quality templates streamlines report creation.
Exporting, Sharing, and Printing Your Excel Annual Report
Export your annual report to PDF for a secure and universally accessible format. Use Excel's sharing features for real-time collaboration with shareholders. For physical copies, ensure printing settings preserve the layout and readability.