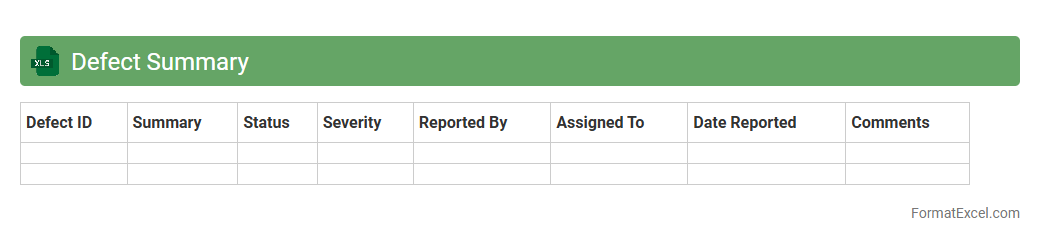
Defect Summary
A
Defect Summary Excel document is a comprehensive file used to track and consolidate all identified defects or bugs within a software project. It provides valuable data such as defect ID, description, status, priority, and assigned personnel, enabling easy monitoring and efficient management of issues. This document is essential for improving project quality, facilitating communication among teams, and ensuring timely resolution of defects.
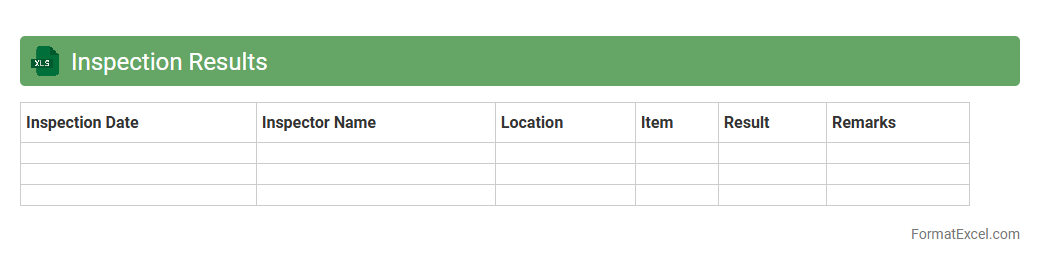
Inspection Results
The
Inspection Results Excel document is a structured file that records and organizes data from quality checks, audits, or product inspections. It allows users to easily track compliance, identify defects, and analyze trends over time for informed decision-making. This document enhances transparency and efficiency in quality control processes, ensuring consistent standards are maintained.
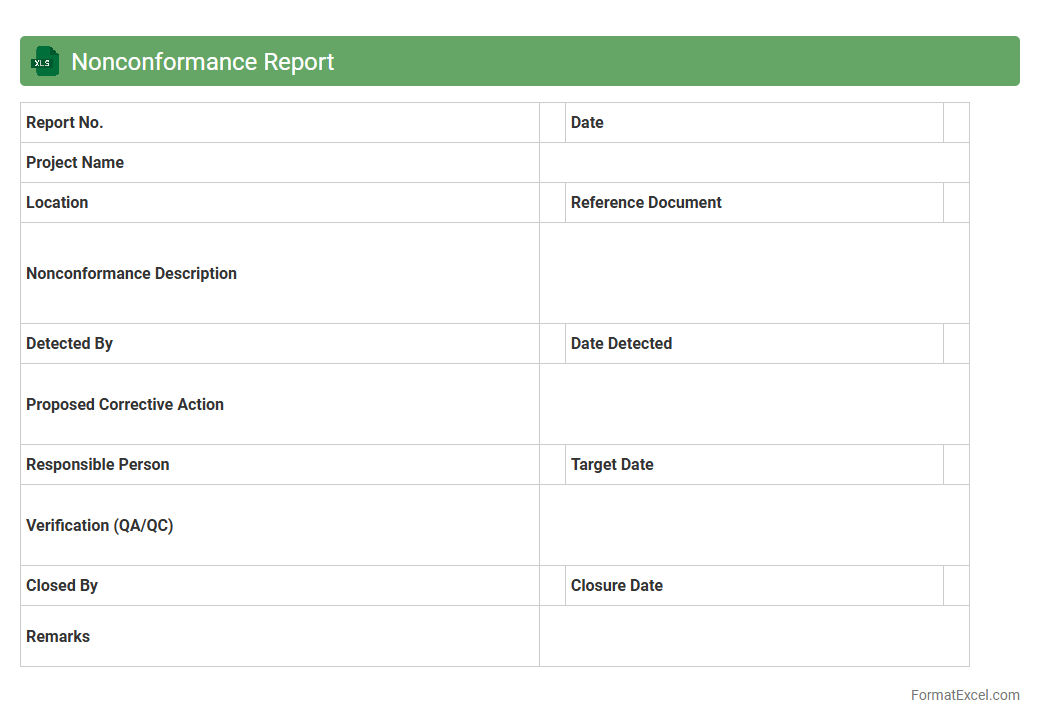
Nonconformance Report
A
Nonconformance Report (NCR) Excel document is a structured spreadsheet used to document instances where products or processes fail to meet specified standards or requirements. It facilitates tracking, analyzing, and managing deviations to ensure corrective actions are implemented promptly, improving overall quality control. This tool is essential for maintaining compliance, reducing defects, and enhancing operational efficiency in quality management systems.
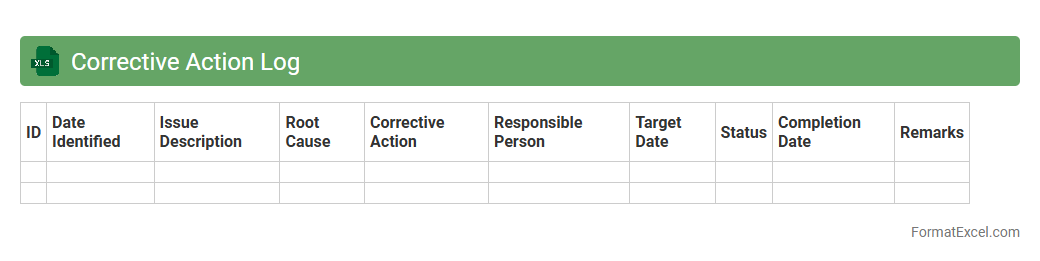
Corrective Action Log
A
Corrective Action Log Excel document is a structured tool used to systematically record, track, and manage corrective actions arising from audits, inspections, or quality control processes. It helps organizations monitor the status, deadlines, responsibilities, and outcomes of each corrective action, ensuring timely resolution and accountability. This log enhances process improvement, compliance adherence, and risk mitigation by providing clear visibility and documentation of problem-solving efforts.
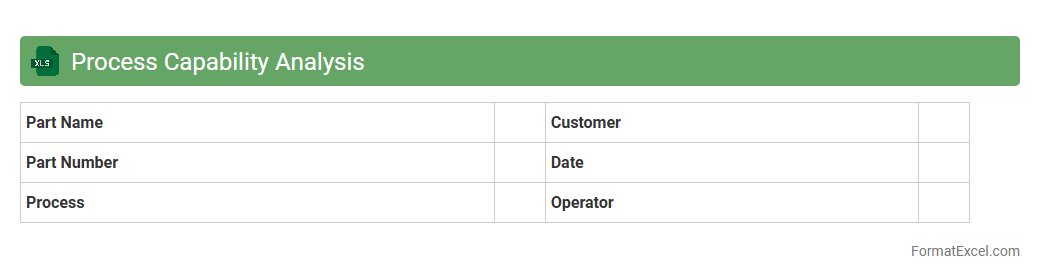
Process Capability Analysis
Process Capability Analysis Excel document is a tool designed to evaluate the performance of manufacturing or business processes by calculating key metrics such as Cp, Cpk, Pp, and Ppk. This document helps identify how well a process meets specified limits and highlights areas for improvement, ultimately aiding in maintaining consistent quality and reducing variability. Using this
Process Capability Analysis Excel tool enables data-driven decision-making, ensuring processes are efficient and compliant with industry standards.
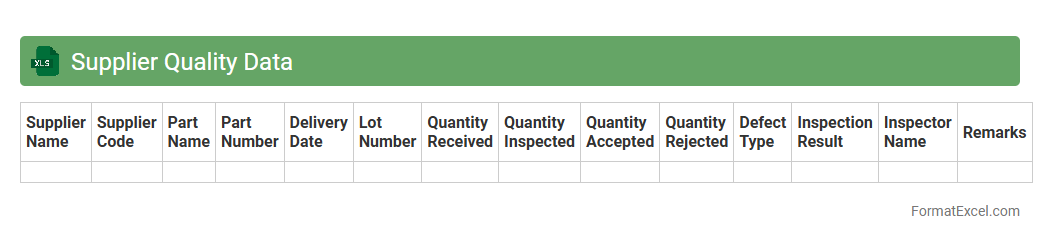
Supplier Quality Data
A
Supplier Quality Data Excel document is a structured spreadsheet used to collect, track, and analyze quality metrics from suppliers, including defect rates, compliance scores, and delivery performance. This document facilitates data-driven decision-making by highlighting areas for supplier improvement, ensuring product consistency, and managing risk in the supply chain. It is essential for maintaining high-quality standards, optimizing supplier relationships, and supporting continuous improvement initiatives.
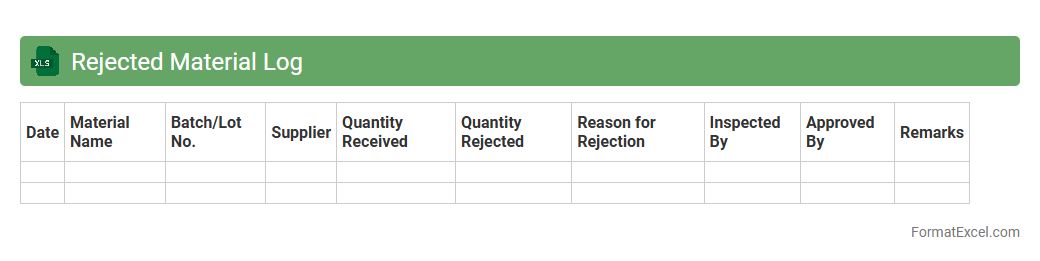
Rejected Material Log
The
Rejected Material Log Excel document is a detailed record of all materials that fail to meet quality standards during production or inspection processes. It helps track reasons for rejection, quantities involved, and responsible batches or suppliers, enabling efficient quality control and root cause analysis. This log supports inventory management by preventing defective items from proceeding further, ultimately reducing waste and improving overall production efficiency.
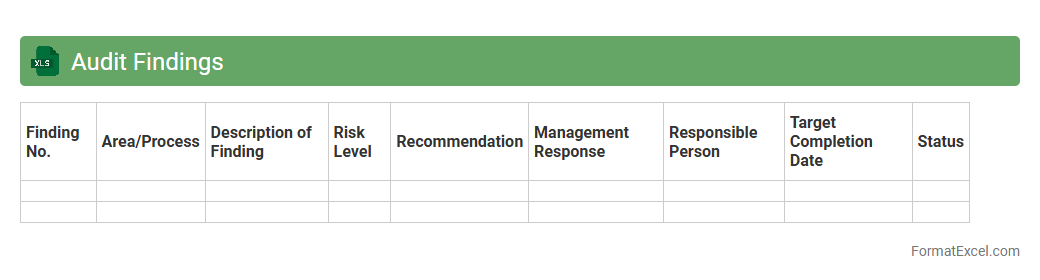
Audit Findings
An
Audit Findings Excel document systematically records identified issues, observations, and recommendations from an audit process, enabling clear tracking of compliance and operational risks. It helps organizations prioritize corrective actions, monitor progress, and ensure accountability by consolidating audit results in an accessible, structured format. Utilizing this tool enhances transparency, supports decision-making, and drives continuous improvement in governance and internal controls.
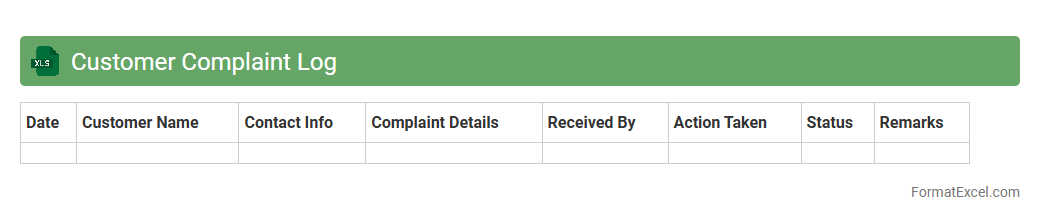
Customer Complaint Log
A
Customer Complaint Log Excel document is a structured file used to systematically record and track customer complaints, including details such as complaint date, customer information, issue description, resolution status, and follow-up actions. This log enables businesses to identify recurring problems, monitor response times, and enhance customer satisfaction through data-driven improvements. Using this document helps streamline complaint management processes and supports accountability by providing clear documentation for analysis and reporting.
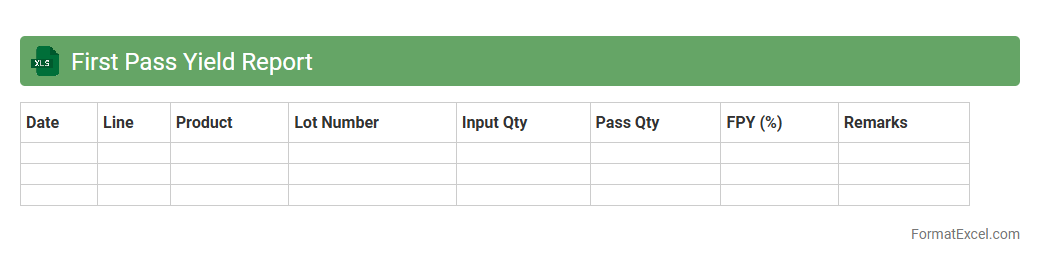
First Pass Yield Report
A
First Pass Yield Report Excel document tracks the percentage of products that pass quality inspection without rework or defects during the initial manufacturing or production stage. This report is essential for identifying process inefficiencies, reducing waste, and improving overall product quality by highlighting areas needing improvement. Businesses leverage this data to enhance operational performance, increase customer satisfaction, and lower production costs.
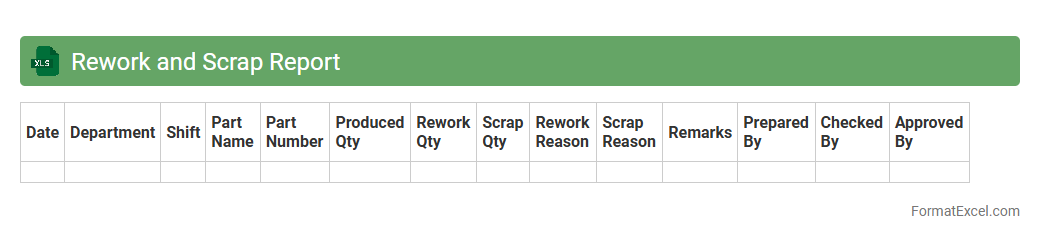
Rework and Scrap Report
The
Rework and Scrap Report Excel document tracks defective or non-conforming products that require reprocessing or disposal, enabling efficient monitoring of production quality issues. It helps identify recurring defects, quantify material losses, and analyze root causes, supporting targeted improvements and cost reduction strategies. This report enhances operational efficiency by providing clear insights into manufacturing performance and waste management.
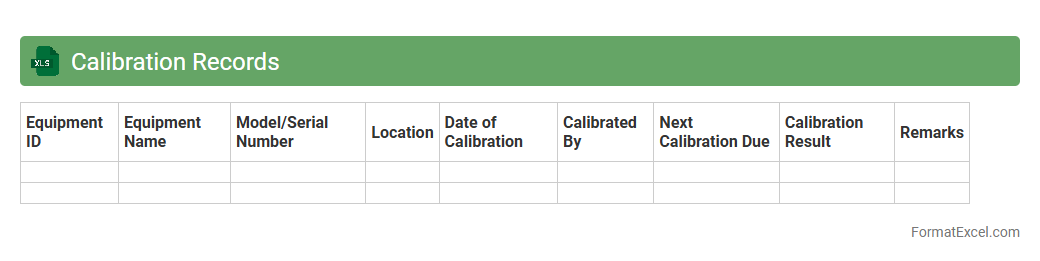
Calibration Records
A
Calibration Records Excel document is a structured digital file used to systematically log and track the calibration status, dates, and results of measuring instruments and equipment. It helps ensure compliance with quality standards by maintaining accurate and up-to-date calibration history, facilitating audit readiness and reducing the risk of errors in measurements. Organizations rely on this document to enhance equipment reliability, improve operational efficiency, and support traceability in quality management systems.
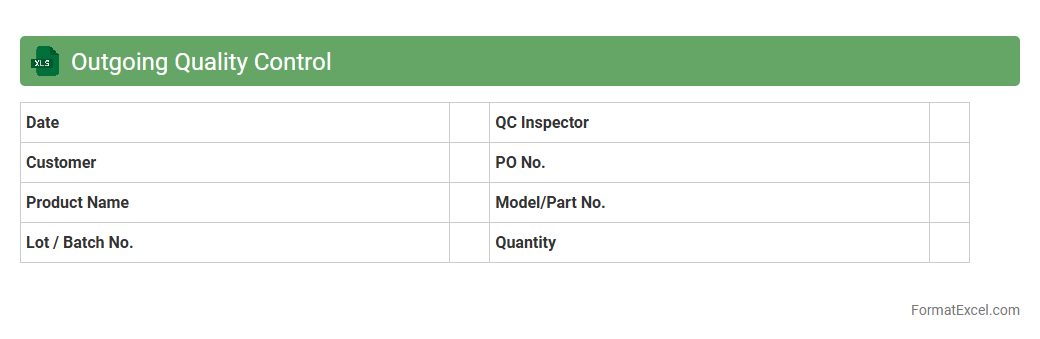
Outgoing Quality Control
An
Outgoing Quality Control (OQC) Excel document is a structured spreadsheet used to systematically record and analyze the quality inspection results of finished products before shipment. It helps ensure that all products meet predefined quality standards by tracking defects, inspection criteria, and acceptance status, thereby reducing the risk of customer returns and complaints. Utilizing this document enhances quality assurance processes, supports data-driven decision making, and facilitates continuous improvement in product manufacturing and delivery.
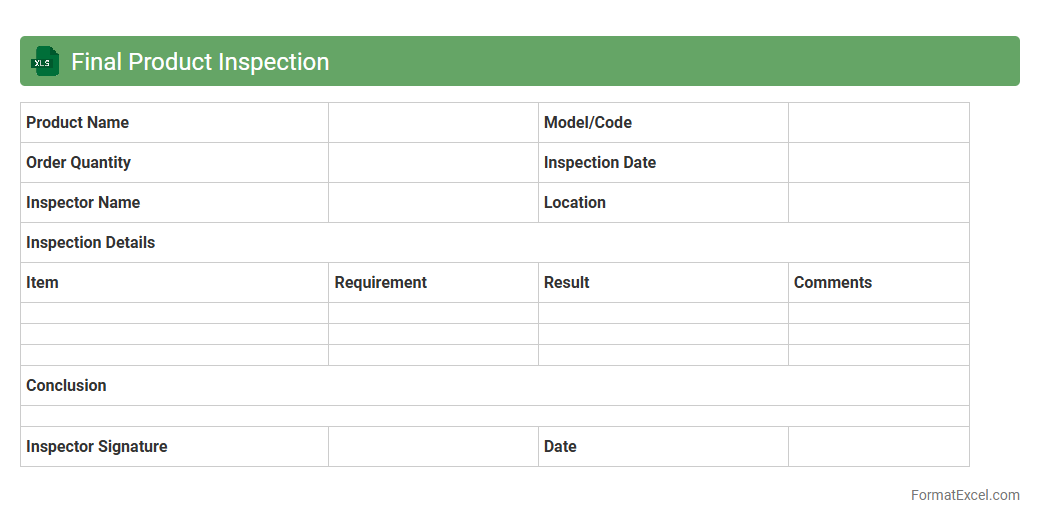
Final Product Inspection
A
Final Product Inspection Excel document is a structured spreadsheet used to systematically record and evaluate the quality and compliance of finished products before shipment. It helps track key inspection criteria such as dimensions, functionality, and appearance, ensuring defects are identified and addressed. This tool enhances quality control processes, reduces risk of product returns, and supports consistent adherence to manufacturing standards.
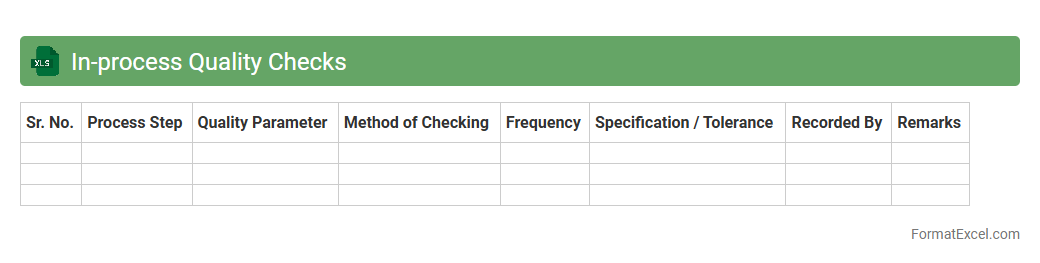
In-process Quality Checks
An
In-process Quality Checks Excel document is a tool used to systematically monitor and record quality parameters during the manufacturing or production process. It enables real-time tracking of product attributes against specified standards, helping to identify defects or deviations early. This proactive approach minimizes rework, reduces waste, and ensures consistent product quality, ultimately enhancing operational efficiency.
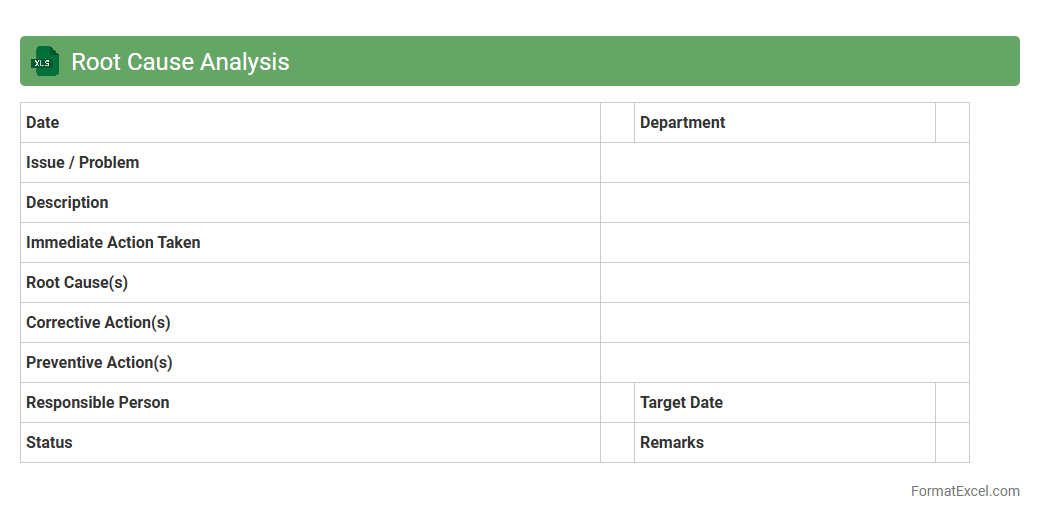
Root Cause Analysis
A
Root Cause Analysis Excel document is a structured spreadsheet designed to identify, analyze, and document the underlying causes of problems or incidents in a systematic way. It helps organizations track contributing factors, prioritize issues, and implement effective corrective actions to prevent recurrence. Using this tool improves decision-making, enhances problem-solving efficiency, and supports continuous process improvement initiatives.
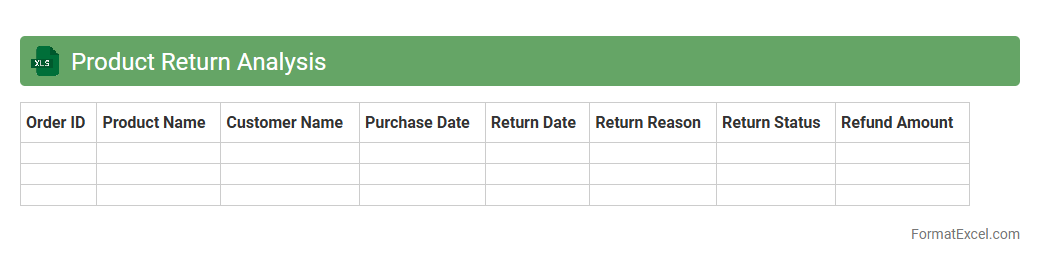
Product Return Analysis
Product Return Analysis excel document is a comprehensive tool designed to track and evaluate return patterns, reasons, and financial impact of returned products. It enables businesses to identify defects, improve product quality, and enhance customer satisfaction by analyzing return data systematically. Using this
Product Return Analysis sheet, companies can reduce losses, optimize inventory management, and make data-driven decisions for better operational efficiency.
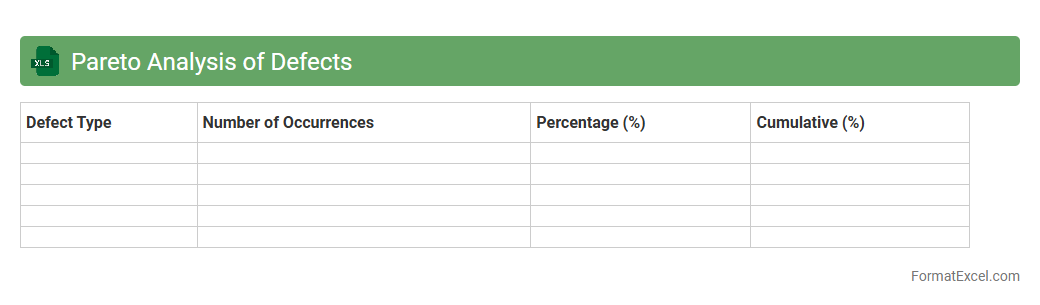
Pareto Analysis of Defects
Pareto Analysis of Defects in an Excel document is a data visualization tool that identifies the most significant causes of defects by categorizing and ranking them based on their frequency or impact. This analysis helps prioritize problem areas, enabling businesses to focus resources on resolving the issues that will yield the greatest improvement in quality and cost reduction. Using the Pareto chart in Excel facilitates informed decision-making by clearly highlighting the vital few defects among many trivial ones.
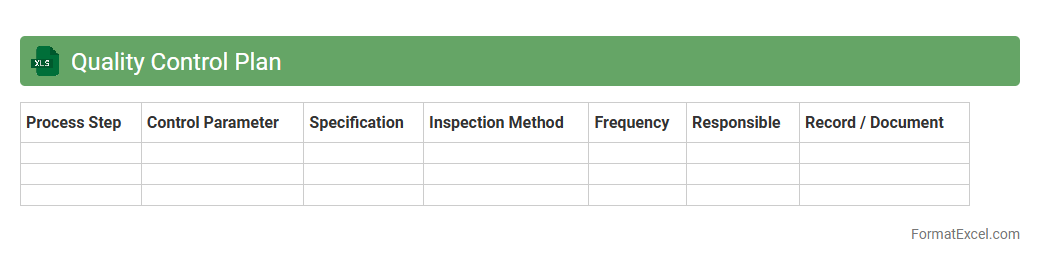
Quality Control Plan
A
Quality Control Plan Excel document is a structured tool used to outline and manage quality requirements, inspection procedures, and verification activities for a project or product. It enables teams to systematically track quality metrics, identify non-conformances, and ensure compliance with industry standards. By organizing quality data in an accessible format, this document enhances communication, accountability, and overall project efficiency.
Training Records
Training Records Excel document is a structured digital file that systematically organizes employee training data, including course titles, dates, completion status, and certifications. This document enhances workforce management by providing quick access to individual and team training histories, ensuring compliance with industry regulations, and identifying skill gaps for targeted development. Maintaining
accurate training records in Excel facilitates efficient tracking and reporting, streamlining HR processes and driving continuous employee growth.
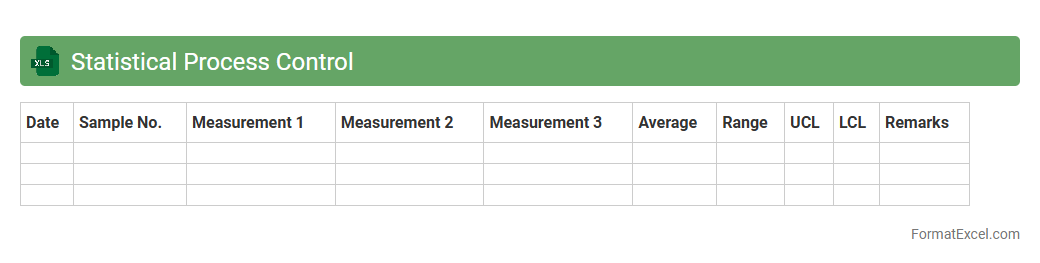
Statistical Process Control
A
Statistical Process Control (SPC) Excel document is a tool designed to monitor, control, and analyze manufacturing or business processes through statistical methods. It helps identify variations, detect trends, and maintain consistent quality by using control charts, histograms, and process capability analysis. This document is useful for improving process efficiency, reducing defects, and supporting data-driven decision-making in quality management systems.
Sampling Plan Results
The
Sampling Plan Results Excel document organizes and analyzes data collected from sampling processes, providing clear insights into product quality and consistency. It helps identify trends, trends, and potential issues by summarizing sample measurements, enabling faster, data-driven decision-making. This document is essential for ensuring compliance with quality standards and improving operational efficiency.
Conformance Rate Report
A
Conformance Rate Report Excel document measures the degree to which employees adhere to their scheduled work times, providing detailed insights into punctuality and attendance. This report is useful for identifying workforce compliance, optimizing staffing levels, and improving operational efficiency by highlighting deviations from planned schedules. Managers rely on these data-driven insights to enhance productivity and ensure service-level agreements are consistently met.
Gage R&R Study
A
Gage R&R Study Excel document is a specialized spreadsheet designed to assess measurement system variability by analyzing repeatability and reproducibility of measurement instruments. It helps identify measurement errors, ensuring data accuracy and reliability in quality control processes. This tool is essential for optimizing manufacturing precision and maintaining consistent product quality.
Warranty Claims Analysis
Warranty Claims Analysis Excel document is a powerful tool designed to track, analyze, and manage warranty claims data efficiently. By organizing claim information such as defect types, costs, and claim frequencies, it enables businesses to identify patterns, reduce expenses, and improve product quality. This analysis supports data-driven decisions that enhance customer satisfaction and optimize warranty-related processes.
Introduction to Quality Report Formats in Excel
Quality report formats in Excel provide a structured way to document and analyze the performance and quality metrics within a business. Using Excel enhances data organization, visualization, and decision-making processes. These formats help streamline quality management and present insights effectively.
Importance of Quality Reports for Business
Quality reports are crucial for monitoring product and service standards, ensuring continual improvement. They help businesses identify defects, track progress, and comply with regulatory requirements. Ultimately, these reports support informed decision-making to drive customer satisfaction.
Key Components of an Effective Quality Report
An effective quality report should include clear headings, well-organized data tables, visual charts, and summary analyses. It must highlight key metrics such as defect rates, process capability, and corrective actions. Proper formatting enhances readability and impact.
Excel Templates for Quality Reporting
Excel templates simplify the creation of quality reports by providing pre-designed structures optimized for quality tracking. These templates often feature built-in formulas, conditional formatting, and charts for quick data interpretation. Utilizing templates saves time and maintains consistency.
Step-by-Step Guide to Creating a Quality Report in Excel
Start by defining report objectives and gathering relevant data before inputting into Excel sheets. Use tables to organize data, apply formulas for calculations, and insert charts for visual representation. Finally, review and format the report to ensure clarity and accuracy.
Essential Excel Functions for Quality Reports
Functions such as SUMIF, AVERAGE, COUNTIF, and VLOOKUP are instrumental in analyzing quality data efficiently. These enable dynamic calculations and facilitate sorting and filtering of quality metrics. Mastering these functions improves report precision and usability.
Sample Quality Report Format in Excel
A sample quality report typically includes sections for quality objectives, data charts, defect analysis, and corrective action plans. It integrates dynamic tables and graphs for real-time data updates. Such formats provide a practical template that can be tailored to specific business needs.
Best Practices for Quality Report Layout
Use a clean, consistent layout with clear headings, color-coded data, and concise text to enhance comprehension. Prioritize critical information at the top, provide summaries, and avoid clutter. This ensures the report is user-friendly and actionable.
Common Mistakes to Avoid in Excel Quality Reporting
Avoid errors such as inconsistent data entry, overcomplicated formulas, and poor chart selection. Lack of version control and insufficient documentation can also compromise report reliability. Addressing these mistakes maintains data integrity and clarity.
Downloadable Quality Report Format Excel Templates
Many websites offer free and premium downloadable quality report Excel templates tailored for various industries. These templates provide a practical starting point with predefined formulas and layouts. Utilizing downloadable templates accelerates report preparation and standardization.