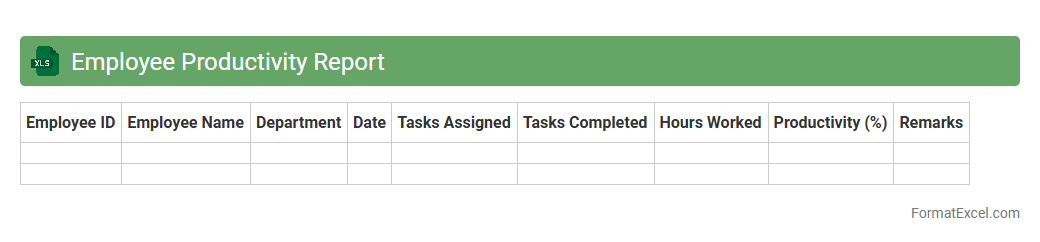
Employee Productivity Report
An
Employee Productivity Report Excel document tracks and analyzes individual and team performance metrics such as hours worked, tasks completed, and efficiency rates. It provides clear data visualization and insights that help managers identify high performers, detect bottlenecks, and optimize workforce allocation. Using this report aids in improving operational efficiency and supports data-driven decision-making for enhancing overall productivity.
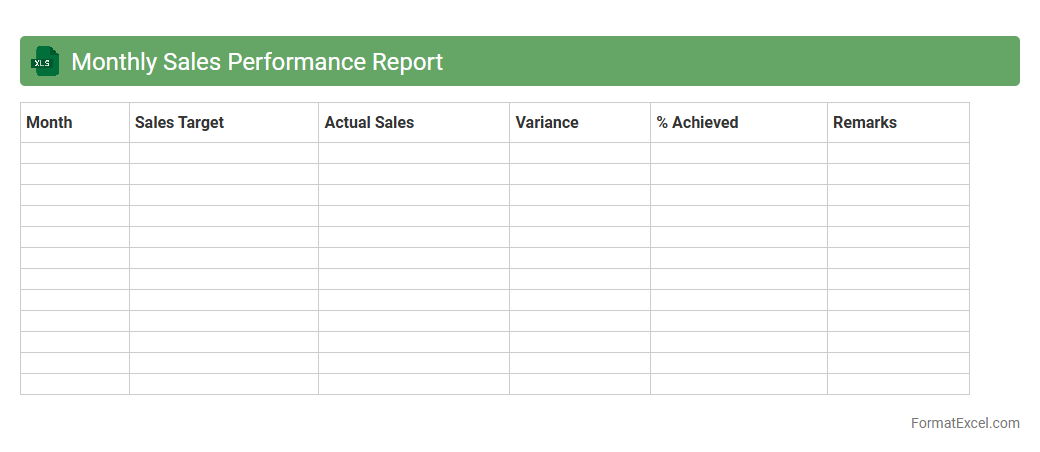
Monthly Sales Performance Report
The
Monthly Sales Performance Report Excel document tracks and analyzes sales data, providing insights into revenue trends, individual and team performance, and product sales effectiveness. It enables businesses to identify growth opportunities, measure progress against targets, and make informed strategic decisions. Using this report enhances forecasting accuracy and supports continuous improvement in sales operations.
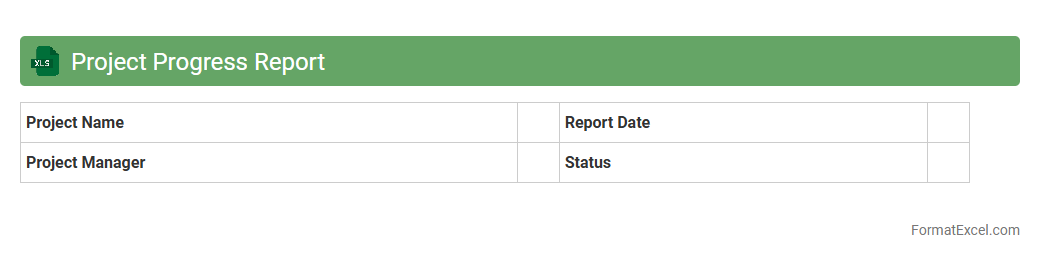
Project Progress Report
A
Project Progress Report Excel document is a tool designed to track and visualize the status of ongoing projects, including task completion percentages, milestones achieved, and resource allocation. It helps project managers and teams monitor timelines, identify potential delays, and optimize workflow efficiency by consolidating data into easy-to-analyze charts and tables. This report enhances communication, supports data-driven decision-making, and ensures transparency throughout the project lifecycle.
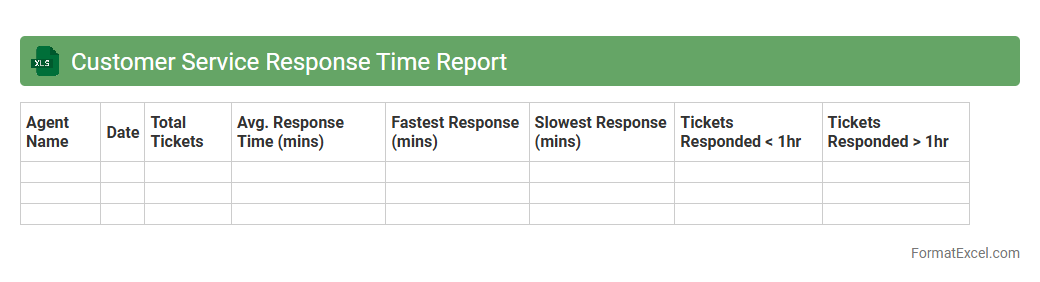
Customer Service Response Time Report
The
Customer Service Response Time Report Excel document tracks and analyzes the average time taken by customer support teams to respond to inquiries and resolve issues. This report enables businesses to identify trends, measure team performance, and pinpoint areas for improvement in customer service efficiency. By leveraging this data, companies can enhance customer satisfaction and streamline their support operations.
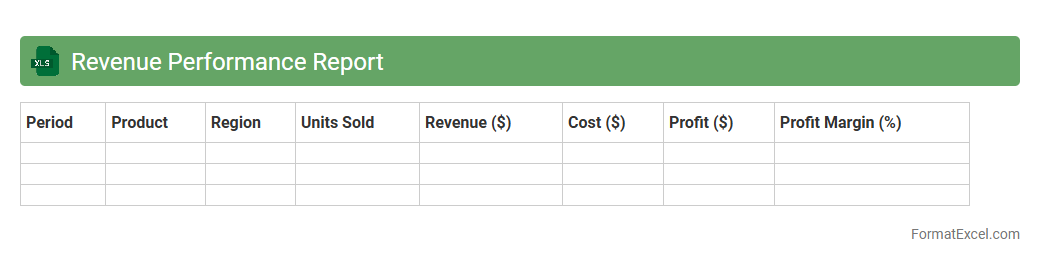
Revenue Performance Report
A
Revenue Performance Report Excel document systematically tracks and analyzes sales data, providing clear insights into revenue trends over specific periods. It helps businesses identify top-performing products or services, monitor sales targets, and make data-driven decisions to optimize profit margins. By consolidating financial metrics in an easy-to-read format, this report enhances forecasting accuracy and supports strategic planning.
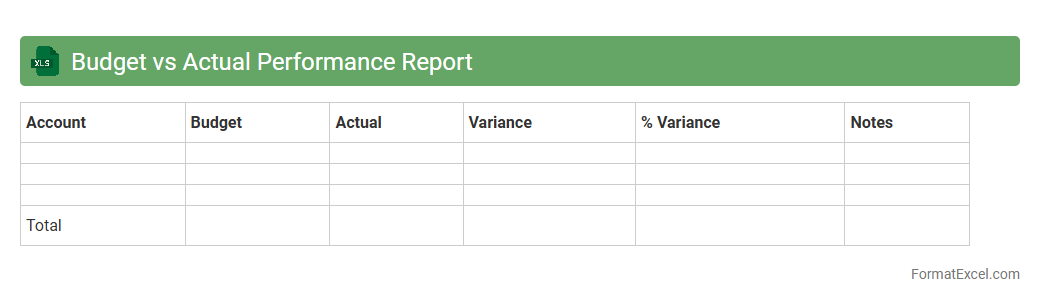
Budget vs Actual Performance Report
A
Budget vs Actual Performance Report in Excel compares planned financial goals against actual spending or revenue, allowing businesses to track deviations and manage resources effectively. By highlighting variances, this report helps identify areas where performance differs from expectations, facilitating informed decision-making and budget adjustments. It is essential for financial control, enhancing accountability, and ensuring alignment with strategic objectives.
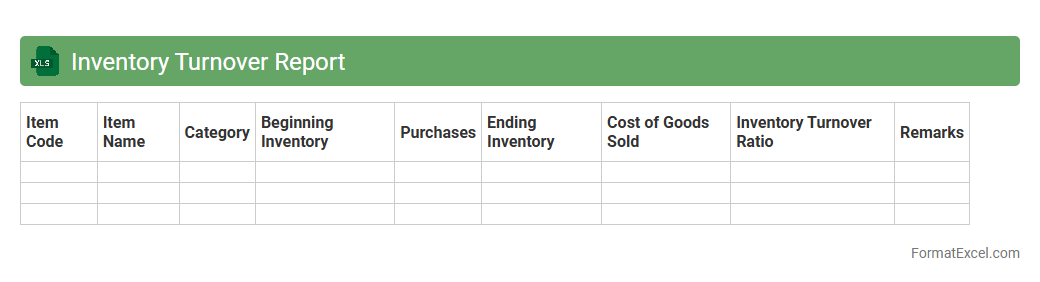
Inventory Turnover Report
An
Inventory Turnover Report in an Excel document tracks how quickly inventory is sold and replaced over a specific period, providing insights into product demand and stock management efficiency. It calculates turnover ratios by analyzing cost of goods sold (COGS) against average inventory levels, helping businesses optimize ordering and reduce holding costs. This report supports strategic decisions to improve cash flow, avoid stockouts, and enhance overall supply chain performance.
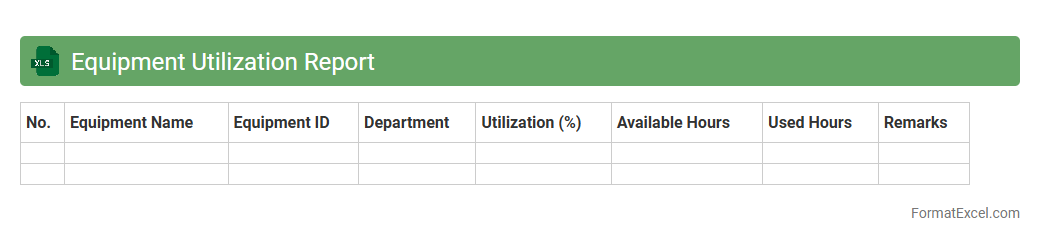
Equipment Utilization Report
An
Equipment Utilization Report Excel document tracks the usage, efficiency, and availability of machinery or equipment within a business. It provides detailed insights into operational performance, helping identify underused assets and optimize maintenance schedules. By analyzing this data, organizations can reduce downtime, improve productivity, and make informed decisions about equipment investments.
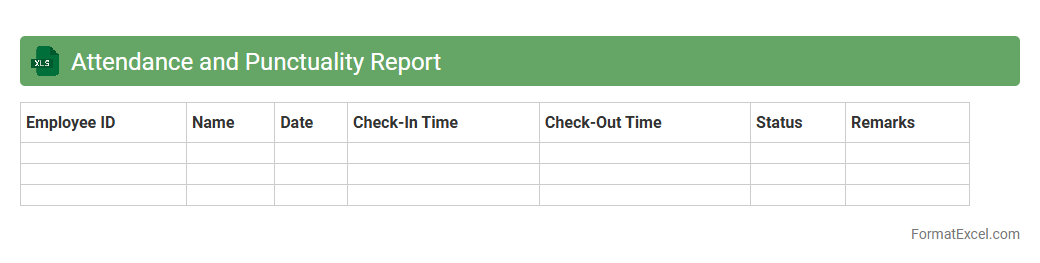
Attendance and Punctuality Report
An
Attendance and Punctuality Report Excel document tracks employee or student presence and timeliness, organizing data such as check-in times, absences, and late arrivals. This report provides clear insights into attendance patterns, enabling effective monitoring and management of workforce or classroom reliability. Utilizing this data aids in improving productivity, accountability, and overall operational efficiency.
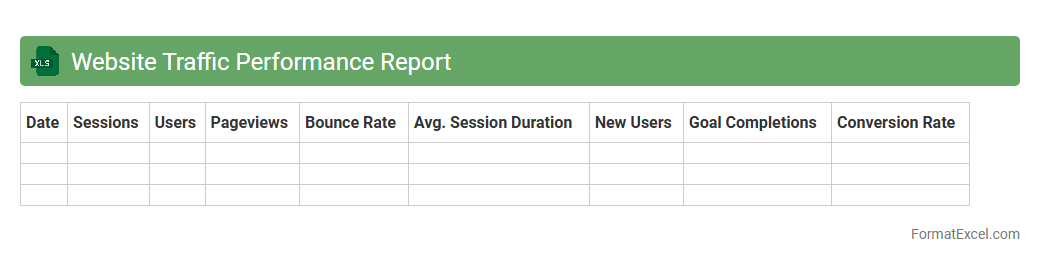
Website Traffic Performance Report
A
Website Traffic Performance Report Excel document compiles detailed metrics such as page views, unique visitors, bounce rates, and average session durations to evaluate website effectiveness. It enables businesses to identify trends, measure marketing campaign success, and optimize user experience by analyzing traffic sources and visitor behavior. Utilizing this report helps improve decision-making and increase overall website performance through data-driven insights.
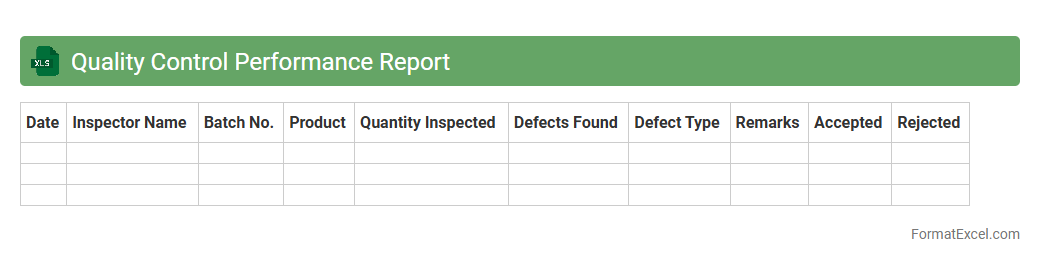
Quality Control Performance Report
A
Quality Control Performance Report Excel document systematically tracks and analyzes quality metrics, defects, and process improvements within a project or production environment. It provides a clear visual representation of key performance indicators (KPIs), enabling teams to identify trends, monitor compliance with standards, and implement corrective actions effectively. This tool enhances decision-making by offering real-time, data-driven insights into quality control processes, ensuring continuous improvement and customer satisfaction.
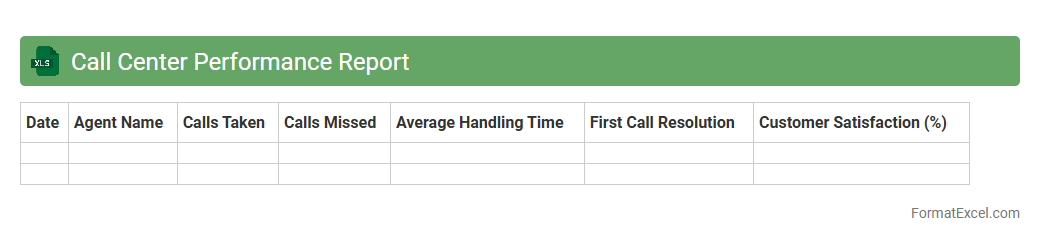
Call Center Performance Report
The
Call Center Performance Report Excel document is a comprehensive tool that tracks key metrics such as call volume, average handle time, and customer satisfaction scores. It enables managers to analyze agent productivity and identify areas for improvement by visualizing data trends and performance insights. Utilizing this report helps optimize operational efficiency and enhances overall customer service quality.
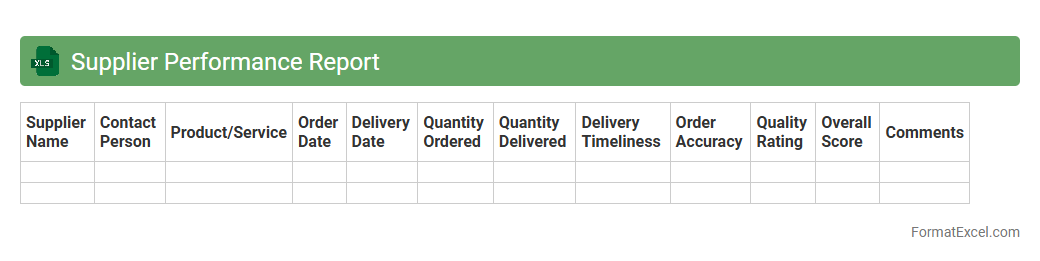
Supplier Performance Report
The
Supplier Performance Report Excel document tracks key metrics such as delivery time, quality of goods, and compliance rates to evaluate supplier reliability and efficiency. It enables businesses to identify top-performing suppliers and address issues with underperforming vendors, enhancing supply chain management. By analyzing this report, companies can make data-driven decisions that improve procurement strategies and optimize overall vendor relationships.
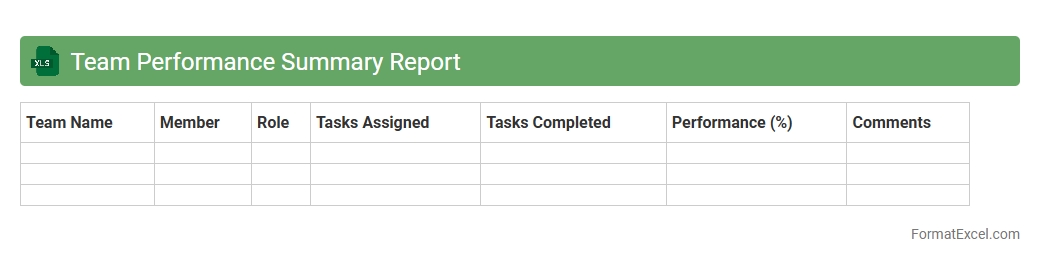
Team Performance Summary Report
The
Team Performance Summary Report Excel document consolidates key metrics such as productivity, task completion rates, and individual contributions into a clear, easy-to-read format. It allows managers to quickly assess overall team efficiency, identify strengths, and pinpoint areas requiring improvement. This report supports data-driven decision-making by providing a comprehensive overview of team dynamics and progress toward goals.
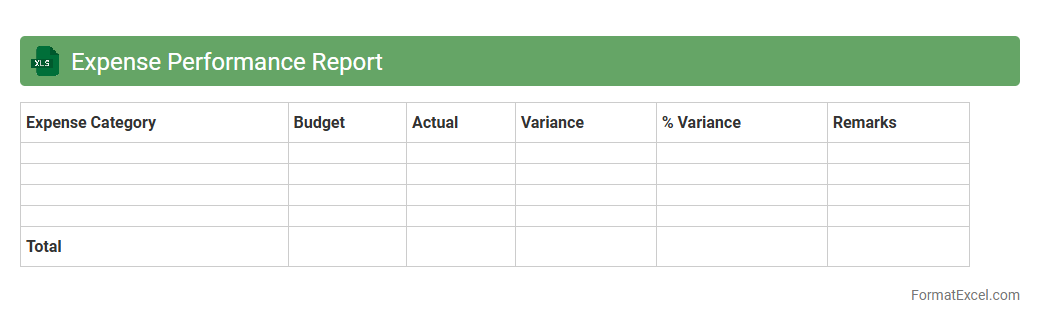
Expense Performance Report
The
Expense Performance Report Excel document is a detailed financial tool that tracks and analyzes spending patterns across various departments or projects within an organization. It consolidates expense data, enabling users to monitor budget adherence, identify cost-saving opportunities, and generate actionable insights for financial planning. By providing a clear overview of expenditures, this report enhances decision-making efficiency and supports effective resource allocation.
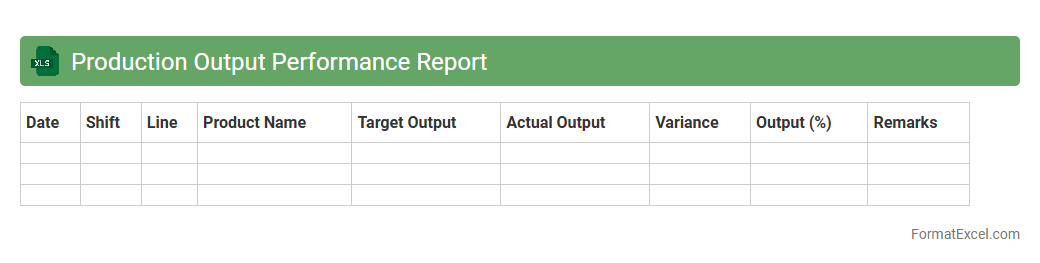
Production Output Performance Report
The
Production Output Performance Report Excel document tracks manufacturing efficiency by recording daily output, downtime, and defect rates, enabling precise performance analysis. It helps managers identify bottlenecks, monitor productivity trends, and make data-driven decisions to enhance operational efficiency. This report supports continuous improvement initiatives by providing clear visibility into production metrics.
KPI Performance Tracking Report
A
KPI Performance Tracking Report Excel document is a powerful tool designed to monitor and evaluate critical performance indicators over time, allowing businesses to measure progress against defined goals. By visually organizing data through charts, tables, and conditional formatting, it helps identify trends, pinpoint areas for improvement, and support informed decision-making. This report streamlines performance analysis, enabling teams to enhance productivity and align strategies with organizational objectives efficiently.
Service Delivery Performance Report
The
Service Delivery Performance Report Excel document is a comprehensive tool that tracks and analyzes the efficiency and effectiveness of service delivery processes. It consolidates key performance indicators (KPIs), such as response time, resolution rate, and customer satisfaction, enabling organizations to identify trends and areas for improvement. Utilizing this report improves decision-making, enhances accountability, and optimizes resource allocation to ensure superior service quality.
Customer Satisfaction Performance Report
The
Customer Satisfaction Performance Report Excel document is a comprehensive tool designed to track and analyze customer feedback and satisfaction metrics over time. It consolidates data such as survey scores, response rates, and trend patterns, allowing businesses to identify strengths and areas for improvement in their services. Utilizing this report helps organizations make informed decisions to enhance customer experience, boost retention, and drive overall business growth.
Departmental Performance Report
The
Departmental Performance Report Excel document is a comprehensive tool that tracks and analyzes key performance indicators (KPIs) across various departments within an organization. It enables managers to monitor productivity, budget adherence, and project progress by consolidating data into easily interpretable charts and tables. This report supports data-driven decision-making and helps identify areas for improvement to optimize overall departmental efficiency.
Marketing Campaign Performance Report
A
Marketing Campaign Performance Report Excel document tracks key metrics such as conversion rates, click-through rates, and return on investment for various marketing efforts. It helps businesses analyze the effectiveness of individual campaigns, identify successful strategies, and optimize budget allocation. By providing clear visualizations and organized data, this report supports data-driven decision-making to maximize marketing ROI.
Operational Efficiency Report
The
Operational Efficiency Report Excel document provides a detailed analysis of business processes, highlighting key performance indicators such as productivity rates, cost management, and resource utilization. It enables organizations to identify bottlenecks, streamline workflows, and optimize overall operational performance. By offering actionable insights through data visualization and trend tracking, this report supports informed decision-making and continuous improvement initiatives.
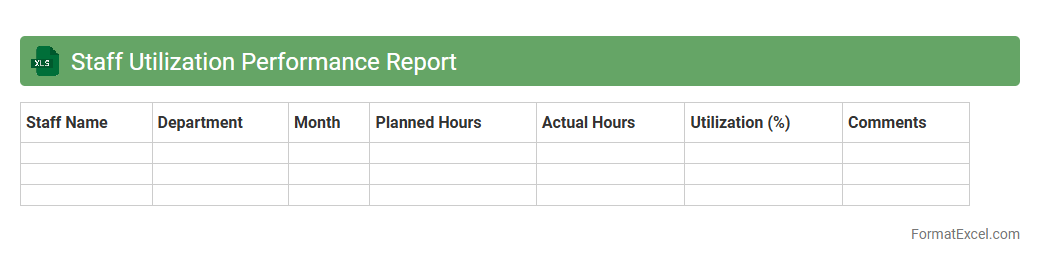
Staff Utilization Performance Report
The
Staff Utilization Performance Report Excel document tracks employee productivity by analyzing hours worked against available hours, helping organizations maximize workforce efficiency. It provides detailed insights into resource allocation, identifying underutilized staff and enabling data-driven decisions to balance workloads. This report supports informed workforce planning, ultimately enhancing operational performance and cost management.
Complaint Resolution Performance Report
The
Complaint Resolution Performance Report Excel document tracks and analyzes customer complaints, providing detailed insights into resolution times, complaint categories, and response effectiveness. This tool helps organizations identify trends, measure team performance, and implement improvements to enhance customer satisfaction. By maintaining accurate data, businesses can streamline complaint management, reduce response delays, and improve overall service quality.
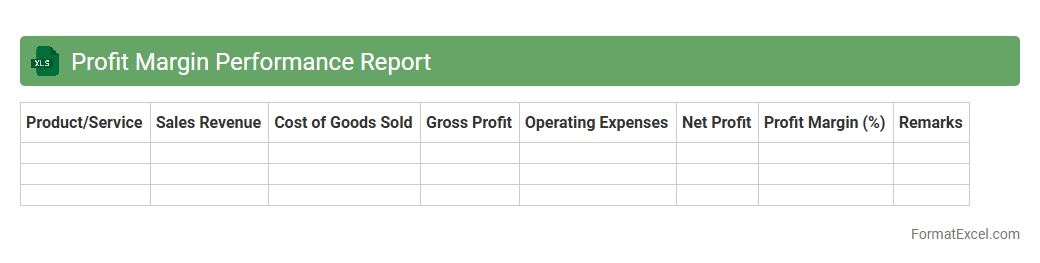
Profit Margin Performance Report
The
Profit Margin Performance Report Excel document analyzes a company's profitability by comparing revenues to costs across different products, services, or time periods. It helps identify which segments yield the highest profit margins, enabling informed decision-making to enhance financial performance. By tracking profit margins consistently, businesses can optimize pricing strategies, reduce expenses, and drive sustainable growth.
Introduction to Performance Report Formats
A performance report format provides a structured way to display key metrics and insights clearly and concisely. It helps organizations track progress and make data-driven decisions. Proper formatting ensures data is easy to interpret for all stakeholders.
Benefits of Using Excel for Performance Reporting
Excel offers unmatched flexibility and powerful features for creating dynamic and customizable performance reports. It supports advanced functions, charts, and pivot tables that enhance data analysis. Additionally, Excel is widely accessible and easy to share across teams.
Key Components of a Performance Report in Excel
A comprehensive performance report typically includes a title, date range, key performance indicators (KPIs), and a summary section. Data tables and visualizations help highlight trends and outcomes. Accurate labeling and clear segmentation improve report readability.
Essential Data to Include in Reports
Include quantitative metrics like sales figures, revenue, or efficiency ratios alongside qualitative insights. Tracking historical data allows comparisons and trend analysis, making your report more informative. Key performance data should be relevant to organizational goals.
Step-by-Step Guide to Creating a Performance Report Template
Begin by outlining your report objectives and selecting the KPIs to track. Set up data input tables, create formulas, and design the layout for readability. Save your work as a template to reuse and maintain consistency in future reports.
Recommended Excel Functions and Tools for Reporting
Use functions like SUMIFS, VLOOKUP, and IF statements to automate calculations and data retrieval. PivotTables organize large datasets efficiently, while Conditional Formatting highlights critical values. Leveraging Excel tools enhances report accuracy and speed.
Formatting Tips for Clear and Impactful Reports
Apply consistent font styles, sizes, and color themes to maintain a professional look. Use borders and shading to separate sections visually. Clear and concise labeling guides readers through the data seamlessly.
Visualizing Performance Data with Excel Charts
Charts such as bar graphs, line charts, and pie charts help translate raw numbers into actionable insights. They make patterns and outliers more apparent to stakeholders. Select chart types that best represent your performance metrics for clarity.
Automating Performance Reports in Excel
Automation reduces manual data entry and updates by linking data sources and using macros or Power Query. This approach saves time and minimizes errors while ensuring up-to-date reporting. Automated workflows streamline your report generation process.
Best Practices for Sharing and Updating Reports
Distribute reports in universally accessible formats like XLSX or PDF. Keep version control to track changes and maintain report integrity. Regular updates ensure the data remains current, supporting informed decision-making with accurate reports.