Inventory Valuation Summary
An
Inventory Valuation Summary Excel document consolidates critical data on stock quantities, purchase costs, and market values to provide a clear financial overview of inventory assets. This tool aids businesses in accurately assessing inventory worth, facilitating effective cost control, and enhancing decision-making for procurement and sales strategies. By offering real-time updates and comprehensive summaries, it supports improved cash flow management and ensures compliance with accounting standards.
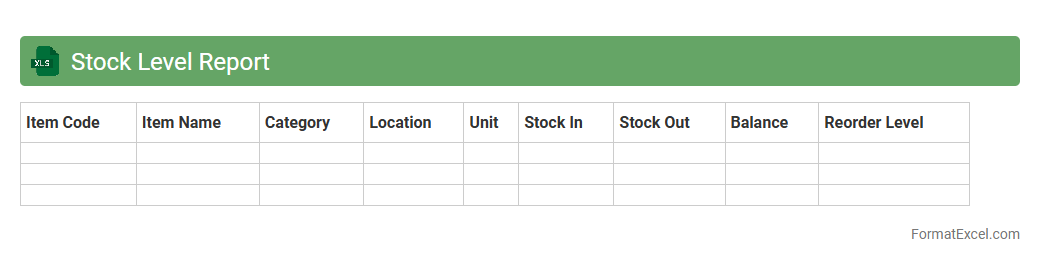
Stock Level Report
A
Stock Level Report Excel document tracks inventory quantities, showing real-time data on product availability and stock movements. It helps businesses maintain optimal inventory, avoid stockouts or overstock situations, and improve supply chain efficiency. Access to accurate stock level information supports informed decision-making in purchasing and sales strategies.
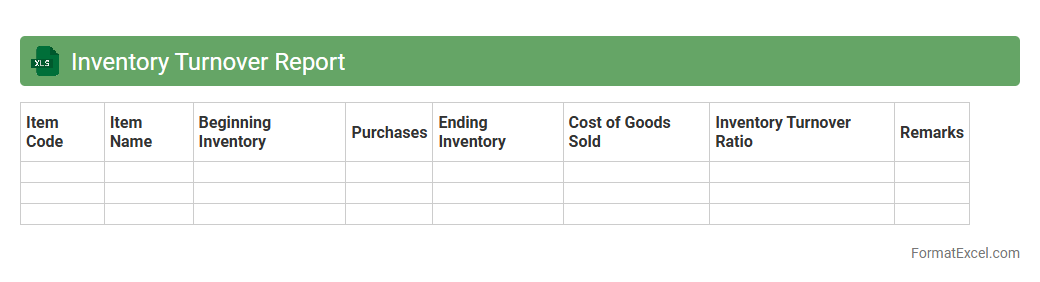
Inventory Turnover Report
An
Inventory Turnover Report in Excel is a detailed document that tracks the rate at which inventory is sold and replaced over a specific period. It helps businesses analyze product performance, manage stock levels efficiently, and reduce holding costs by identifying slow-moving items. This report supports informed decision-making in inventory purchasing and sales strategies, enhancing overall operational efficiency.
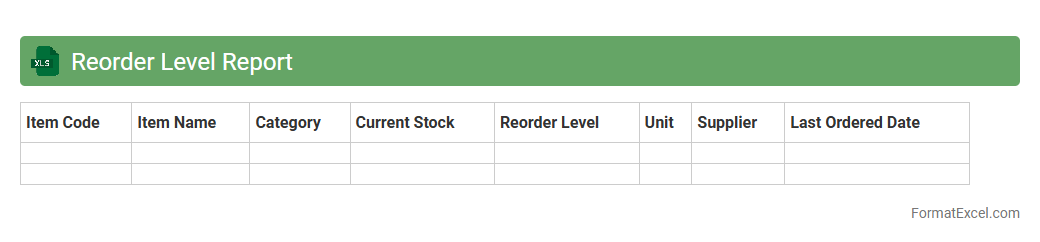
Reorder Level Report
The
Reorder Level Report Excel document tracks inventory thresholds to signal when stock needs replenishment, preventing stockouts and overstocking. It consolidates item quantities, reorder points, and lead times, enabling efficient inventory management and timely purchasing decisions. This report enhances operational efficiency by maintaining optimal inventory levels and reducing supply chain disruptions.
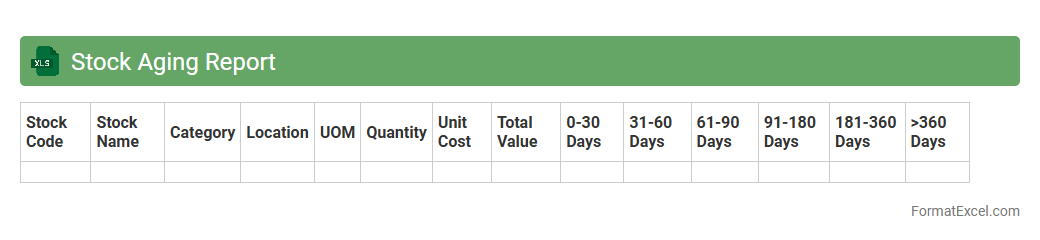
Stock Aging Report
A
Stock Aging Report Excel document categorizes inventory based on the length of time items have been held in stock, helping businesses track and manage older stock effectively. It identifies slow-moving or obsolete inventory, enabling better decision-making for purchasing, sales, and stock clearance strategies. This report optimizes inventory turnover, reduces holding costs, and improves overall warehouse efficiency.
Stock Movement Report
A
Stock Movement Report Excel document tracks the inflow and outflow of inventory items over a specific period, providing detailed records of quantities received, issued, and currently available. This report helps businesses maintain accurate stock levels, identify trends in product demand, and prevent overstocking or stockouts. By analyzing stock movement data, companies can optimize inventory management, enhance supply chain efficiency, and make informed purchasing decisions.
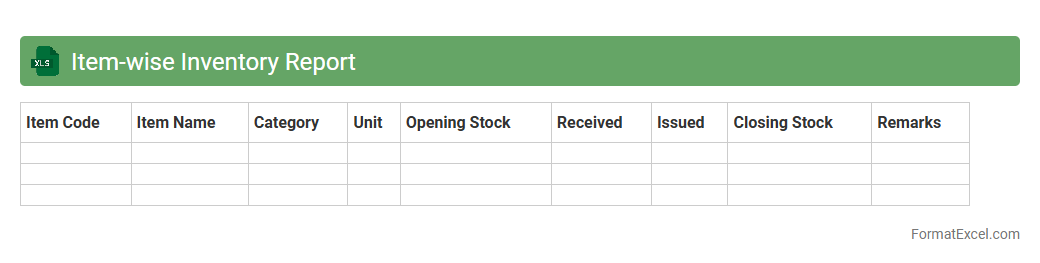
Item-wise Inventory Report
An
Item-wise Inventory Report Excel document is a detailed record that tracks individual product quantities, movements, and stock status over a specific period. It helps businesses monitor inventory levels accurately, identify fast-moving or slow-moving items, and optimize reorder points to prevent stockouts or overstock situations. Utilizing this report enhances inventory management efficiency, reduces carrying costs, and supports informed decision-making in procurement and sales strategies.
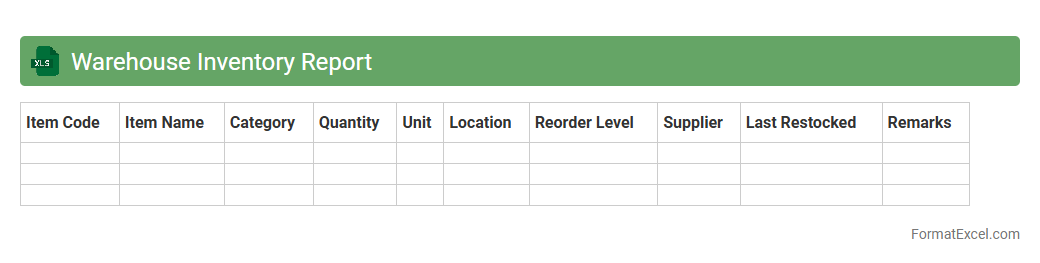
Warehouse Inventory Report
A
Warehouse Inventory Report Excel document is a detailed spreadsheet used to track stock levels, item locations, and movement within a warehouse. It enables efficient inventory management by providing real-time data that helps reduce stockouts, prevent overstocking, and streamline order fulfillment. This report is essential for maintaining accurate records, optimizing storage space, and improving overall warehouse productivity.
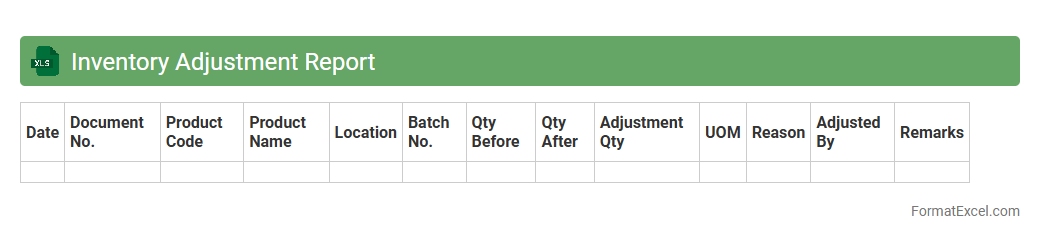
Inventory Adjustment Report
An
Inventory Adjustment Report Excel document tracks changes in stock levels by recording discrepancies between actual and recorded inventory quantities. It helps businesses identify errors, theft, or damaged goods, ensuring accurate inventory records. This report supports better decision-making in inventory management and financial reconciliation.
Slow Moving Items Report
The
Slow Moving Items Report Excel document identifies inventory products that have low sales velocity over a specified period, helping businesses to monitor and manage stock efficiently. This report highlights items that tie up capital and storage space, enabling companies to make informed decisions about discounts, promotions, or discontinuation. By analyzing slow-moving inventory, organizations can improve cash flow, reduce holding costs, and optimize inventory turnover rates.
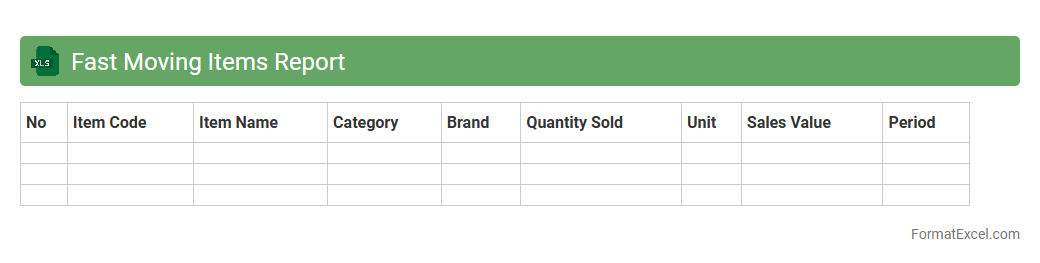
Fast Moving Items Report
The
Fast Moving Items Report Excel document tracks products with high sales velocity, helping businesses identify which items are in highest demand. This report enables efficient inventory management by highlighting popular products, reducing stockouts and overstock situations. Using this data-driven insight supports better purchasing decisions and optimizes overall supply chain performance.
Batch-wise Inventory Report
A
Batch-wise Inventory Report Excel document organizes stock data by specific production batches, enabling precise tracking of quantity, expiry dates, and batch numbers. It helps businesses maintain accurate inventory control, reduce waste due to expired products, and streamline the replenishment process. This detailed batch-level insight supports better decision-making for manufacturing, quality control, and sales forecasting.
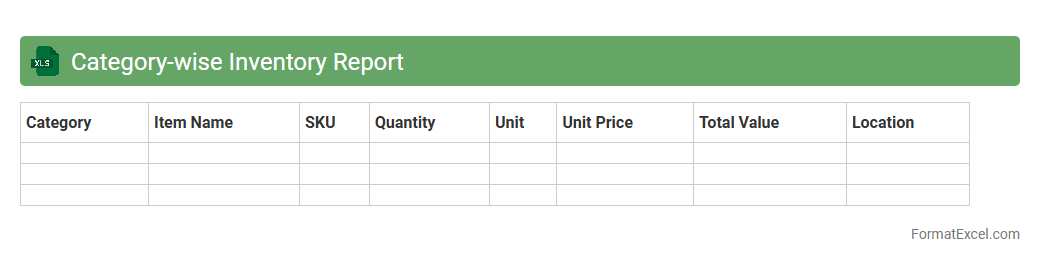
Category-wise Inventory Report
A
Category-wise Inventory Report Excel document organizes stock data by product categories, allowing businesses to analyze inventory levels efficiently. It helps identify trends, manage stock replenishment, and optimize storage by providing clear insights into category-specific quantities and values. This report supports informed decision-making and enhances overall inventory control for improved operational efficiency.
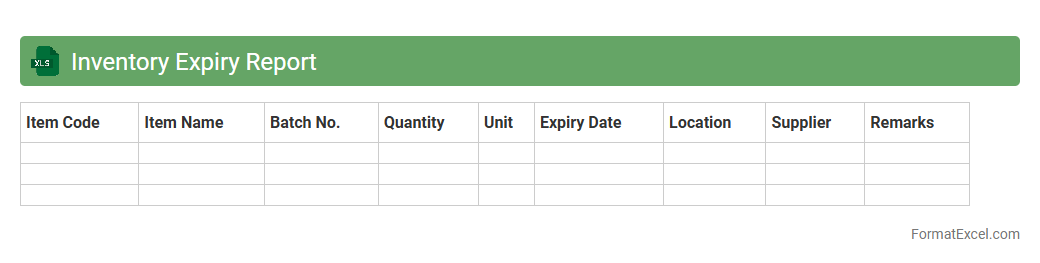
Inventory Expiry Report
An
Inventory Expiry Report Excel document tracks the expiration dates of products in stock, helping businesses manage perishable goods efficiently. It enables timely identification of items nearing their expiry, reducing waste and financial loss. Using this report, companies can optimize inventory turnover and ensure product quality for customers.
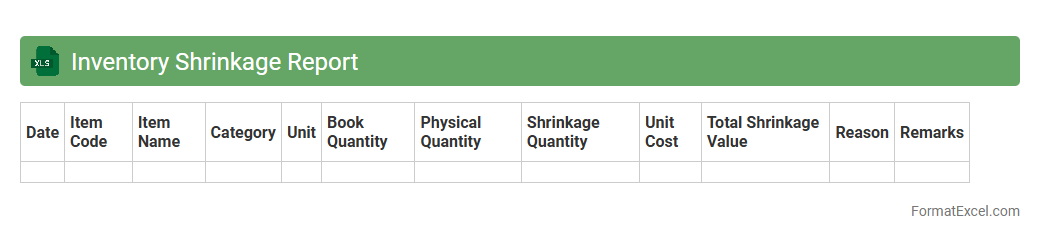
Inventory Shrinkage Report
An
Inventory Shrinkage Report in Excel tracks the difference between recorded inventory levels and actual physical stock, highlighting lost, stolen, or damaged goods. This document helps businesses identify discrepancies, reduce financial losses, and improve inventory management accuracy. By analyzing shrinkage trends, companies can implement targeted strategies to enhance operational efficiency and safeguard assets.
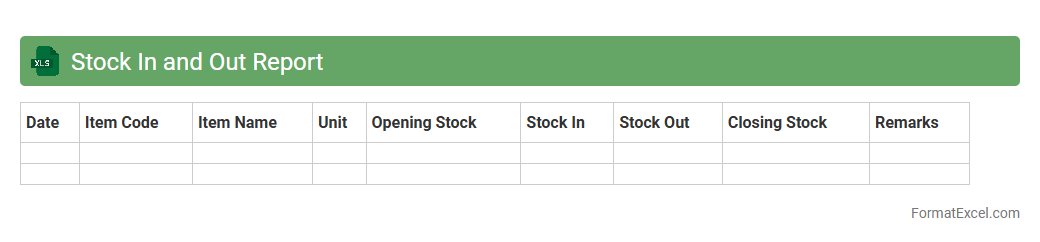
Stock In and Out Report
A
Stock In and Out Report Excel document tracks inventory movement by recording all items received and dispatched over a specific period. This report helps businesses maintain accurate stock levels, identify trends in inventory usage, and prevent stockouts or overstock situations. By providing real-time data, it supports efficient supply chain management and informed decision-making.
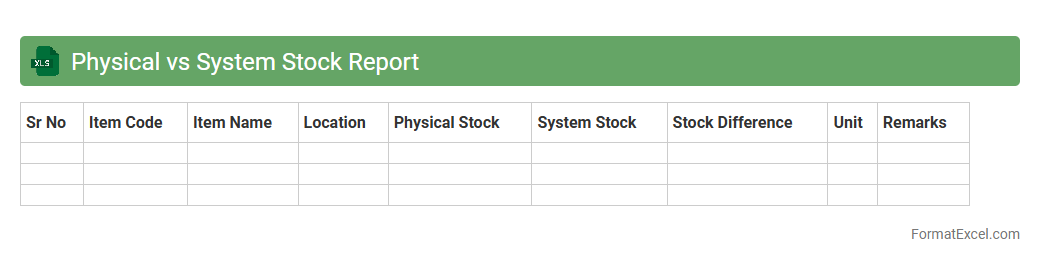
Physical vs System Stock Report
The
Physical vs System Stock Report Excel document compares actual inventory counted on-site with the quantities recorded in the inventory management system. This report helps identify discrepancies caused by errors, theft, or mismanagement, enabling businesses to maintain accurate stock levels. Utilizing this data ensures improved inventory control, reduces stockouts or overstock situations, and supports more informed purchasing and operational decisions.
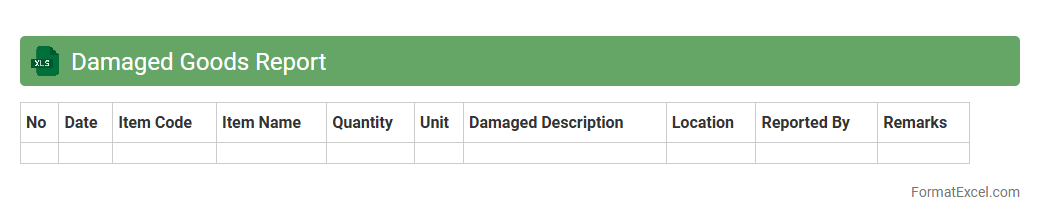
Damaged Goods Report
A
Damaged Goods Report Excel document is a structured spreadsheet used to record and track items that have been received or found to be defective, broken, or unsellable. It helps businesses identify patterns of damage, assess loss, and streamline return or disposal processes. This report enhances inventory management accuracy, supports quality control efforts, and aids in reducing financial losses by providing clear data for decision-making.
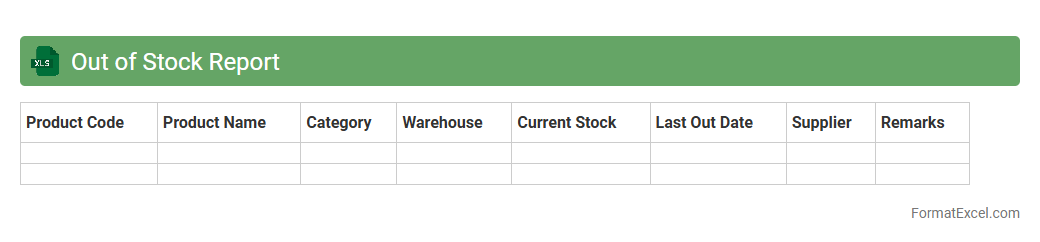
Out of Stock Report
The
Out of Stock Report Excel document is a detailed inventory management tool that tracks products currently unavailable in stock. It helps businesses quickly identify items that need restocking, preventing loss of sales and improving supply chain efficiency. By analyzing this report regularly, companies can optimize inventory levels, reduce holding costs, and enhance customer satisfaction.
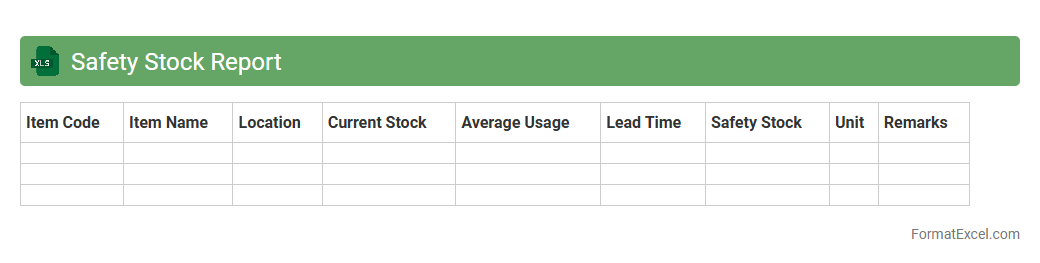
Safety Stock Report
The
Safety Stock Report Excel document is a critical inventory management tool that calculates optimal buffer stock levels to prevent stockouts during demand fluctuations or supply delays. It provides real-time insights into inventory status by analyzing historical sales data, lead times, and variability, enabling businesses to maintain sufficient stock without overstocking. Using this report helps improve service levels, reduce carrying costs, and enhance overall supply chain efficiency.
Pending Delivery Report
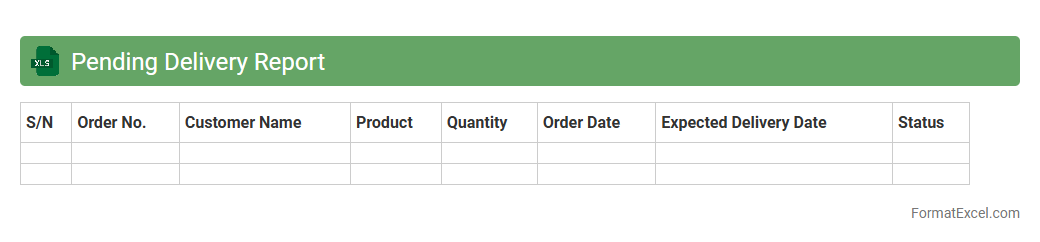
The
Pending Delivery Report Excel document is a detailed spreadsheet that tracks all undelivered orders or shipments within a business process, providing real-time visibility into pending tasks. It organizes data such as order numbers, customer details, product descriptions, expected delivery dates, and delivery status, enabling efficient monitoring and management. This report is essential for identifying bottlenecks, improving supply chain transparency, and ensuring timely follow-ups to enhance customer satisfaction.
Purchase vs Consumption Report
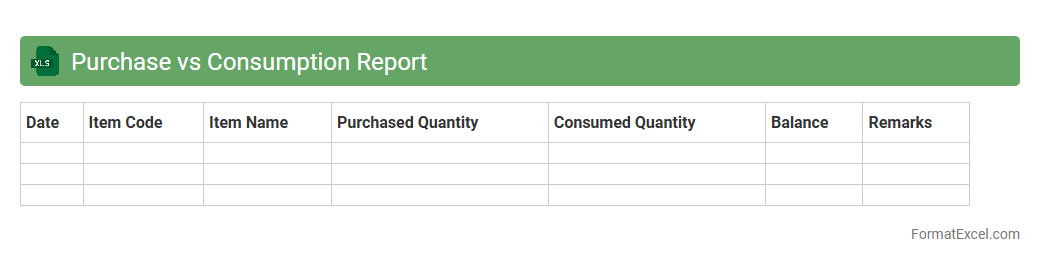
The
Purchase vs Consumption Report Excel document tracks the quantity of goods purchased against the quantity consumed over a specific period, enabling businesses to analyze discrepancies and optimize inventory management. By comparing these metrics, companies can identify inefficiencies, reduce wastage, and improve procurement planning. This report is essential for maintaining accurate stock levels, controlling costs, and supporting data-driven decision-making in supply chain operations.
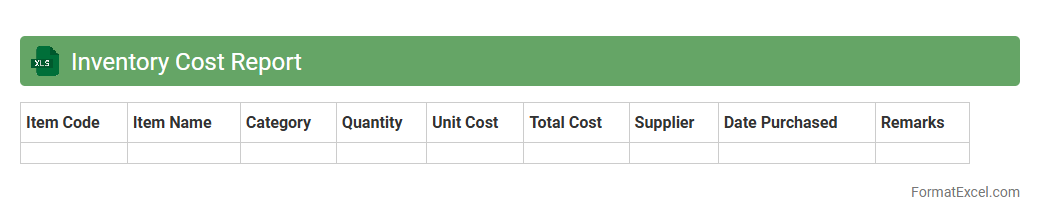
Inventory Cost Report
The Inventory Cost Report Excel document is a powerful tool for tracking and managing the
costs associated with inventory, including purchase prices, storage fees, and carrying expenses. It provides detailed insights into stock valuation, helping businesses optimize ordering, reduce excess inventory, and improve cash flow management. Utilizing this report enhances decision-making processes by offering accurate cost data to evaluate profitability and control operational expenses effectively.
Stock Transfer Report
A
Stock Transfer Report Excel document tracks the movement of inventory items between different locations or warehouses within an organization. It provides detailed information on quantities, item codes, transfer dates, and source and destination points, enabling accurate inventory management and audit trails. This report is essential for optimizing stock levels, reducing discrepancies, and enhancing supply chain efficiency.
Inventory Audit Trail
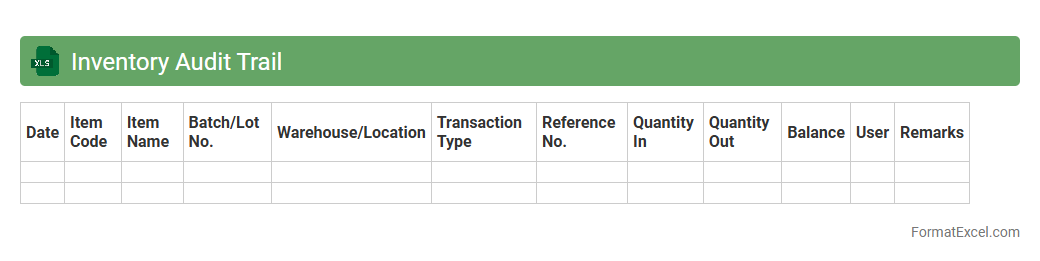
An
Inventory Audit Trail Excel document is a detailed record-keeping tool that tracks all changes made to inventory items, including additions, removals, and adjustments. It provides transparency by logging user actions, timestamps, and specific inventory details, enabling businesses to quickly identify discrepancies and maintain accurate stock levels. This document is essential for improving accountability, streamlining inventory management, and supporting financial audits.
Introduction to Inventory Report Format in Excel
An Inventory Report in Excel provides a systematic way to track product quantities, statuses, and locations. It helps businesses maintain accurate stock levels and manage resources efficiently. Excel's versatility allows customization to suit different inventory management needs.
Key Components of an Inventory Report
The primary components include item description, SKU, quantity, location, and reorder level. These data points help monitor inventory status and identify when restocking is necessary. Properly structured components ensure clarity and actionable insights.
Benefits of Using Excel for Inventory Management
Excel offers flexibility, ease of use, and powerful calculation capabilities for inventory management. It enables real-time updates and custom reporting without requiring specialized software. This results in cost-effective and scalable inventory control.
Essential Columns for an Inventory Report
Essential columns typically include Item ID, Description, Quantity, Unit Price, Total Value, and Restock Threshold. These columns allow quick assessment of stock health and financial impact. Accurate data entry in these columns is critical for reliable reporting.
Step-by-Step Guide to Creating an Inventory Report in Excel
Start by setting up columns for critical inventory data, enter item details, and apply formatting for readability. Use Excel formulas to calculate totals and highlight low stock levels automatically. Saving templates enhances efficiency for future reports.
Customizing Inventory Templates in Excel
Customizing templates allows adjustment of fields and layout to fit specific business needs. Adding conditional formatting and dropdown menus improves usability and reduces errors. Tailored templates streamline data entry and analysis.
Formulas and Functions for Inventory Tracking
Key Excel functions like SUM, IF, VLOOKUP, and COUNTIF automate calculations and data retrieval. These formulas assist in tracking stock levels, sales, and reorder points efficiently. Mastery of these functions enhances inventory accuracy.
Tips for Automating Inventory Reports in Excel
Automation can be achieved through Excel macros, dynamic tables, and linked data sources. Setting automatic alerts for low stock improves responsiveness. Leveraging automation reduces manual effort and minimizes human errors.
Common Mistakes to Avoid in Inventory Reports
Avoid errors such as inconsistent data entry, lack of updates, and missing critical columns. Overlooking data validation and error checking can lead to inaccurate reporting. Regular audits ensure data integrity and report reliability.
Downloadable Inventory Report Templates for Excel
Pre-built Excel templates provide a ready-to-use framework for organizing inventory data effectively. These templates often include built-in formulas and formatting features to save time. Utilizing them can jumpstart efficient inventory management.