Statement of Comprehensive Income
A
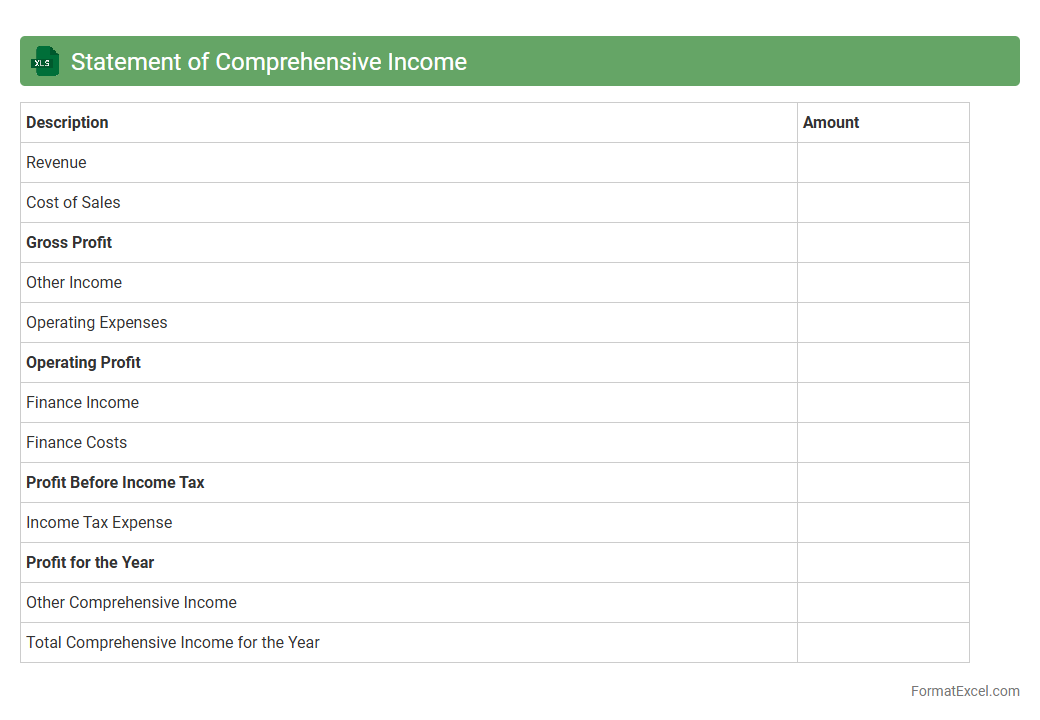
Statement of Comprehensive Income Excel document is a financial tool that summarizes a company's total income, including net profit and other comprehensive income items, over a specific period. It helps stakeholders evaluate overall financial performance beyond net profit by capturing gains and losses from foreign currency translation, unrealized investments, and pension liabilities. This document enables precise financial analysis, aiding decision-making for investors, management, and auditors by providing a comprehensive view of changes in equity.
Revenue
A
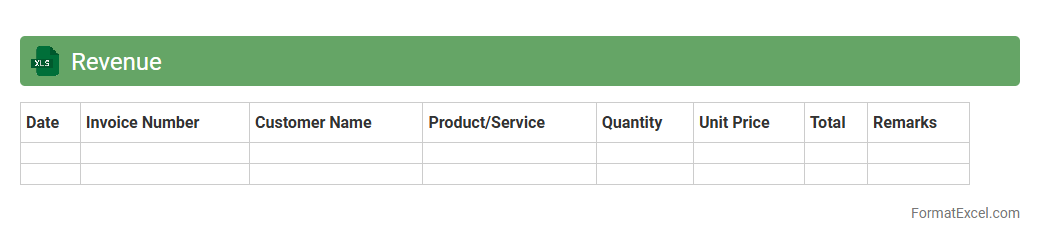
Revenue Excel document is a structured spreadsheet designed to track, analyze, and manage income generated by a business or project over a specific period. It organizes financial data such as sales figures, revenue streams, and payment records, enabling users to monitor performance and identify trends. This document is essential for budgeting, forecasting, and making informed decisions to maximize profitability and ensure financial stability.
Cost of Sales
A
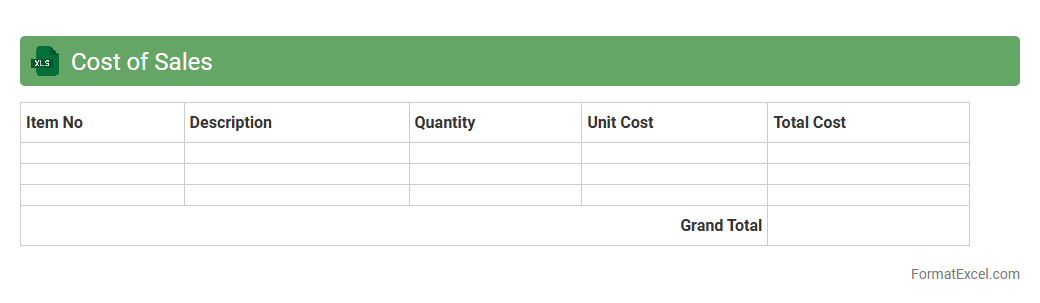
Cost of Sales Excel document is a financial tool used to track and calculate the direct expenses associated with producing goods or services sold by a business. It helps companies accurately determine gross profit by itemizing costs like raw materials, labor, and manufacturing overhead. Utilizing this document enhances budget management, improves pricing strategies, and supports informed decision-making for operational efficiency.
Gross Profit
A
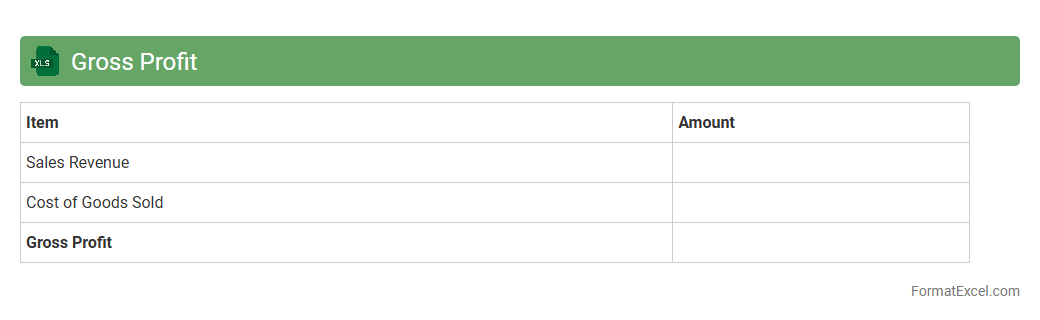
Gross Profit Excel document is a spreadsheet designed to calculate and analyze the difference between total revenue and the cost of goods sold (COGS), providing a clear view of a business's profitability. This tool helps organizations track financial performance, manage costs, and make informed decisions to enhance profitability. By organizing financial data systematically, it simplifies complex calculations and supports strategic planning for sustained business growth.
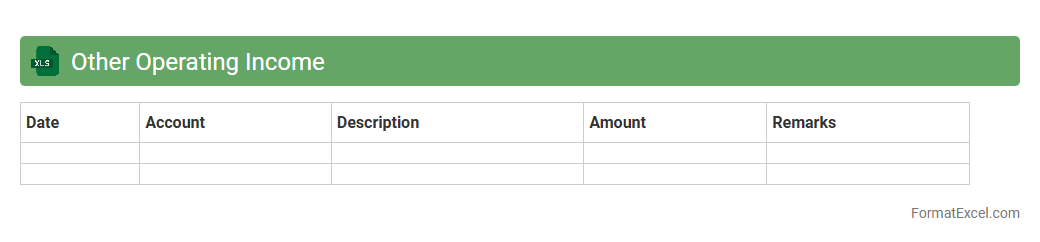
Other Operating Income
An
Other Operating Income Excel document tracks non-primary revenue sources such as rental income, royalties, and service fees, providing a clear overview of additional earnings beyond core business activities. This file helps in analyzing diverse income streams, facilitating accurate financial reporting and strategic decision-making. It also supports budgeting and audit processes by organizing and summarizing other operating income data efficiently.
Distribution Costs
The
Distribution Costs Excel document systematically tracks expenses related to the delivery of goods, including transportation, warehousing, and logistics fees. It provides detailed insights into cost allocation, helping businesses identify areas for cost reduction and enhance supply chain efficiency. Utilizing this document enables informed budgeting decisions and improved financial forecasting in distribution management.
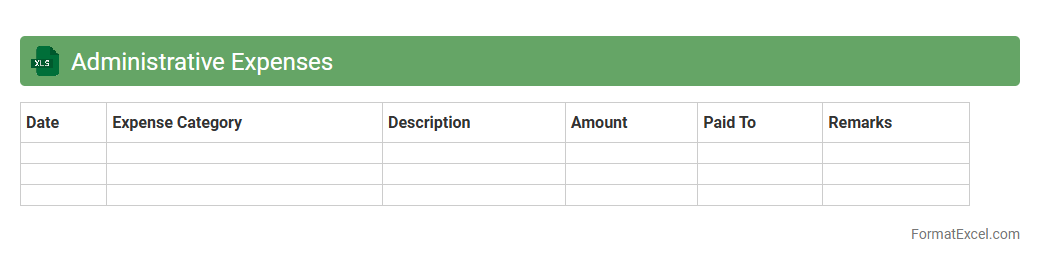
Administrative Expenses
An
Administrative Expenses Excel document is a spreadsheet designed to track and manage business overhead costs such as salaries, office supplies, and utilities. It helps organizations monitor spending, analyze budget variance, and identify potential cost-saving opportunities. By organizing expenses in a clear, structured format, it supports efficient financial planning and reporting.
Other Expenses
The
Other Expenses Excel document tracks miscellaneous costs that do not fall under primary budget categories, providing a clear overview of secondary expenditures. It helps organizations maintain accurate financial records by categorizing and monitoring diverse expense types, ensuring comprehensive budget management. This document enhances financial analysis and decision-making by highlighting spending patterns outside regular operational costs.
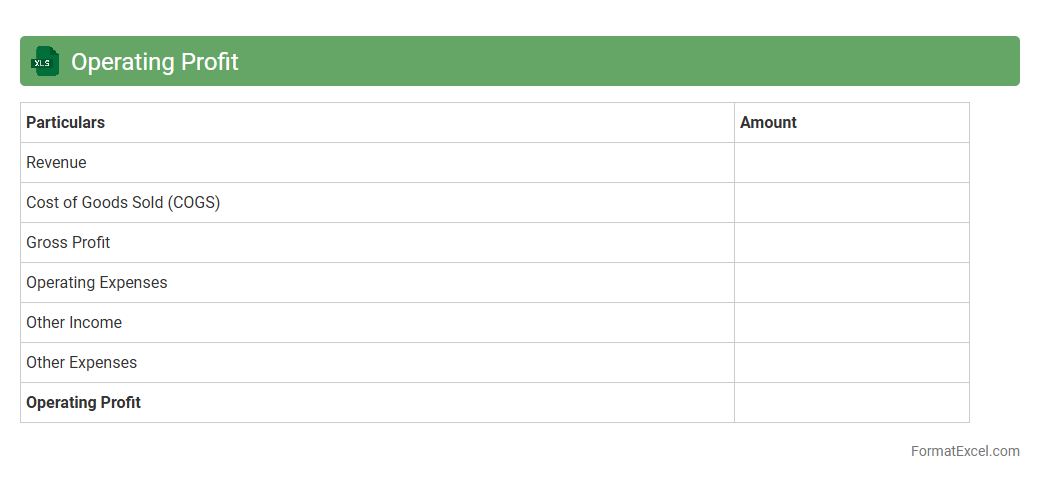
Operating Profit
An
Operating Profit Excel document is a financial tool that calculates a company's earnings from core business operations by subtracting operating expenses from gross profit. It provides clear insights into operational efficiency, helping businesses identify cost control areas and assess profitability without considering non-operational income or expenses. Using this document supports strategic decision-making, budgeting accuracy, and performance benchmarking across different periods or departments.
Finance Income
A
Finance Income Excel document is a spreadsheet that organizes and tracks various sources of income such as salaries, interest, dividends, and rental income. It helps users analyze cash flow, forecast financial growth, and manage budgeting efficiently by providing clear visuals and data summaries. This tool is essential for both personal finance management and business accounting to maintain accurate records and optimize financial decisions.
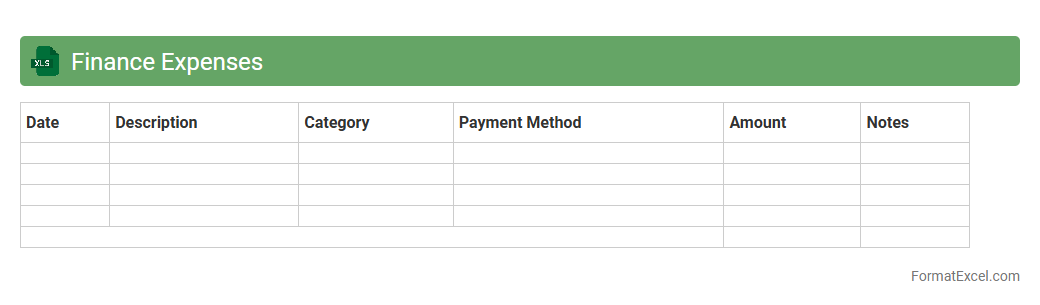
Finance Expenses
A
Finance Expenses Excel document is a structured spreadsheet designed to track, categorize, and analyze all financial outflows within a business or personal budget. It enables users to monitor spending patterns, manage cash flow efficiently, and generate reports for better financial decision-making. Utilizing this tool helps maintain accurate financial records, ensuring compliance and facilitating quicker expense reconciliation.
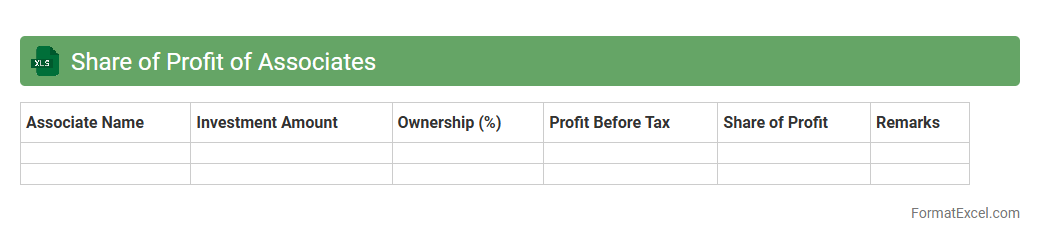
Share of Profit of Associates
The
Share of Profit of Associates Excel document tracks the proportionate earnings from investments in associate companies, reflecting the investor's equity share in their net profits or losses. This tool helps businesses accurately report their financial performance by consolidating associate profits, ensuring compliance with accounting standards like IFRS and GAAP. It is useful for financial analysis, forecasting future earnings, and making informed investment decisions based on associate company performance.
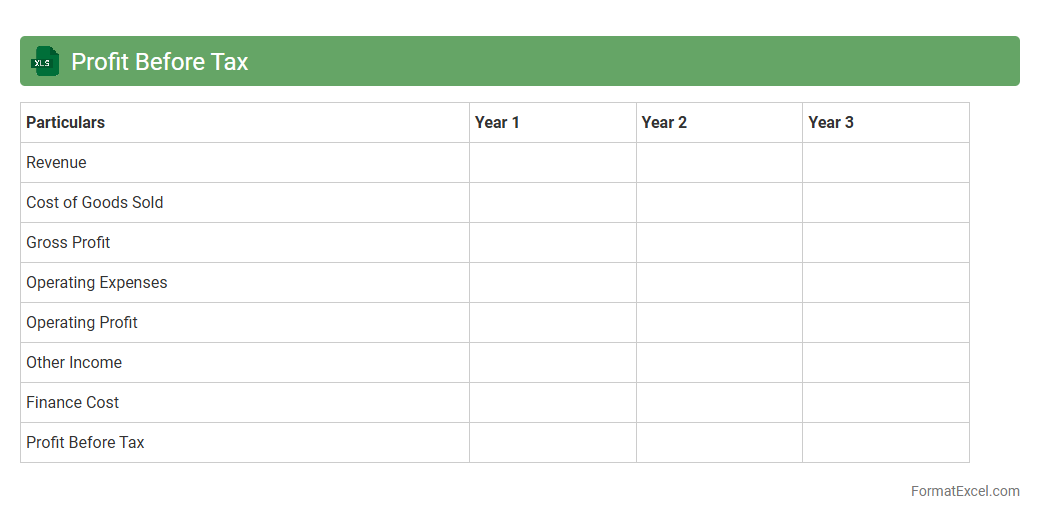
Profit Before Tax
A
Profit Before Tax Excel document calculates a company's earnings before income tax expenses are deducted, providing clear insight into operational profitability. This tool allows businesses to analyze revenue, costs, and other financial data efficiently, facilitating better financial planning and decision-making. Utilizing such a document helps identify trends in profitability and assess the impact of expenses, improving the accuracy of financial forecasts.
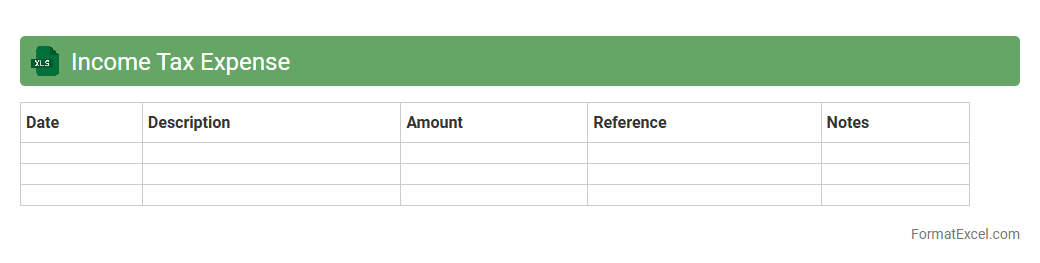
Income Tax Expense
An
Income Tax Expense Excel document is a financial tool designed to calculate and track a company's or individual's income tax liabilities accurately. It organizes income details, deductions, and tax rates into a structured format, allowing users to estimate tax expenses efficiently and ensure compliance with tax regulations. This document is useful for budgeting, financial planning, and preparing tax returns with precision.
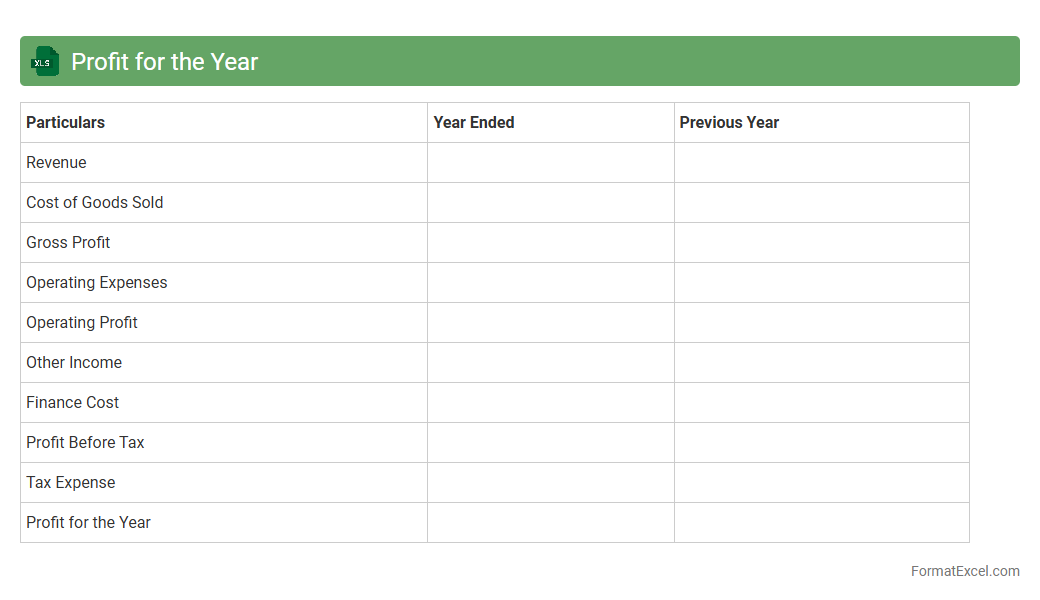
Profit for the Year
The
Profit for the Year Excel document is a financial statement summary that captures a company's net income after all expenses and taxes have been deducted from total revenue. It is useful for tracking business performance over a fiscal period, enabling stakeholders to assess profitability and inform strategic decisions. This document also aids in budgeting, forecasting, and identifying trends that impact financial health.
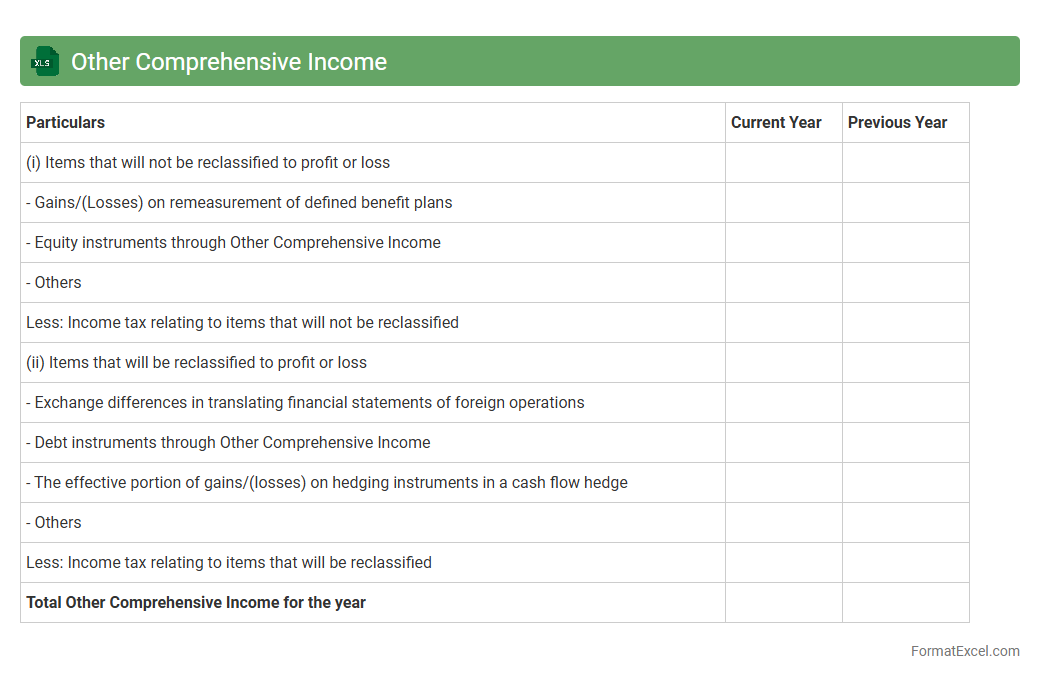
Other Comprehensive Income
An
Other Comprehensive Income Excel document tracks financial gains and losses not included in net income, such as foreign currency translation adjustments and unrealized gains on investments. It provides a clear view of comprehensive earnings, helping businesses and investors analyze overall financial health beyond standard profit metrics. This tool is essential for accurate financial reporting and strategic decision-making.
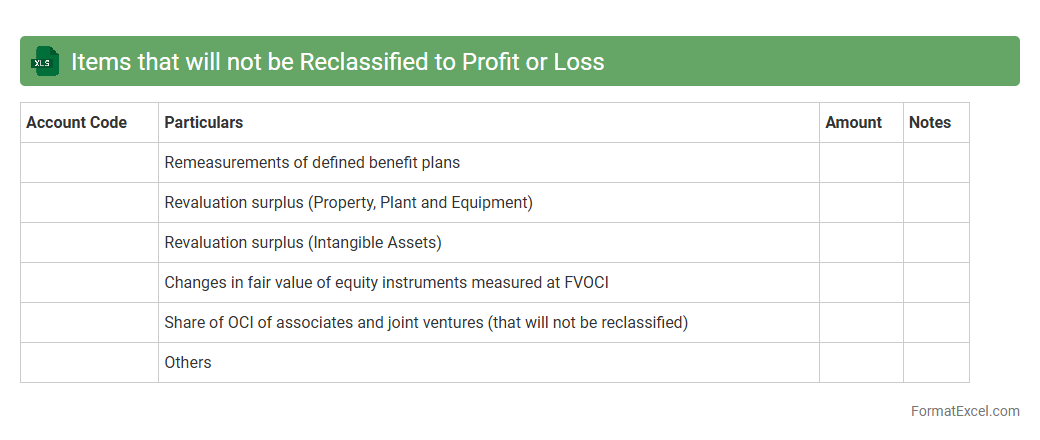
Items that will not be Reclassified to Profit or Loss
An
Items that will not be Reclassified to Profit or Loss Excel document categorizes financial elements such as revaluation surpluses or actuarial gains on defined benefit plans that remain in other comprehensive income and do not impact the profit or loss statement. This document aids in accurate financial reporting by distinguishing non-recyclable components, ensuring clarity in analyzing a company's comprehensive income. It is crucial for stakeholders to assess long-term equity changes without affecting the operating performance metrics.
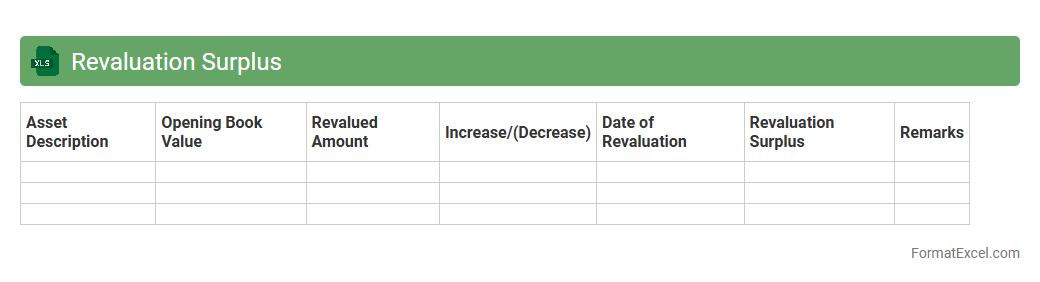
Revaluation Surplus
The
Revaluation Surplus Excel document is a financial tool designed to track and manage the increase in asset value after a revaluation process. It helps businesses accurately record the difference between the book value and the revalued amount of assets, ensuring compliance with accounting standards. This document is essential for maintaining transparent financial statements and aiding decision-making related to asset management and investment planning.
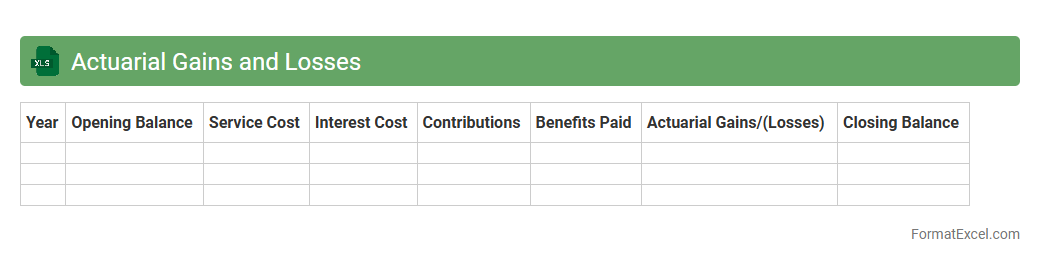
Actuarial Gains and Losses
The
Actuarial Gains and Losses Excel document tracks changes in pension liabilities and assets resulting from actuarial assumptions and experience adjustments over time. It is useful for financial professionals and companies to analyze the impact of demographic changes, interest rate fluctuations, and investment performance on pension plans. This tool enhances decision-making by providing a clear, organized view of pension plan performance and helping ensure accurate reporting and compliance.
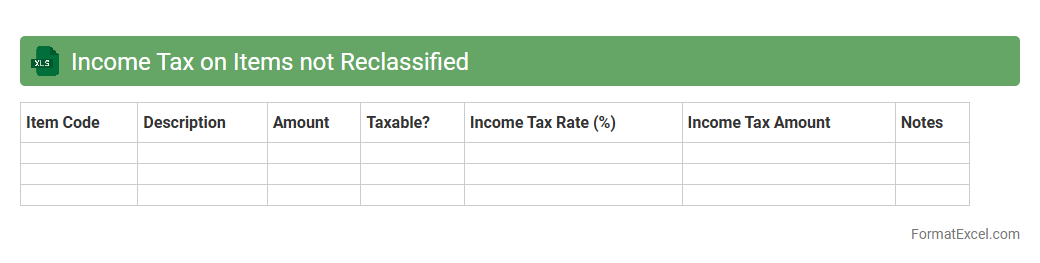
Income Tax on Items not Reclassified
The
Income Tax on Items not Reclassified Excel document tracks tax implications on income elements that remain in the current period's profit or loss without being transferred to other comprehensive income. This template helps ensure accurate financial reporting and compliance by clearly separating taxable income from non-reclassified components. It enhances decision-making and audit readiness by providing detailed, organized data on tax liabilities related to these specific income items.
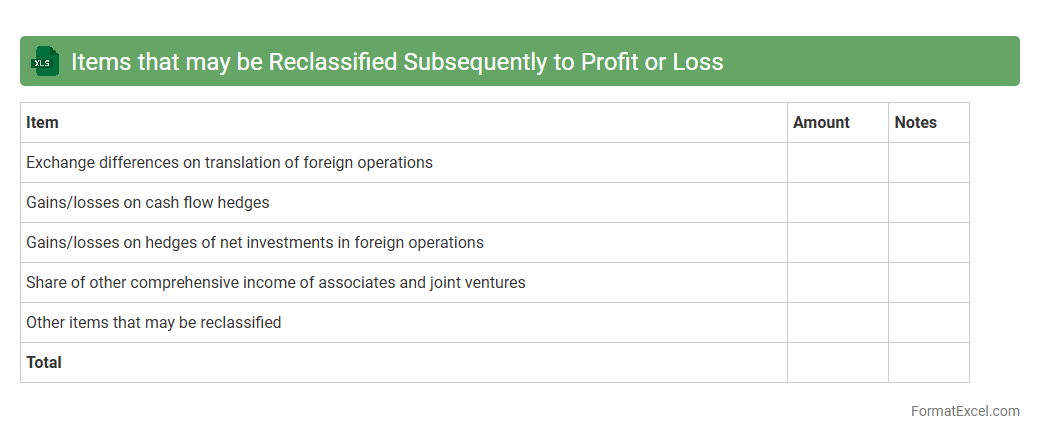
Items that may be Reclassified Subsequently to Profit or Loss
Items that may be reclassified subsequently to profit or loss refer to components of other comprehensive income that can later impact the income statement, such as foreign currency translation adjustments, cash flow hedges, and available-for-sale financial assets. An Excel document detailing these items helps track and analyze their effects on financial statements, ensuring accurate reporting and compliance with accounting standards like IFRS and GAAP. Using this document enhances transparency and supports better decision-making by providing a clear view of potential future income statement impacts.
Exchange Differences on Translation
Exchange Differences on Translation in an Excel document refer to the variations arising when financial statements or transactions are converted from one currency to another due to fluctuating foreign exchange rates. These differences are crucial in accurately reflecting the financial position and performance of multinational companies by adjusting for currency exposure. Tracking exchange differences helps in better financial analysis and decision-making by providing transparency on currency impact.
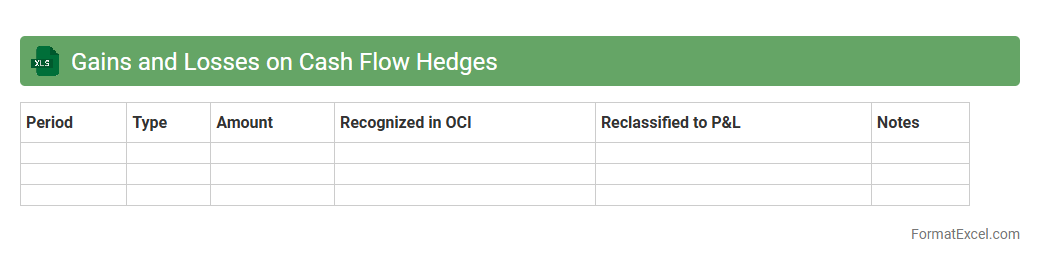
Gains and Losses on Cash Flow Hedges
A
Gains and Losses on Cash Flow Hedges Excel document tracks the financial impact of hedging activities designed to manage cash flow variability due to market fluctuations. It helps businesses monitor unrealized and realized gains or losses from derivative instruments affecting future cash flows, ensuring accurate financial reporting and risk assessment. This tool is essential for maintaining compliance with accounting standards like IFRS 9 and provides clear visibility into the effectiveness of hedging strategies.
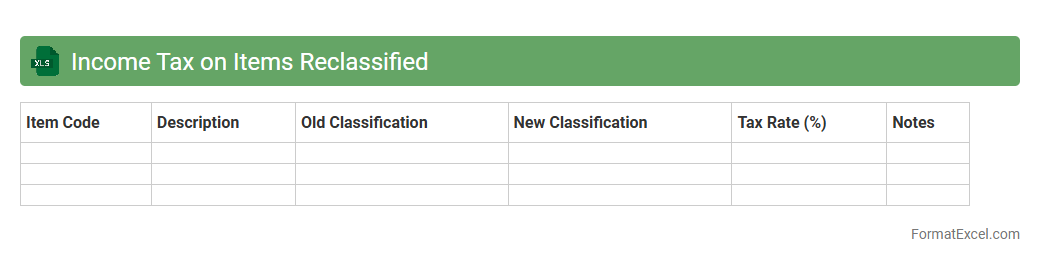
Income Tax on Items Reclassified
The
Income Tax on Items Reclassified Excel document is a specialized financial tool designed to track and analyze tax implications when accounting items are reclassified between different categories. It helps businesses and accountants accurately allocate income tax expenses based on changes in financial statement classifications, ensuring compliance with tax regulations. This document streamlines tax calculations, reduces errors during reclassification, and supports more precise financial reporting.
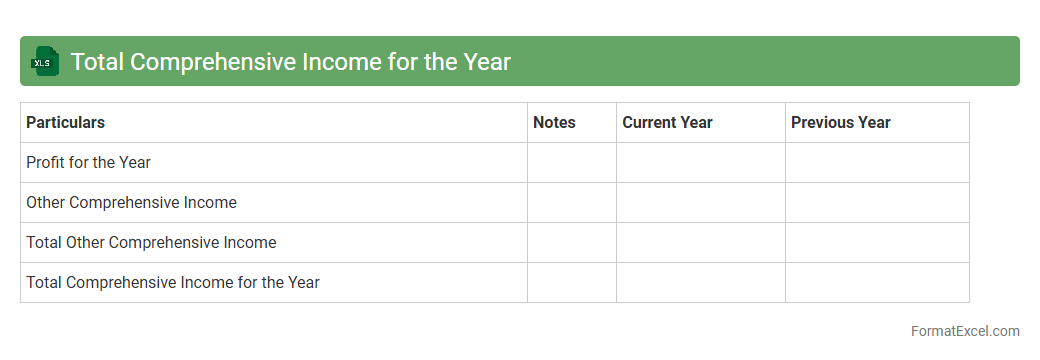
Total Comprehensive Income for the Year
Total Comprehensive Income for the Year in an Excel document captures all revenues, expenses, gains, and losses, including those not realized in net income, providing a complete picture of a company's financial performance. This document is crucial for stakeholders as it includes elements like foreign currency adjustments and unrealized gains or losses on investments, offering better insight into overall financial health. Using
Total Comprehensive Income data enables more accurate financial analysis and informed decision-making.
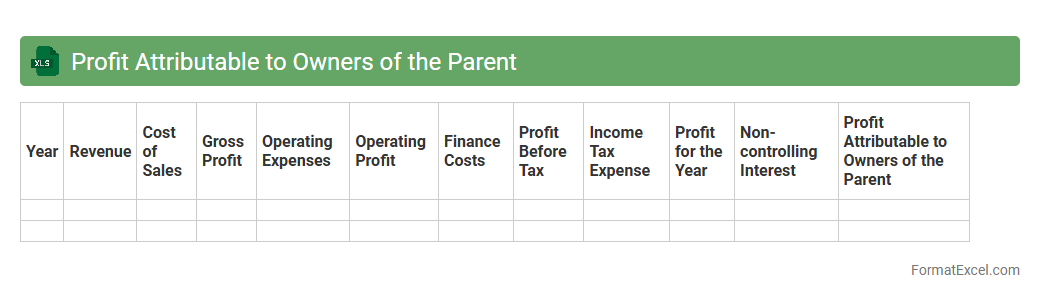
Profit Attributable to Owners of the Parent
The
Profit Attributable to Owners of the Parent excel document quantifies the net income directly assignable to shareholders, excluding minority interests across subsidiaries. This precise financial metric enables stakeholders to assess genuine profitability and equity returns from the parent company's perspective. Utilizing this data supports informed decision-making, investment analysis, and enhances transparency in consolidated financial reporting.
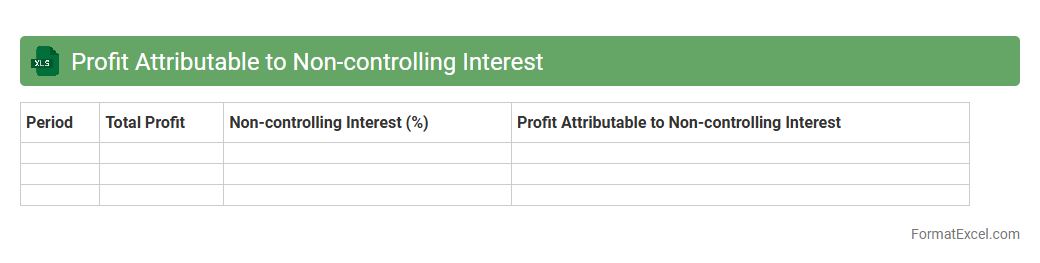
Profit Attributable to Non-controlling Interest
The Profit Attributable to Non-controlling Interest Excel document details the portion of net income allocated to minority shareholders in a consolidated subsidiary. It helps businesses accurately report earnings distribution, ensuring compliance with accounting standards such as IFRS and GAAP. Utilizing this document enhances financial transparency and supports strategic decision-making related to subsidiary management and stakeholder reporting.
Introduction to Statement of Comprehensive Income
The Statement of Comprehensive Income provides a detailed view of a company's financial performance, capturing both net income and other comprehensive income items. It reflects total changes in equity during a period, excluding transactions with owners. This statement offers a complete picture beyond the traditional income statement.
Importance of Comprehensive Income Reporting
Reporting comprehensive income ensures transparency by including all income and expense items recognized during the period. It helps investors and stakeholders assess the full financial impact of transactions. Proper reporting supports better decision-making and compliance with accounting standards.
Key Components of a Statement of Comprehensive Income
The critical elements include net profit or loss, other comprehensive income items such as foreign currency translation adjustments, unrealized gains/losses on securities, and revaluation surpluses. Each component contributes to understanding overall equity changes. Accurate classification is essential for clarity and compliance.
Format Requirements According to Accounting Standards
Accounting standards like IFRS and GAAP define specific format requirements for presenting comprehensive income statements. These include separating net income from other comprehensive income, and grouping related items clearly. Adherence ensures consistency and comparability across financial reports.
Setting Up the Statement in Excel: Step-by-Step Guide
Begin by listing revenue and expenses to calculate net income, then add sections for other comprehensive income. Use rows for key categories and columns for reporting periods. Structuring this properly in Excel enhances readability and accuracy of the comprehensive income statement.
Essential Excel Formulas for Accurate Calculations
Important formulas include =SUM() for total revenues and expenses, =SUBTOTAL() for dynamic calculations, and conditional formulas like =IF() to validate data. Use cell references to maintain accuracy when updating figures. Leveraging these formulas ensures the integrity of financial data in the statement.
Example Statement of Comprehensive Income in Excel
An example includes sections for revenue, expenses, net income, and other comprehensive income such as gains/losses on investments. Cells are formatted for currency and percentages as needed. This model helps users visualize and replicate a professional statement easily.
Tips for Customizing the Format for Different Businesses
Adapt the statement to reflect industry-specific income and expense items, adjusting categories and notes accordingly. Incorporate company branding and use filters or pivot tables for dynamic reporting. Customization maintains relevance and clarity of the comprehensive income statement.
Common Mistakes to Avoid in Excel Statements
Avoid errors like incorrect formula references, mixing different accounting periods, or omitting critical income components. Ensure consistent formatting and data validation to prevent misinterpretation. Correct handling of these risks safeguards the accuracy of the financial report.
Downloadable Statement of Comprehensive Income Excel Template
Access a ready-made Excel template designed to streamline comprehensive income reporting with pre-built formulas and formatting. This resource saves time and helps maintain compliance with accounting standards. Downloading and customizing the template simplifies financial documentation.