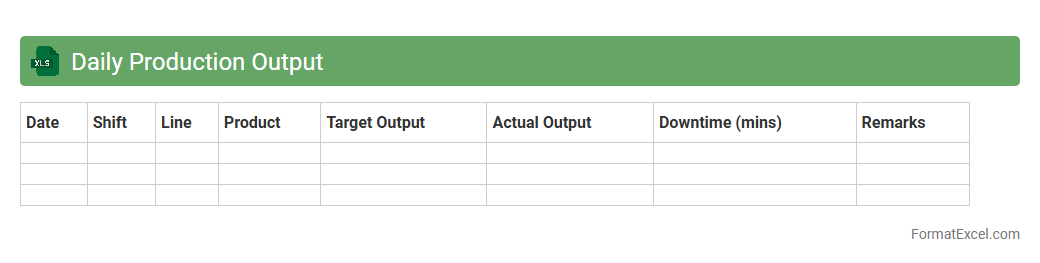
Daily Production Output
The
Daily Production Output Excel document is a detailed record that tracks the quantity of products manufactured each day within a specific period. It provides critical data for monitoring manufacturing efficiency, identifying production trends, and pinpointing bottlenecks or inconsistencies in the workflow. This document enables businesses to make informed decisions to optimize resource allocation and enhance overall productivity.
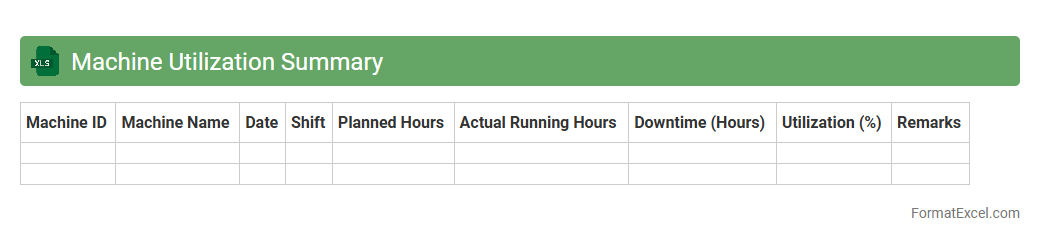
Machine Utilization Summary
The
Machine Utilization Summary Excel document provides a detailed analysis of the operational efficiency and performance metrics of machinery over a specific period. It tracks key indicators such as uptime, downtime, cycle times, and overall equipment effectiveness (OEE), enabling businesses to identify bottlenecks and optimize production schedules. This summary helps improve resource allocation, reduce maintenance costs, and increase productivity by offering clear insights into machine usage patterns.
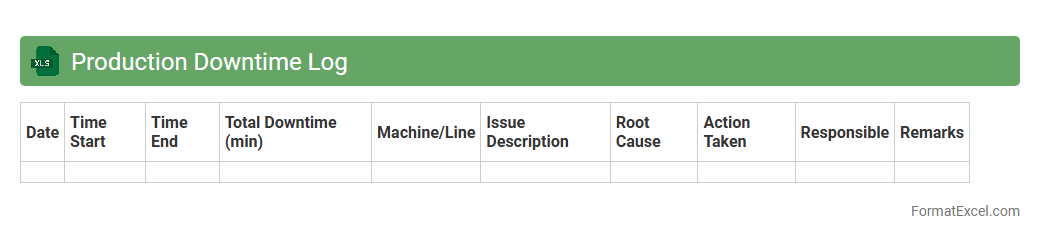
Production Downtime Log
A
Production Downtime Log Excel document is a detailed record-keeping tool that tracks periods when manufacturing or production processes are halted. It captures essential data such as downtime duration, causes, equipment involved, and the impact on overall productivity. Using this log enables businesses to identify recurring issues, optimize maintenance schedules, and improve operational efficiency, ultimately reducing costly interruptions.
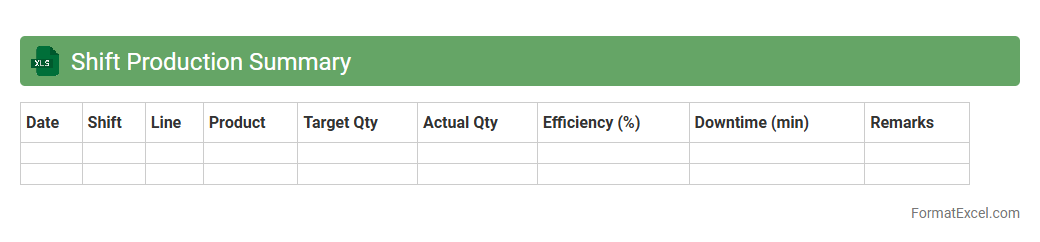
Shift Production Summary
The
Shift Production Summary Excel document is a detailed report that consolidates key metrics and outputs from manufacturing shifts, including total units produced, downtime, defect rates, and operator performance. This summary enables production managers and teams to monitor efficiency, identify bottlenecks, and make data-driven decisions to optimize workflow. By providing a clear overview of each shift's productivity, it supports continuous improvement and increases overall operational transparency.
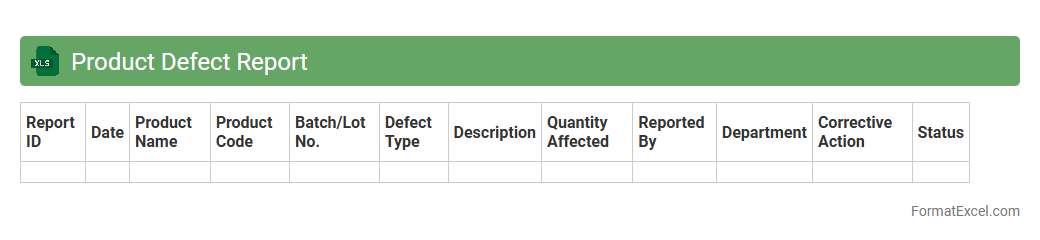
Product Defect Report
A
Product Defect Report Excel document is a structured tool used to record, track, and analyze defects found in products during manufacturing or quality inspection processes. It helps teams identify recurring issues, prioritize corrective actions, and improve overall product quality by providing detailed data on defect types, frequencies, and sources. Utilizing this report streamlines communication between departments and supports data-driven decision-making to enhance operational efficiency and customer satisfaction.
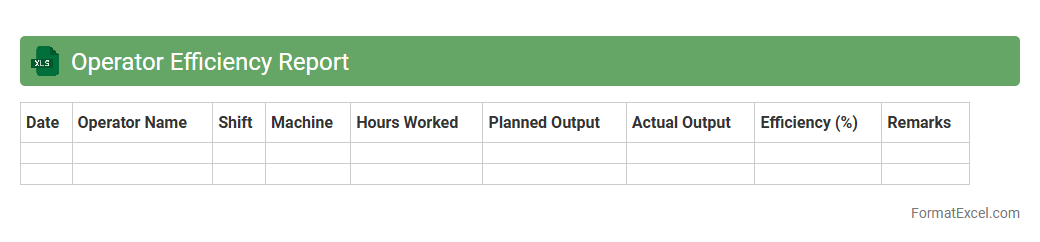
Operator Efficiency Report
The
Operator Efficiency Report Excel document is a detailed analytical tool designed to measure the productivity and performance of operators within a production or service environment. It compiles data such as output rates, downtime, and error frequencies to identify strengths and areas for improvement. This report helps managers make informed decisions on resource allocation, training needs, and process optimization to boost overall operational efficiency.
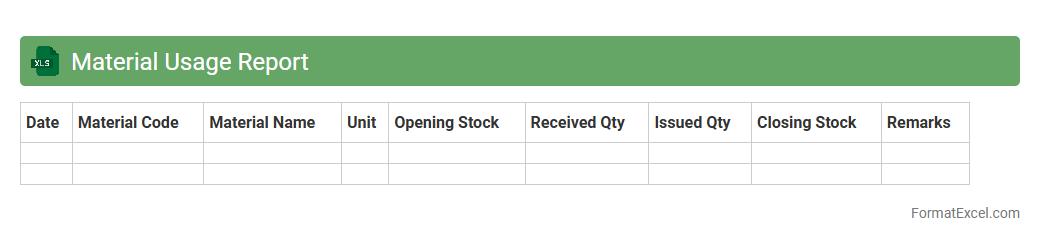
Material Usage Report
A
Material Usage Report Excel document tracks the quantity and cost of materials consumed in a project or production process, providing detailed insights into inventory management and cost control. It enables businesses to monitor material consumption patterns, identify discrepancies, and optimize procurement decisions to reduce waste. This report is essential for maintaining accurate records, improving budgeting accuracy, and enhancing overall operational efficiency.
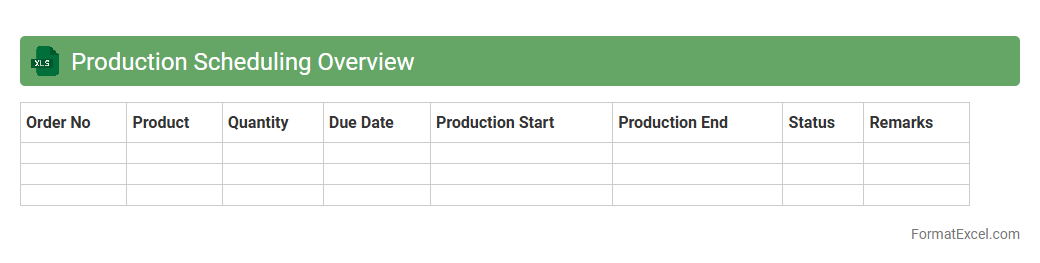
Production Scheduling Overview
The
Production Scheduling Overview Excel document serves as a centralized tool for planning, tracking, and managing manufacturing workflows. It enables efficient allocation of resources, monitoring of production timelines, and identification of potential bottlenecks to optimize manufacturing output. By providing a clear visual representation of scheduled tasks and deadlines, it supports informed decision-making and enhances overall operational productivity.
Order Fulfillment Status
An
Order Fulfillment Status Excel document tracks and updates the progress of customer orders from processing to delivery. It provides critical insights into inventory levels, shipping timelines, and order accuracy, enabling businesses to manage supply chains efficiently. This document enhances customer satisfaction by ensuring timely deliveries and quick resolution of order issues.
Work-in-Progress Status
A
Work-in-Progress Status Excel document is a dynamic tool used to track and monitor ongoing tasks, projects, or orders within an organization. It provides real-time visibility into project stages, deadlines, resource allocation, and completion percentages, enabling efficient management and timely decision-making. This document enhances transparency, improves workflow coordination, and helps prevent bottlenecks by centralizing critical project data in an easily accessible format.
Batch Production Record
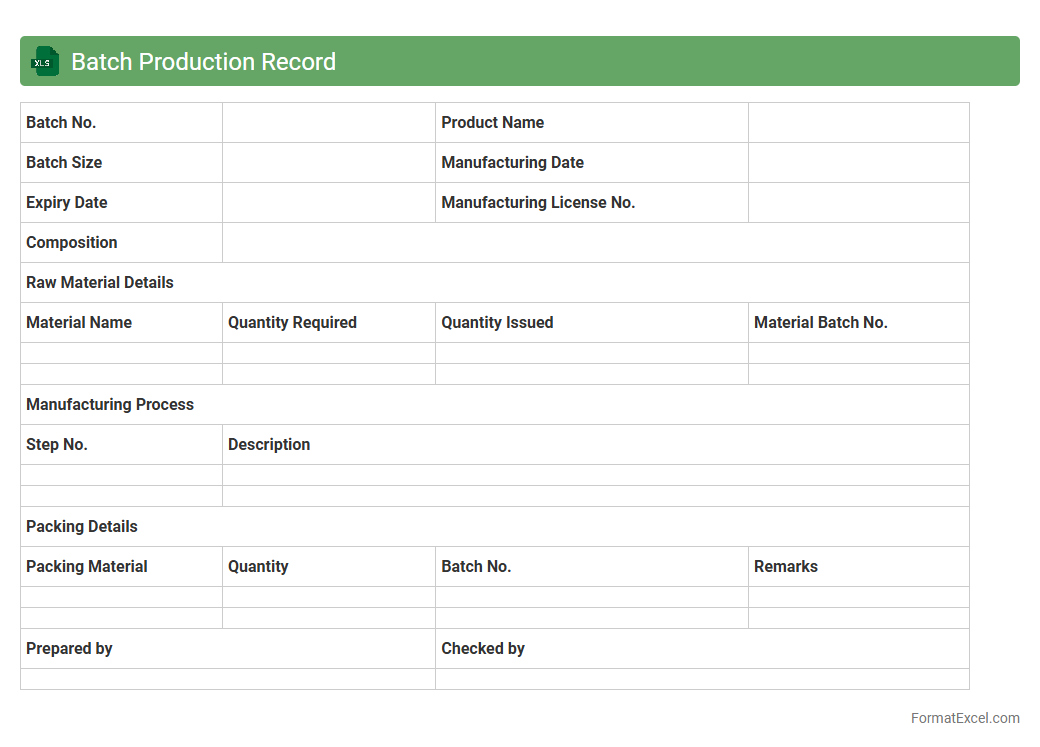
A
Batch Production Record (BPR) Excel document is a detailed digital template used to document every step of the manufacturing process for a specific batch of products. It ensures traceability, compliance with regulatory standards, and real-time monitoring of production activities by capturing data related to raw materials, process parameters, and quality checks. This tool streamlines record-keeping, reduces human error, and facilitates efficient batch tracking for quality assurance and audit purposes.
Yield Summary
A
Yield Summary Excel document is a detailed report that compiles data on production efficiency, quality metrics, and output rates in manufacturing or agricultural processes. It helps analyze variations in yield, identify bottlenecks, and track performance trends over time for informed decision-making. Using this document improves resource allocation, reduces waste, and enhances overall productivity by providing clear insights into operational success.
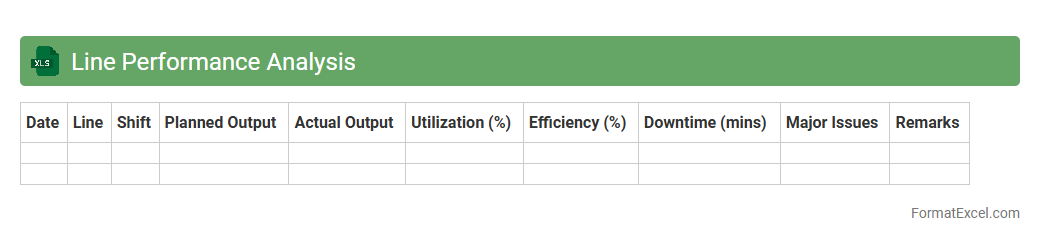
Line Performance Analysis
Line Performance Analysis Excel document is a powerful tool used to evaluate and monitor the efficiency of production lines by tracking key metrics such as cycle time, downtime, and output rates. It helps identify bottlenecks, optimize resource allocation, and improve overall operational productivity. Utilizing
data-driven insights from this analysis enables informed decision-making to enhance manufacturing processes and reduce downtime costs.
Maintenance Activity Log
A
Maintenance Activity Log Excel document is a structured record-keeping tool designed to track all maintenance tasks, including dates, descriptions, responsible personnel, and status updates. It helps organizations monitor equipment performance, schedule preventive maintenance, and identify recurring issues to reduce downtime and extend asset lifespan. By maintaining comprehensive logs, businesses improve accountability, streamline maintenance workflows, and support data-driven decision-making for operational efficiency.
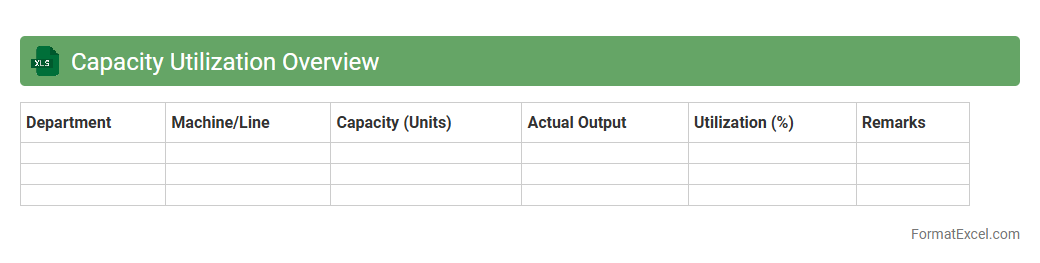
Capacity Utilization Overview
The
Capacity Utilization Overview Excel document is a comprehensive tool that tracks and analyzes the efficiency of resource usage within a production or service environment. It helps identify bottlenecks, optimize workforce allocation, and improve operational productivity by comparing actual output against potential capacity. This data-driven insight supports strategic decision-making to enhance overall business performance and reduce operational costs.
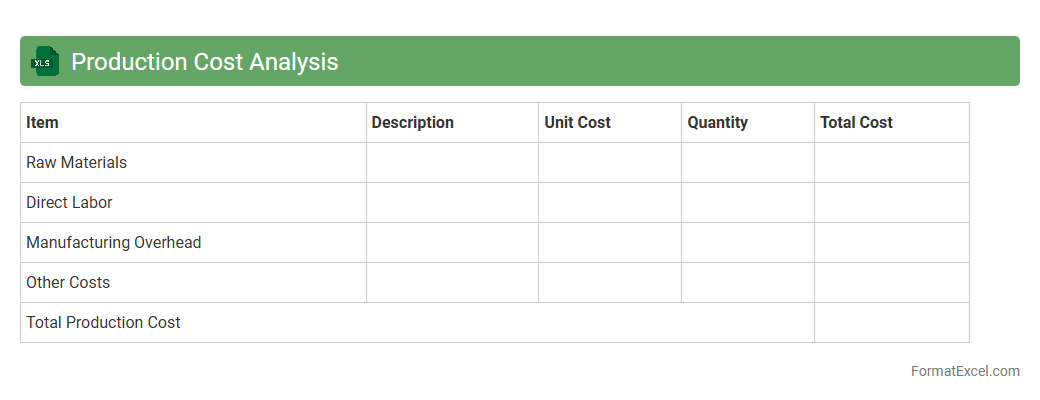
Production Cost Analysis
Production Cost Analysis Excel document is a comprehensive tool that helps businesses track and evaluate the various expenses involved in manufacturing products, including raw materials, labor, and overhead costs. By organizing and calculating these expenses systematically, the document enables companies to identify cost-saving opportunities and optimize their resource allocation.
Production Cost Analysis improves financial decision-making and enhances overall operational efficiency.
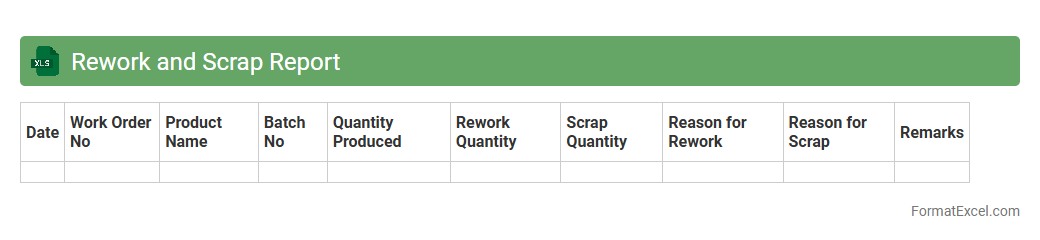
Rework and Scrap Report
The
Rework and Scrap Report Excel document tracks instances of defective or non-conforming products that require rework or scrapping during manufacturing processes. It enables detailed analysis of production inefficiencies by recording quantities, reasons for defects, and associated costs. This report is essential for improving quality control, reducing waste, and optimizing production workflows.
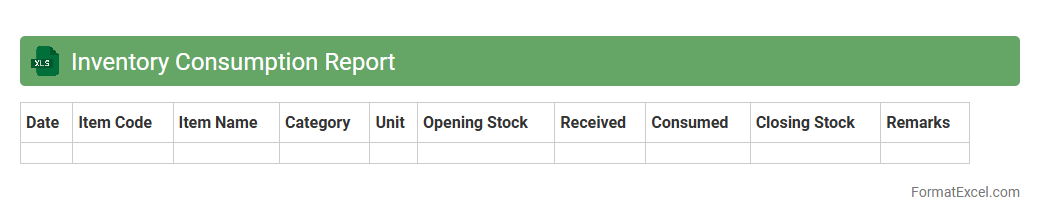
Inventory Consumption Report
An
Inventory Consumption Report Excel document tracks the quantity of materials or products used over a specific period, providing detailed insights into stock usage patterns. This report helps businesses optimize purchasing decisions, minimize waste, and maintain accurate inventory levels by identifying consumption trends. By analyzing the data, companies can improve demand forecasting and operational efficiency, ensuring steady supply without overstocking.
Hourly Production Tracking
An
Hourly Production Tracking Excel document is a powerful tool designed to record and monitor production output on an hourly basis, allowing businesses to identify trends and inefficiencies in real-time. This document consolidates key production data such as units produced, downtime, and worker performance, facilitating informed decision-making and resource allocation. By providing accurate and structured insights, it enhances productivity, reduces operational costs, and supports continuous process improvement.
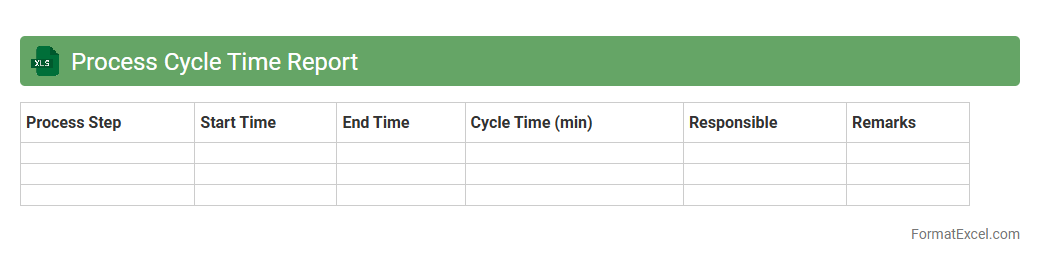
Process Cycle Time Report
The
Process Cycle Time Report Excel document tracks the duration of each step within a business process, providing detailed insights into time spent from start to finish. This report helps identify bottlenecks, improve workflow efficiency, and optimize resource allocation by highlighting delays and variations in cycle times. Utilizing this data allows organizations to enhance productivity and streamline operations effectively.
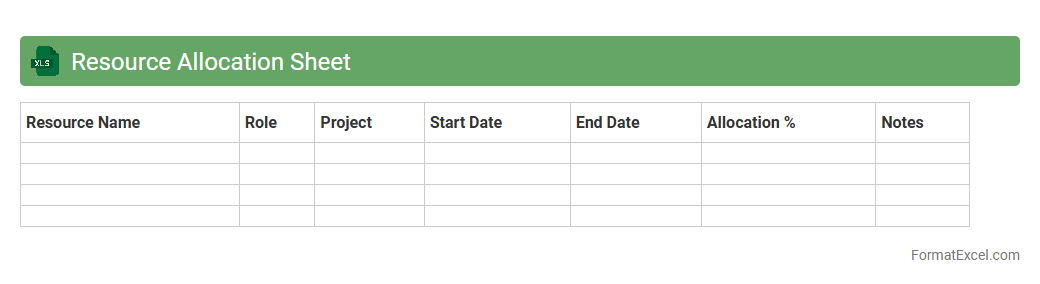
Resource Allocation Sheet
A
Resource Allocation Sheet in Excel is a tool used to manage and distribute resources such as personnel, equipment, and budget across various projects or tasks efficiently. It helps track availability, assign resources based on project timelines, and prevent overallocation to optimize productivity. This document enhances project management by providing a clear visual overview of resource utilization and ensuring balanced workload distribution.
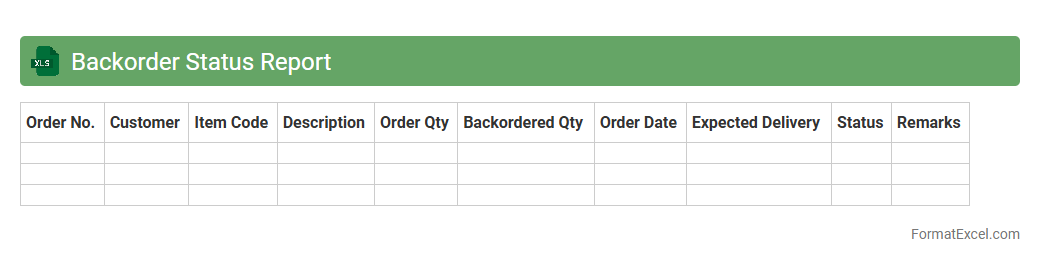
Backorder Status Report
A
Backorder Status Report Excel document tracks outstanding orders that have not yet been fulfilled due to stock shortages, providing real-time visibility into pending shipments and inventory commitments. It is useful for managing supply chain efficiency by identifying delays, prioritizing restocking efforts, and improving customer communication through accurate order status updates. This report enables businesses to optimize inventory planning, reduce backorder durations, and enhance overall operational productivity.
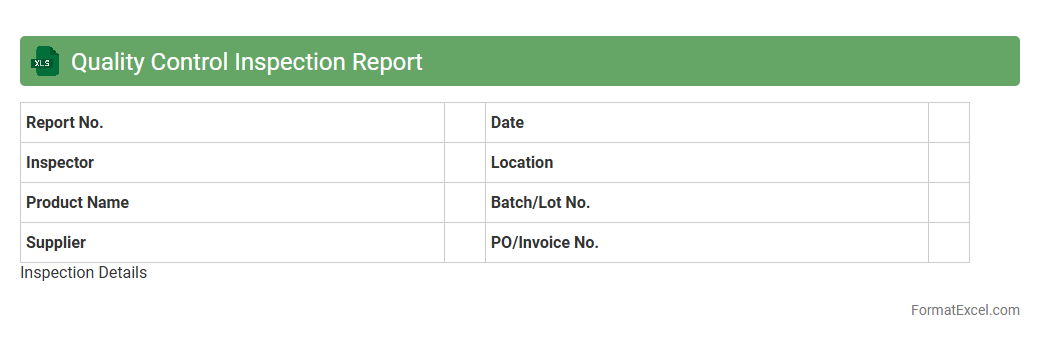
Quality Control Inspection Report
A
Quality Control Inspection Report Excel document is a structured spreadsheet used to systematically record and analyze product inspections and quality checks. It helps businesses track defects, ensure compliance with quality standards, and maintain detailed documentation for auditing purposes. Utilizing this report enables improved decision-making, reduces errors, and enhances overall product quality management.
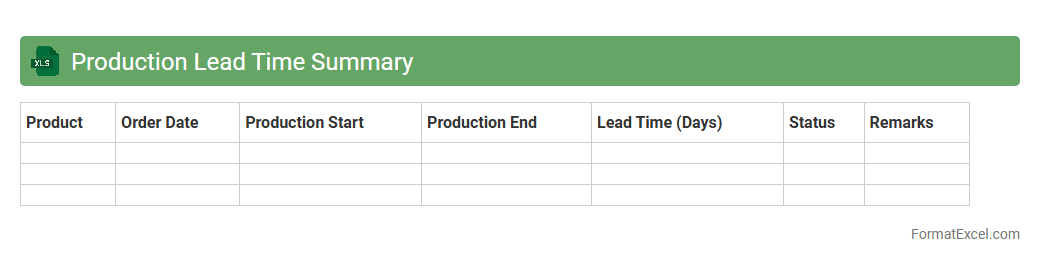
Production Lead Time Summary
The
Production Lead Time Summary Excel document consolidates key data on the duration required at each stage of the production process, enabling precise tracking and analysis of manufacturing timelines. It facilitates identification of bottlenecks, optimization of workflow efficiency, and enhanced forecasting accuracy for delivery schedules. Using this summary improves overall production planning and resource allocation, resulting in reduced downtime and increased productivity.
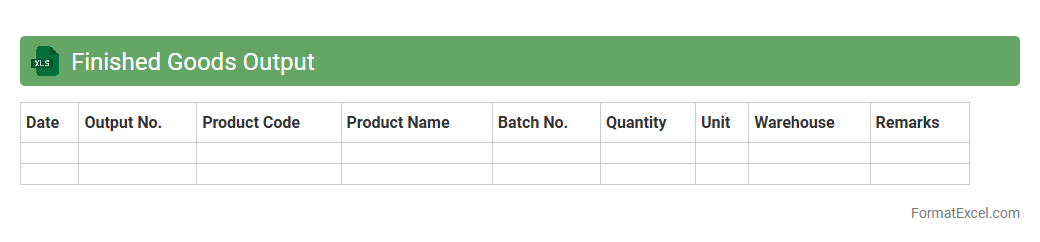
Finished Goods Output
The
Finished Goods Output Excel document is a detailed record of products that have completed the manufacturing process and are ready for sale or distribution. It helps track inventory levels, monitor production efficiency, and manage stock turnover, enabling businesses to optimize supply chain operations and meet customer demand promptly. This document provides critical insights for forecasting, budgeting, and ensuring accurate reporting of finished product quantities.
Introduction to Production Report Formats in Excel
Production report formats in Excel provide a structured way to track manufacturing processes and outputs. These templates help businesses monitor efficiency and productivity. Using Excel ensures flexibility and easy customization of production reports.
Key Components of a Production Report
A typical production report includes data on output quantity, production time, machine utilization, and workforce details. It captures performance metrics essential for analysis. Accurate recording of key components ensures effective production management.
Benefits of Using Excel for Production Reporting
Excel offers powerful tools like formulas, pivot tables, and charts that simplify data analysis. It allows real-time updates and easy sharing across teams. Leveraging Excel enhances production reporting accuracy and collaboration.
Setting Up Your Production Report Template
Start by defining your report's purpose and necessary data points. Create organized headers and consistent formatting for clarity. Setting up a clear template saves time and reduces errors in data entry.
Essential Columns in a Production Report Spreadsheet
Include columns such as Date, Product ID, Quantity Produced, Shift, Downtime, and Operator Name. These fields capture vital information for performance tracking. Well-structured columns ensure comprehensive data collection.
Tips for Organizing Data in Excel
Use clear headings, freeze panes for easy navigation, and sort data logically. Group related data and apply filters to simplify analysis. Proper data organization improves readability and usability.
Automating Calculations with Formulas
Excel formulas can calculate totals, averages, and variances automatically. Use functions like SUM, AVERAGE, and IF to streamline calculations. Automation of formulas reduces manual errors and speeds up reporting.
Incorporating Charts and Visual Summaries
Add charts like bar graphs and pie charts to visualize production trends clearly. Visual summaries make it easier to identify patterns and issues. Enhancing reports with charts boosts comprehension and decision-making.
Best Practices for Data Accuracy and Consistency
Regularly validate data entries and use drop-down lists to limit input errors. Maintain consistent formats and routinely audit reports for discrepancies. Ensuring data accuracy underpins reliable production insights.
Downloadable Production Report Format Templates
Access free downloadable Excel templates online to jumpstart your reporting process. These pre-designed formats save time and can be customized to fit specific needs. Using templates streamlines the creation of effective production reports.