Sales Performance Analysis
Sales Performance Analysis Excel document is a powerful tool that tracks and evaluates key sales metrics such as revenue, conversion rates, and individual salesperson productivity. By organizing data into clear charts, tables, and dashboards, it allows businesses to identify trends, pinpoint strengths, and uncover areas for improvement. Using this
comprehensive performance overview helps optimize sales strategies and drive informed decision-making to boost overall revenue growth.
Customer Segmentation
A
Customer Segmentation Excel document is a tool that organizes customer data into distinct groups based on characteristics such as demographics, purchasing behavior, or preferences. This segmentation allows businesses to target marketing strategies more effectively, personalize communication, and allocate resources efficiently. Utilizing customer segmentation helps improve customer retention, increase sales, and enhance overall customer satisfaction.
Profitability Analysis
A
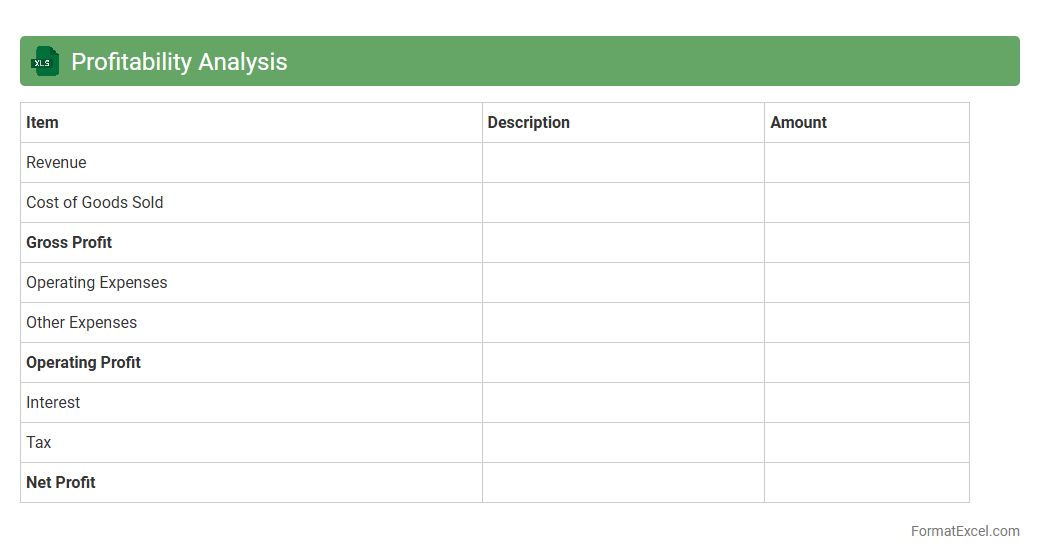
Profitability Analysis Excel document is a structured spreadsheet designed to evaluate the financial performance of a business by analyzing revenues, costs, and profit margins across different products, services, or departments. It enables users to identify high-performing areas, optimize resource allocation, and make informed decisions to enhance overall profitability. This tool is essential for tracking financial health, forecasting future earnings, and improving strategic planning.
Market Trend Analysis
A
Market Trend Analysis Excel document is a powerful tool that organizes and visualizes historical sales, consumer behavior, and competitive data to identify emerging patterns and shifts in market dynamics. It helps businesses make informed decisions by forecasting demand, optimizing inventory, and tailoring marketing strategies based on data-driven insights. Utilizing such a document enhances strategic planning and increases the ability to respond proactively to changing market conditions.
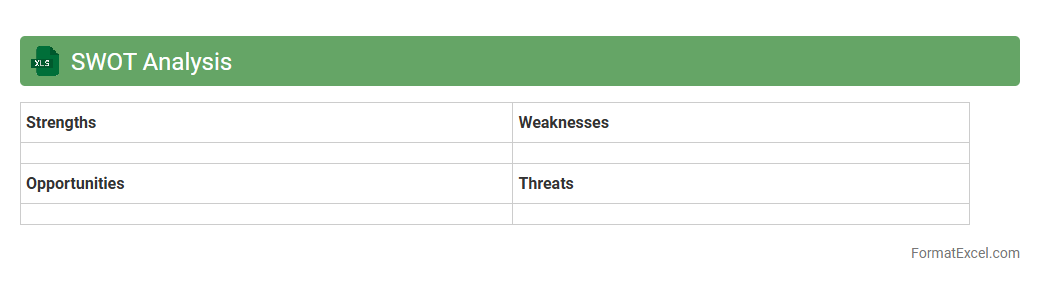
SWOT Analysis
A
SWOT Analysis Excel document organizes Strengths, Weaknesses, Opportunities, and Threats in a structured spreadsheet format, allowing businesses to visually assess internal and external factors influencing their operations. Its customizable cells and formulas enable efficient data input, analysis, and comparison, promoting strategic decision-making. By consolidating information in one accessible file, it enhances clarity and collaboration among team members during planning sessions.
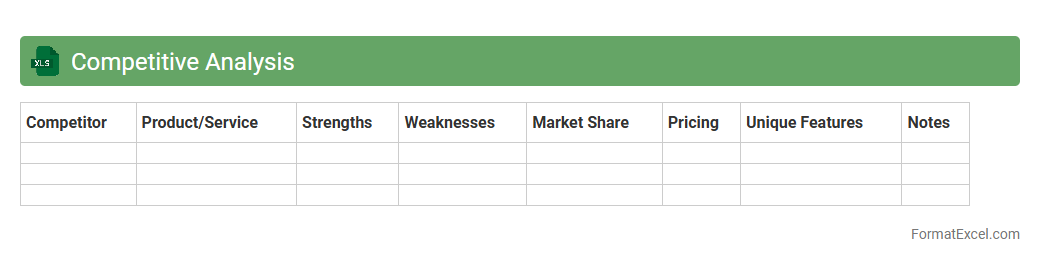
Competitive Analysis
A
Competitive Analysis Excel document is a structured spreadsheet used to systematically compare key aspects of competitors, such as pricing, features, market share, and customer feedback. It allows businesses to identify strengths and weaknesses within the industry, enabling data-driven decisions to enhance their competitive positioning. This analysis supports strategic planning, helps uncover market opportunities, and drives growth by understanding competitor strategies thoroughly.
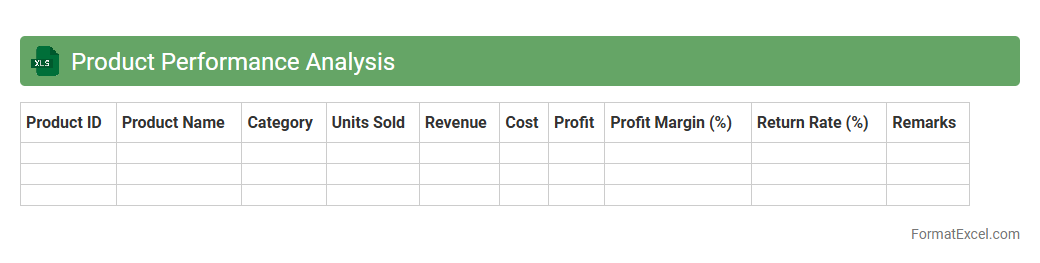
Product Performance Analysis
Product Performance Analysis Excel document is a comprehensive tool designed to evaluate key metrics such as sales volume, revenue, profit margins, and customer feedback for various products. It helps identify trends, strengths, and weaknesses by organizing and visualizing data through charts, pivot tables, and formulas, enabling data-driven decision-making. Utilizing this
performance analysis enhances inventory management, marketing strategies, and overall product development to maximize profitability and customer satisfaction.
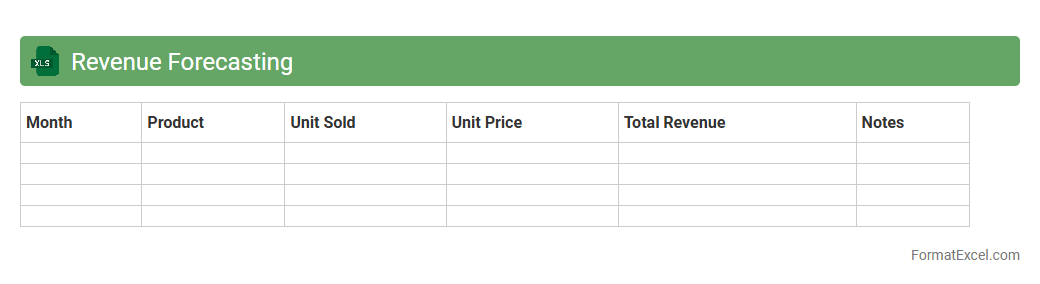
Revenue Forecasting
A
Revenue Forecasting Excel document is a powerful tool designed to project future sales income based on historical data, market trends, and business assumptions. It helps businesses anticipate cash flow, set realistic financial goals, and make informed decisions regarding budgeting, resource allocation, and investment strategies. By providing a clear visualization of expected revenue, this document enhances strategic planning and risk management.
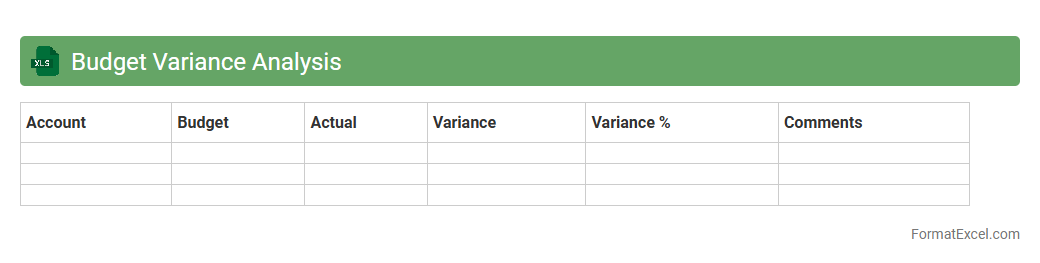
Budget Variance Analysis
Budget Variance Analysis Excel document is a powerful tool that tracks the difference between planned budgets and actual expenditures, helping organizations
monitor financial performance. It enables users to identify cost overruns or savings, facilitating informed decision-making and effective resource allocation. By analyzing these variances, businesses can improve forecasting accuracy and maintain better control over their finances.
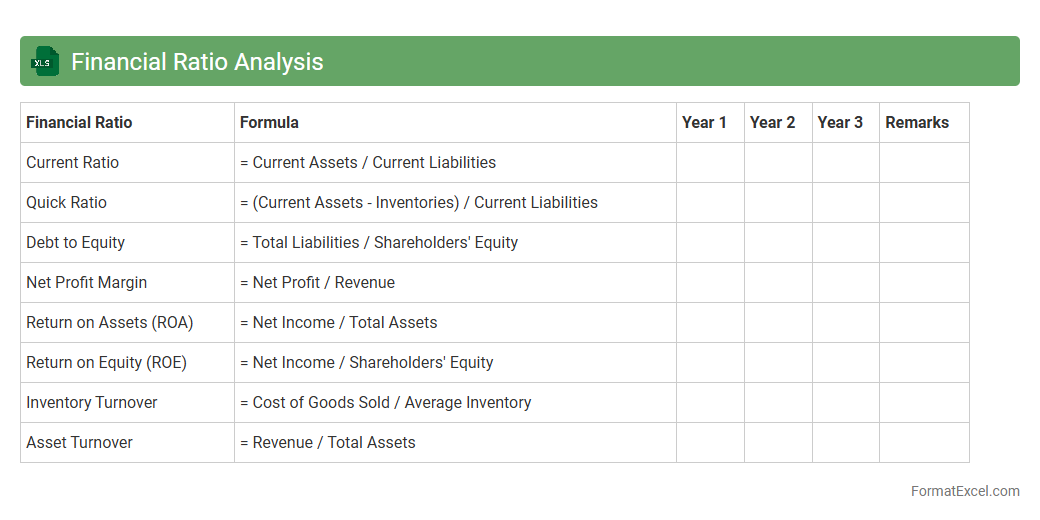
Financial Ratio Analysis
Financial Ratio Analysis excel document is a powerful tool that organizes key financial ratios such as liquidity, profitability, solvency, and efficiency ratios into a structured format for quick evaluation of a company's financial health. It enhances decision-making by enabling users to identify trends, compare performance against industry benchmarks, and detect potential financial issues early. Utilizing a
Financial Ratio Analysis excel document aids investors, managers, and analysts in making informed strategic decisions and improving financial planning.
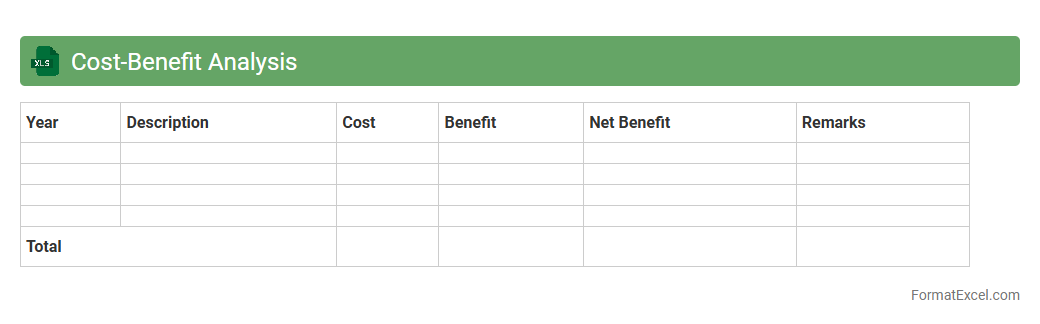
Cost-Benefit Analysis
A
Cost-Benefit Analysis Excel document is a structured spreadsheet tool designed to compare the costs and benefits of a project or decision by quantifying financial and non-financial factors. It helps users systematically evaluate potential investments by calculating net benefits, return on investment, and break-even points, enabling informed decision-making. This tool is especially useful for businesses and project managers aiming to optimize resources and maximize profitability.
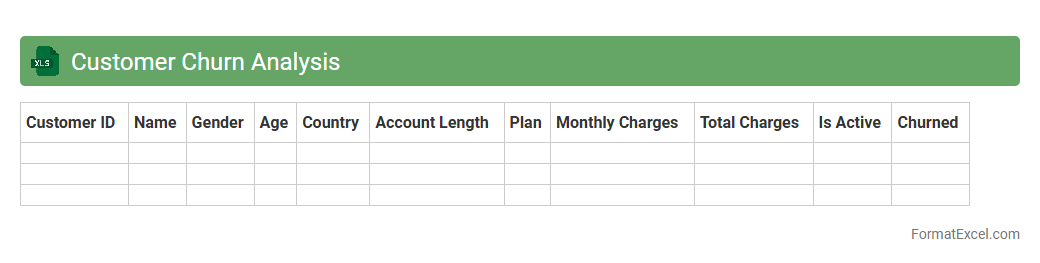
Customer Churn Analysis
Customer Churn Analysis Excel document is a powerful tool designed to track, analyze, and predict customer attrition using historical data and key metrics. It helps businesses identify patterns and risk factors associated with
customer churn, enabling targeted retention strategies and improved customer satisfaction. By leveraging this analysis, companies can reduce revenue loss, optimize marketing efforts, and enhance long-term customer loyalty.
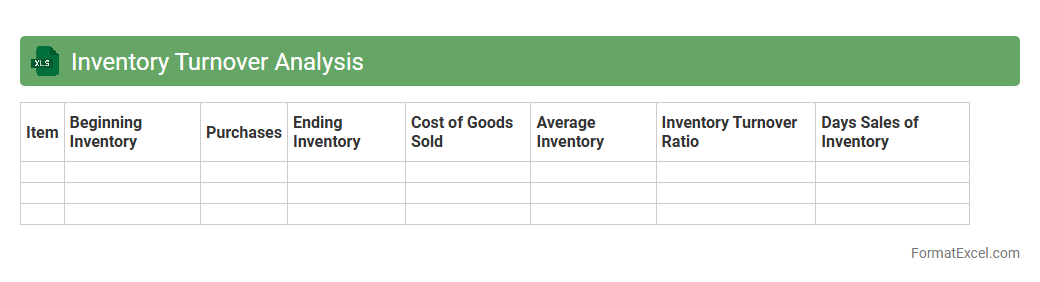
Inventory Turnover Analysis
Inventory Turnover Analysis in an Excel document tracks the frequency at which inventory is sold and replaced within a specific period, providing crucial insights into stock management efficiency. This analysis helps businesses optimize inventory levels, reduce holding costs, and improve cash flow by identifying fast-moving and slow-moving products. Using Excel for this purpose allows for customizable data visualization and real-time updates, making
inventory turnover analysis accessible and actionable for strategic decision-making.
Break-even Analysis
A
Break-even Analysis Excel document is a tool designed to calculate the point where total revenues equal total costs, indicating no profit or loss. It helps businesses understand the minimum sales volume needed to cover fixed and variable expenses, supporting effective financial planning and decision-making. Using this analysis in Excel allows easy data manipulation, visualization through charts, and scenario comparisons for informed strategy development.
Pricing Strategy Analysis
A
Pricing Strategy Analysis Excel document is a comprehensive tool used to evaluate different pricing models by analyzing factors such as cost, competitor prices, market demand, and customer segments. It helps businesses identify optimal price points that maximize profit while maintaining competitive advantage. By organizing data and performing scenario analysis, it enables informed decision-making to enhance revenue growth and market positioning.
Operational Efficiency Analysis
Operational Efficiency Analysis Excel document is a powerful tool designed to evaluate and improve business processes by tracking key performance indicators such as cycle time, resource utilization, and cost efficiency. It enables users to visualize data through charts and pivot tables, providing actionable insights to identify bottlenecks and streamline operations. Leveraging this
Operational Efficiency Analysis helps organizations reduce waste, optimize workflows, and enhance productivity for better decision-making.
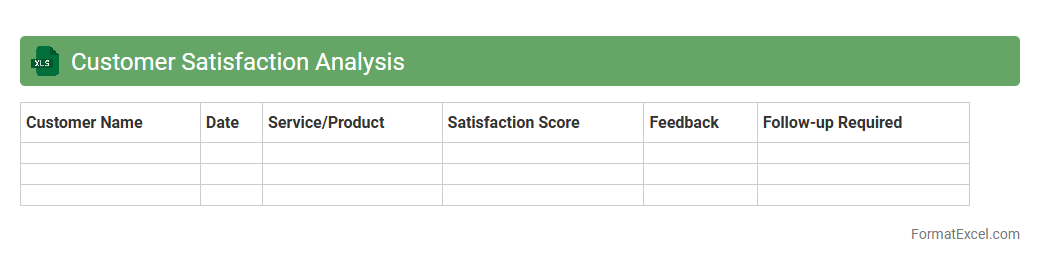
Customer Satisfaction Analysis
Customer Satisfaction Analysis in an
Excel document involves collecting, organizing, and evaluating customer feedback data to measure satisfaction levels accurately. This tool is useful for identifying trends, pinpointing areas for improvement, and enhancing overall customer experience through data-driven decisions. By using Excel's functions and visualizations, businesses can efficiently track key performance indicators and monitor progress over time.
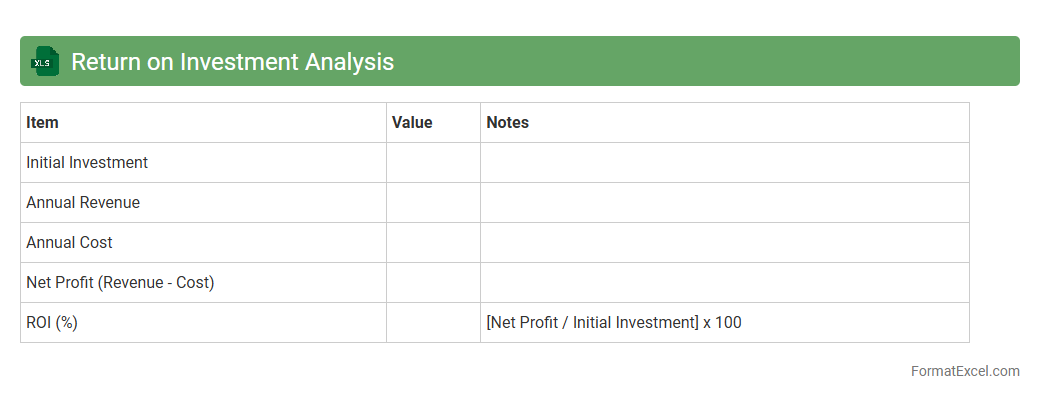
Return on Investment Analysis
A
Return on Investment (ROI) Analysis Excel document is a spreadsheet tool designed to calculate and visualize the profitability of investments by comparing gains relative to the invested cost. It helps businesses and individuals make informed financial decisions by clearly presenting data such as net returns, investment costs, and ROI percentages. Using this tool enhances financial planning and enables efficient evaluation of multiple investment opportunities for maximum profitability.
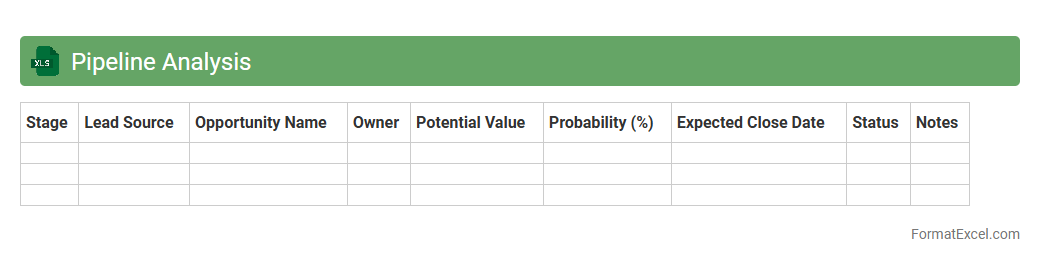
Pipeline Analysis
A
Pipeline Analysis Excel document is a structured tool designed to track and evaluate sales opportunities through different stages of the sales funnel, allowing businesses to forecast revenue and identify potential bottlenecks. It organizes data such as lead sources, deal values, probabilities, and timelines, enabling sales teams to prioritize efforts and improve conversion rates. This document enhances decision-making by providing clear visibility into the sales pipeline's health and performance trends.
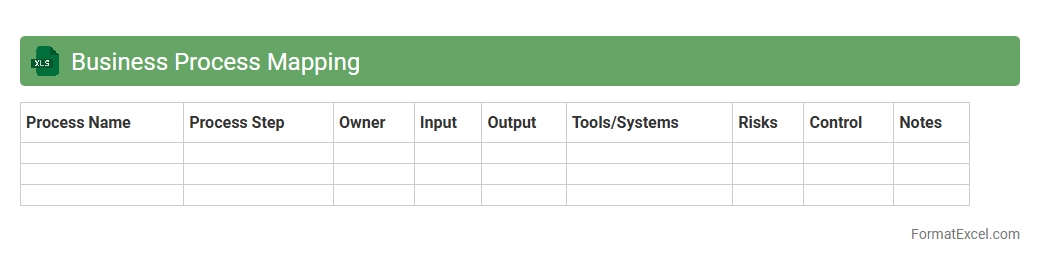
Business Process Mapping
A
Business Process Mapping Excel document visually outlines workflows, tasks, and decision points within an organization, allowing for clear identification of inefficiencies and areas for improvement. It serves as a practical tool for process analysis, enabling teams to streamline operations, enhance productivity, and ensure alignment with strategic goals. By documenting processes in Excel, businesses benefit from easy customization, data manipulation, and sharing across departments.
KPI Tracking
A
KPI Tracking Excel document is a powerful tool designed to monitor and measure key performance indicators systematically, enabling businesses to track progress against strategic goals. It helps organizations identify trends, pinpoint areas needing improvement, and make data-driven decisions by consolidating performance metrics in a clear, accessible format. Utilizing this document enhances accountability, boosts productivity, and aligns team efforts with overall business objectives.
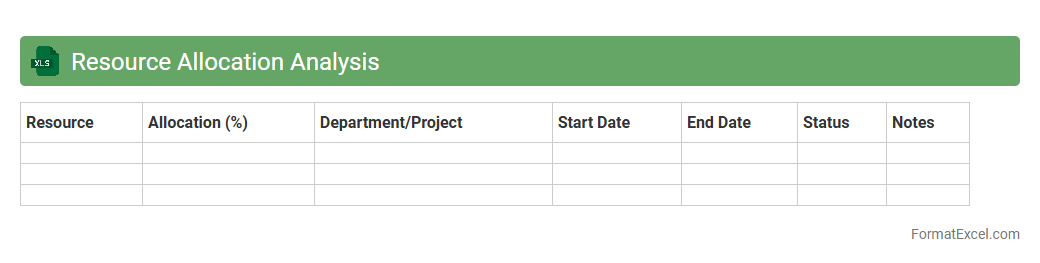
Resource Allocation Analysis
Resource Allocation Analysis Excel document is a powerful tool designed to optimize the distribution of resources such as time, budget, and personnel across multiple projects or departments. By using detailed charts, formulas, and data visualization, it enables project managers to identify resource overutilization or underutilization, ensuring balanced workloads and efficient project completion. This
resource allocation analysis empowers organizations to make data-driven decisions, improve productivity, and reduce operational costs by effectively managing available resources.
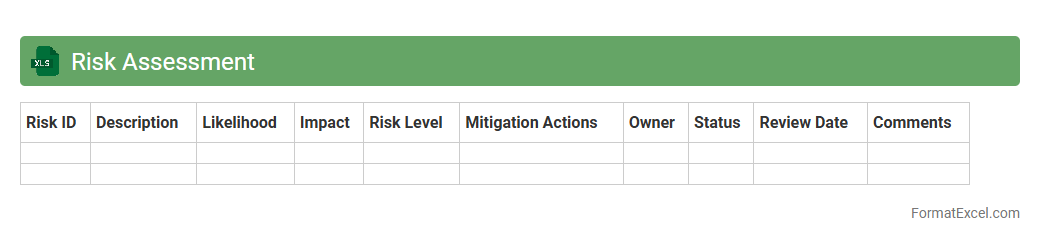
Risk Assessment
A
Risk Assessment Excel document is a structured tool designed to identify, evaluate, and prioritize potential risks within a project or organization. It helps systematically capture risk factors, assess their impact and likelihood, and implement mitigation strategies to reduce negative outcomes. This document enhances decision-making, promotes proactive management, and improves overall safety and compliance by providing a clear, organized overview of risk data.
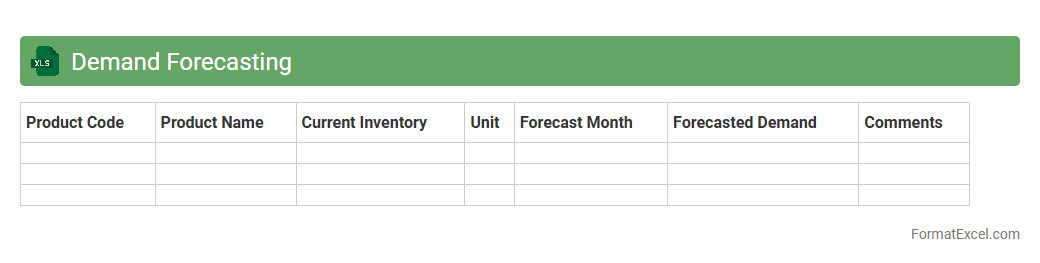
Demand Forecasting
A Demand Forecasting Excel document is a powerful tool designed to predict future customer demand for products or services using historical sales data and statistical models. It helps businesses optimize inventory levels, reduce holding costs, and improve supply chain efficiency by providing accurate sales projections. Utilizing
Demand Forecasting in Excel enables data-driven decision-making, ensuring better resource allocation and enhanced profitability.
Scenario Analysis
Scenario Analysis Excel document enables users to create multiple financial or operational models by changing key variables to evaluate different outcomes. This tool is crucial for risk management and strategic planning, allowing businesses to forecast potential impacts of decisions and market changes. Using
Scenario Analysis in Excel helps organizations make data-driven decisions by comparing best-case, worst-case, and most likely scenarios efficiently.
Introduction to Business Analysis Format in Excel
The business analysis format in Excel provides a structured approach for analyzing data to make informed decisions. It leverages Excel's versatility to organize, calculate, and present critical business insights effectively. This format benefits professionals by streamlining the analysis process and enhancing clarity.
Key Components of an Excel Business Analysis Template
An effective Excel business analysis template includes data entry sheets, calculation formulas, and summary dashboards. Each component works together to ensure data integrity and deliver actionable results. Proper modular design helps separate raw data from computed results for easy updates.
Setting Up Data Sources for Analysis
Identifying and linking reliable data sources is crucial for meaningful analysis. This setup may involve importing external files, connecting databases, or manually inputting data. Consistent formatting and refresh methods ensure the data remains current and accurate.
Structuring Data Tables for Clarity
Well-organized data tables use clear headers, consistent formatting, and appropriate ranges to improve readability. Structured tables allow for easier filtering, sorting, and referencing in formulas. This clarity supports more efficient analysis and reduces errors.
Essential Formulas and Functions for Business Analysis
Key Excel formulas like SUMIF, VLOOKUP, INDEX-MATCH, and IF statements enable dynamic and complex data manipulation. Using the right functions enhances the accuracy and depth of your business analysis. Mastery of these tools accelerates decision-making processes.
Visualizing Data: Charts and PivotTables
Charts and PivotTables transform raw data into visual insights that highlight trends and summaries. They facilitate interactive exploration of datasets and quick identification of patterns. Visual tools are essential for presenting findings to stakeholders.
Incorporating Financial Metrics and KPIs
Adding financial metrics and key performance indicators (KPIs) helps monitor business health and goal tracking. Excel allows embedding these metrics into dashboards for real-time status updates. This integration supports strategic planning and operational improvements.
Automating Analysis with Excel Tools
Automation through macros, VBA scripts, and Power Query reduces repetitive tasks and improves efficiency. These tools enable complex workflows to be executed with minimal manual intervention. Automation is key to maintaining up-to-date and scalable analysis models.
Best Practices for Data Validation and Accuracy
Implementing data validation rules and error checking ensures input consistency and minimizes mistakes. Regular reviews and audits of formulas guarantee the integrity of analytical results. Reliable data quality is foundational for trustworthy business insights.
Downloadable Excel Business Analysis Templates
Access to downloadable Excel templates accelerates the setup of your business analysis projects. These templates come pre-built with essential formulas, tables, and visualizations. Utilizing them saves time and helps standardize analytical approaches across teams.