Defect Summary Table
A
Defect Summary Table excel document systematically records and categorizes software defects, enabling teams to track issues by status, severity, and priority. It consolidates defect data, facilitating trend analysis and helping project managers identify critical problem areas that require immediate attention. Using this document enhances communication across development and QA teams, streamlining defect resolution and improving overall software quality.
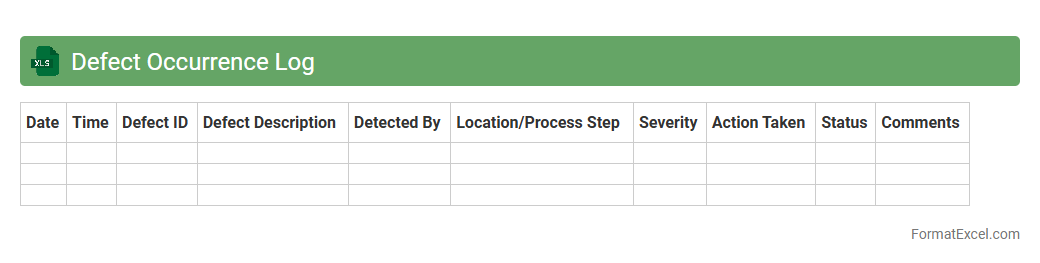
Defect Occurrence Log
A
Defect Occurrence Log Excel document systematically records and tracks software or product defects, capturing details such as defect ID, description, severity, status, and resolution timeline. This log enables teams to monitor defect patterns, prioritize fixes, and improve overall quality control by providing clear visibility into recurring issues. Utilizing the Defect Occurrence Log enhances communication among stakeholders and supports data-driven decisions in the development and testing process.
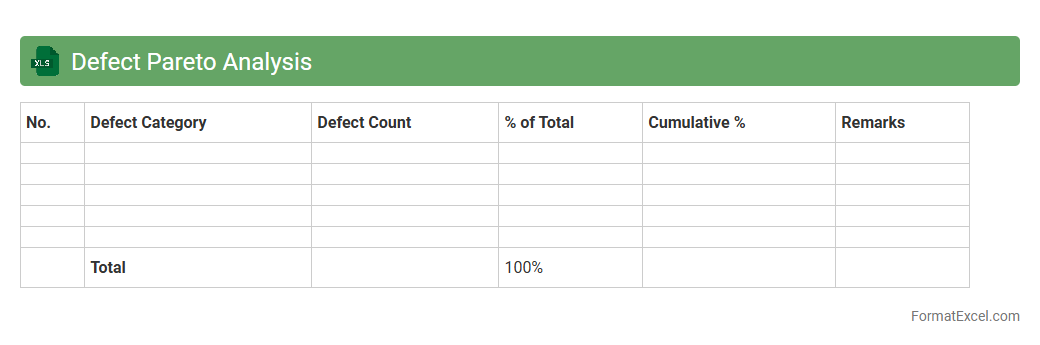
Defect Pareto Analysis
Defect Pareto Analysis Excel document is a tool used to identify and prioritize the most significant defects in a process by applying the
Pareto Principle, which states that roughly 80% of problems come from 20% of causes. It provides a visual representation, typically a bar chart, that helps teams focus on the critical few defects contributing most to quality issues. This analysis enables organizations to allocate resources effectively, improve product quality, and reduce defects systematically.
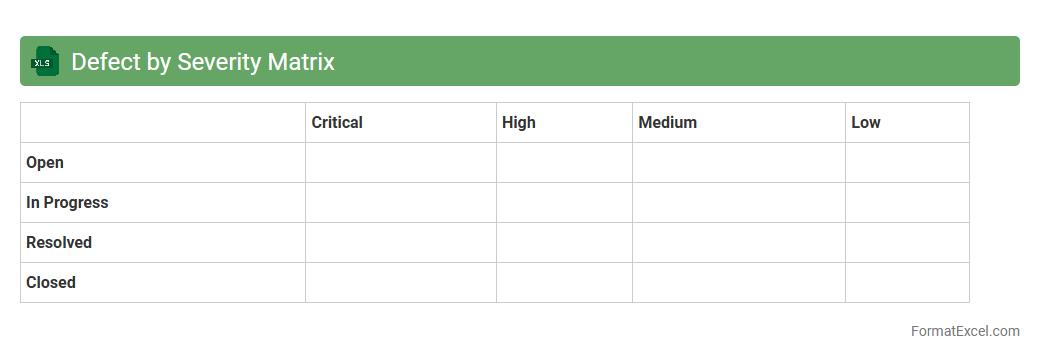
Defect by Severity Matrix
The
Defect by Severity Matrix Excel document categorizes software defects based on their severity levels, allowing teams to visualize and prioritize issues effectively. By organizing defects into critical, major, minor, and trivial categories, this matrix facilitates targeted resource allocation and efficient risk management during software development and testing. It enhances quality assurance processes by providing clear insights into defect distribution, enabling faster resolution and improved product reliability.
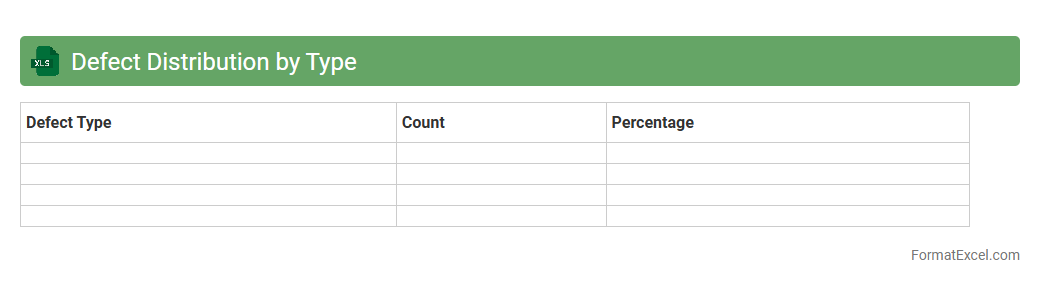
Defect Distribution by Type
The
Defect Distribution by Type Excel document categorizes and quantifies defects within a project or product, enabling teams to identify prevalent issues efficiently. By analyzing defect types, stakeholders gain valuable insights into quality trends, facilitating targeted improvements and resource allocation. This tool supports data-driven decision-making, enhancing overall defect management and product reliability.
Defect Root Cause Tracking
A
Defect Root Cause Tracking Excel document systematically records and analyzes the underlying causes of defects in products or processes, enabling teams to identify patterns and areas for improvement. By organizing defect data with categories, timestamps, and resolution statuses, it facilitates targeted corrective actions and prevents recurrence. This tool enhances quality control, supports continuous improvement, and drives efficiency across projects and manufacturing workflows.
Defect Resolution Status Report
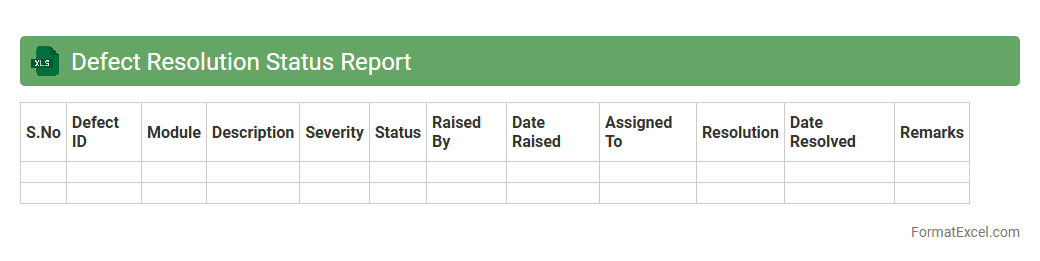
A
Defect Resolution Status Report Excel document tracks the progress and status of identified defects throughout the software development lifecycle, providing a clear overview of defect IDs, severity levels, assigned resources, and resolution timelines. It helps project managers and QA teams efficiently monitor the resolution process, prioritize critical issues, and ensure timely closure of defects. This report enhances communication, supports decision-making, and improves the overall quality management process by offering real-time insights into defect resolution metrics.
Defect Trend Over Time
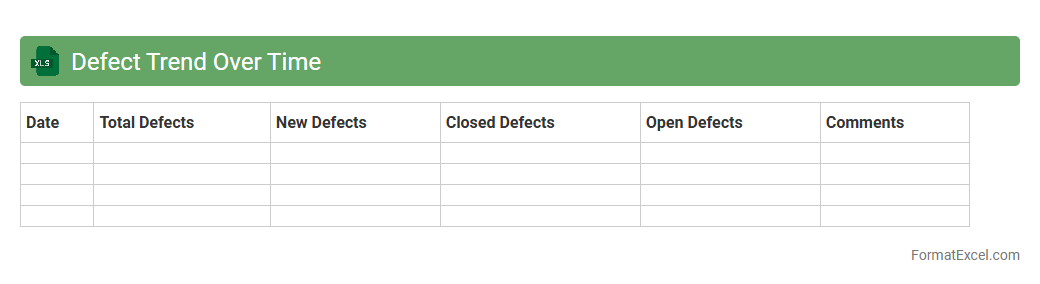
The
Defect Trend Over Time Excel document tracks and visualizes the number of defects identified in a project or product across specific time intervals, enabling teams to observe patterns and fluctuations. By analyzing this trend data, organizations can pinpoint recurring issues, evaluate the effectiveness of quality improvement initiatives, and make data-driven decisions to enhance product reliability. This document supports proactive defect management by highlighting areas that require focused attention to reduce defect incidence and improve overall quality.
Defect Aging Report
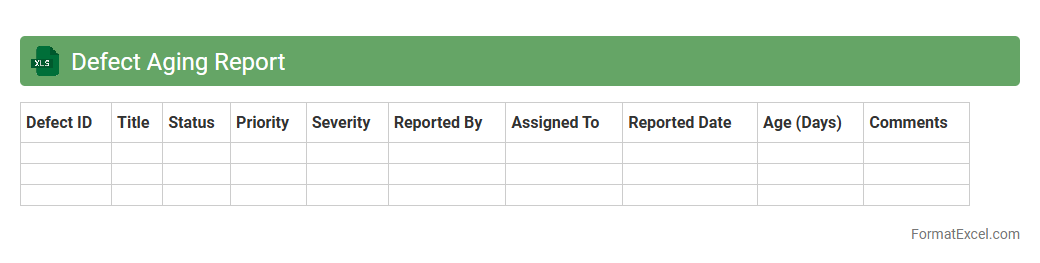
A
Defect Aging Report Excel document tracks the duration defects remain unresolved within a project, providing detailed insights into defect status and trends over time. It is useful for identifying bottlenecks in issue resolution, prioritizing critical bugs based on their aging, and improving overall project quality management. By analyzing this report, teams can enhance decision-making, allocate resources effectively, and ensure timely delivery of software products.
Defect Density by Module
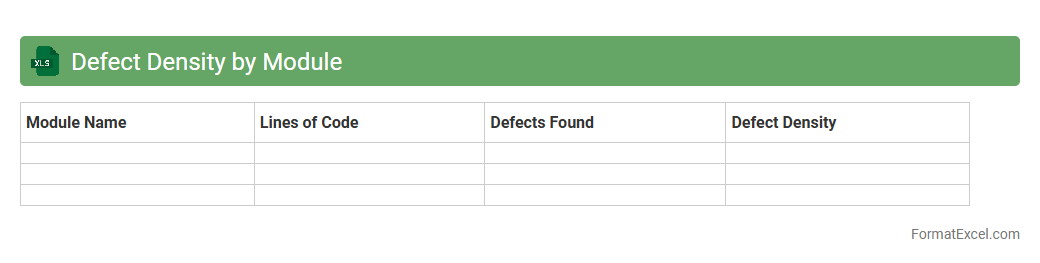
The
Defect Density by Module Excel document tracks the number of defects identified per module relative to the size of the code, typically measured in lines of code or function points. This spreadsheet allows teams to pinpoint which modules have higher defect rates, enabling targeted quality improvement efforts. By analyzing defect density, organizations can prioritize testing resources, reduce maintenance costs, and enhance overall software reliability.
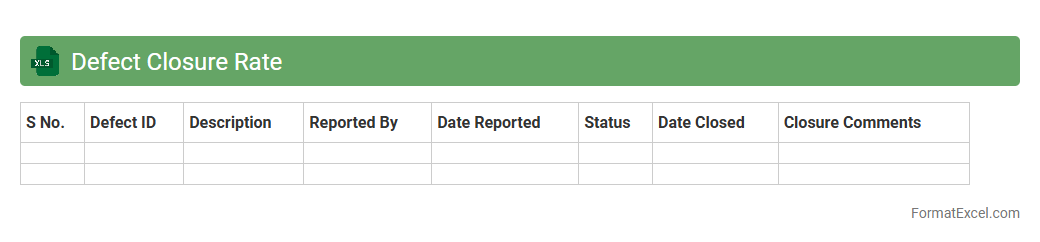
Defect Closure Rate
A
Defect Closure Rate Excel document tracks the number of software defects resolved over a specific period, providing clear metrics on the efficiency of bug fixes and quality assurance processes. It helps project managers and QA teams monitor progress, identify bottlenecks, and improve development cycles by ensuring timely resolution of issues. The organized structure of the Excel sheet facilitates data analysis, reporting, and informed decision-making for software quality improvement.
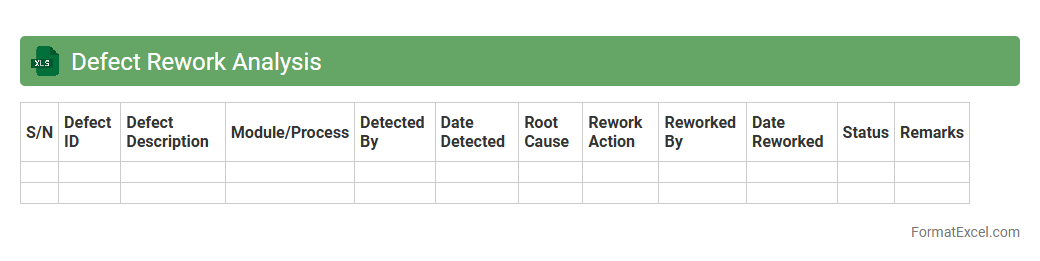
Defect Rework Analysis
The
Defect Rework Analysis Excel document is a powerful tool designed to track and analyze defects in project deliverables or manufacturing processes. It provides detailed insights into the causes, frequency, and cost impact of rework activities, enabling teams to identify patterns and prioritize corrective actions. By leveraging this analysis, organizations can enhance quality control, reduce waste, and improve overall operational efficiency.
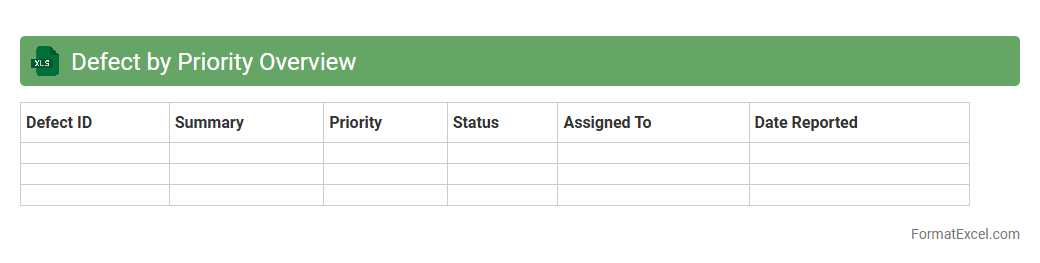
Defect by Priority Overview
The
Defect by Priority Overview Excel document provides a detailed summary of software defects categorized by their priority levels, enabling efficient tracking and management of issues. It helps teams quickly identify high-priority defects that need immediate attention, ensuring prompt resolution and improved software quality. By visualizing defect distribution, this document supports better decision-making and resource allocation during development and testing phases.
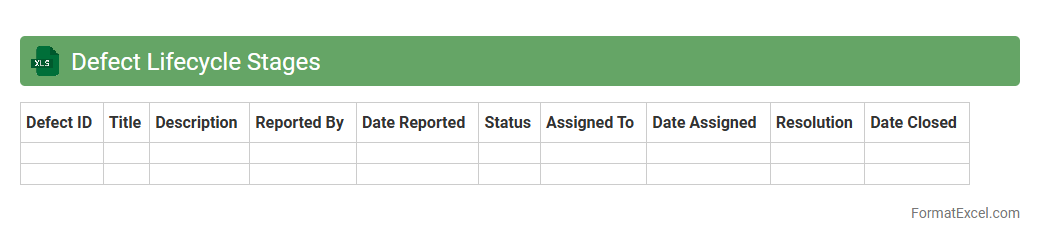
Defect Lifecycle Stages
The
Defect Lifecycle Stages Excel document is a structured tool used to track and manage the status of defects throughout the software development process. It helps teams visualize each phase of a defect, from identification to resolution, ensuring clear communication and timely resolution. This document improves efficiency by providing a centralized, easy-to-update record that enhances defect tracking and quality assurance efforts.
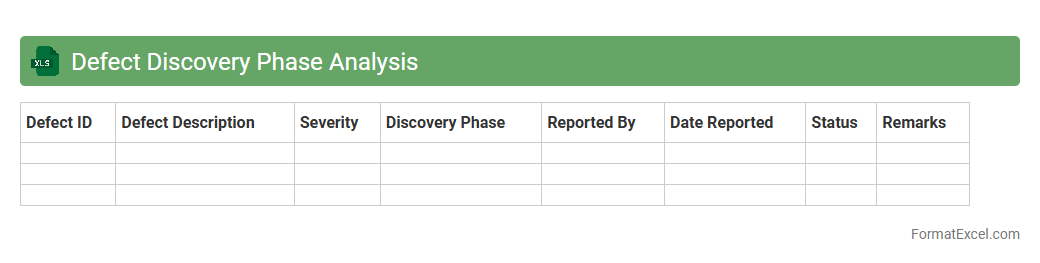
Defect Discovery Phase Analysis
The
Defect Discovery Phase Analysis Excel document systematically tracks and categorizes defects identified during various stages of the software development lifecycle, enabling precise measurement of defect density and phase-wise performance. It helps teams identify critical patterns and root causes of defects early, facilitating targeted improvements in quality assurance processes and reducing overall project risk. By providing clear visualizations and detailed summaries, this document supports data-driven decision-making for optimizing testing strategies and enhancing product reliability.
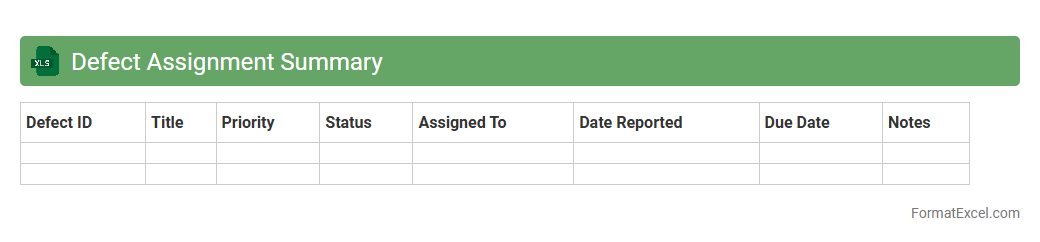
Defect Assignment Summary
The
Defect Assignment Summary Excel document consolidates defect tracking data, including defect IDs, statuses, assigned personnel, and resolution timelines, offering a clear overview of the defect management process. This summary enhances team collaboration by providing real-time insights into defect distribution and progress, enabling efficient prioritization and resource allocation. It serves as a critical tool for monitoring project quality, identifying bottlenecks, and ensuring timely defect resolution for improved product delivery.
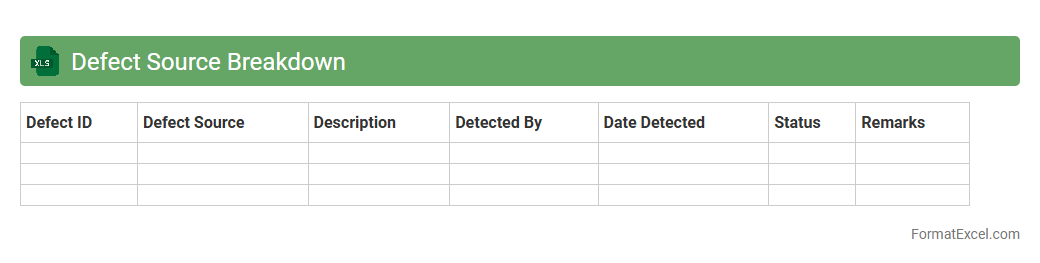
Defect Source Breakdown
A
Defect Source Breakdown Excel document systematically categorizes and tracks defects by their origin, enabling precise identification of recurring issues in software or product development. This tool enhances quality control by providing clear insights into defect patterns, guiding targeted corrective actions and process improvements. It supports data-driven decision-making to reduce defect rates and improve overall project outcomes.
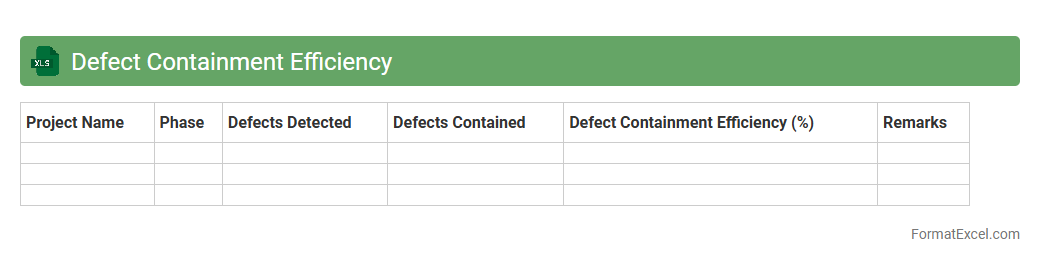
Defect Containment Efficiency
The
Defect Containment Efficiency Excel document is a tool designed to measure the effectiveness of defect detection and resolution processes within software development or quality assurance projects. It calculates the percentage of defects identified and resolved before reaching the customer, helping teams to identify bottlenecks and improve quality control measures. By tracking Defect Containment Efficiency, organizations can enhance product reliability, reduce post-release defects, and optimize testing efforts.
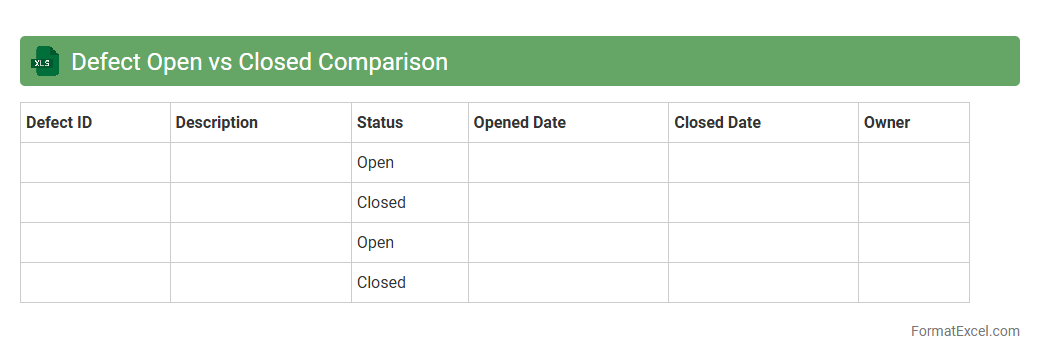
Defect Open vs Closed Comparison
The
Defect Open vs Closed Comparison Excel document tracks and compares the number of defects identified and resolved over a specific period, providing clear insights into project quality and progress. It helps teams monitor defect trends, prioritize issues, and measure the effectiveness of their testing and development efforts. Using this document enables more informed decision-making, enhancing overall product reliability and timely delivery.
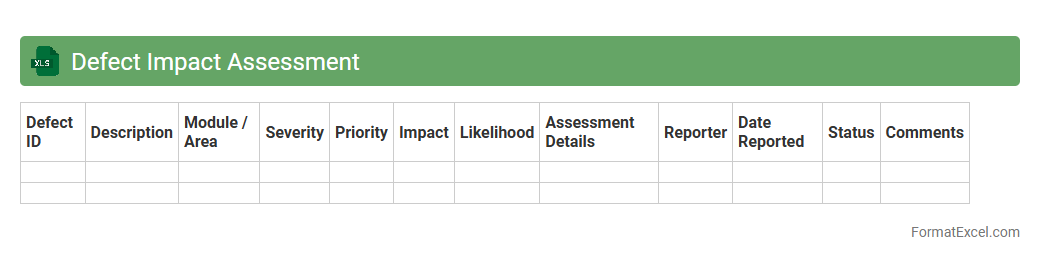
Defect Impact Assessment
A
Defect Impact Assessment Excel document systematically evaluates the severity and consequences of software defects by categorizing their effects on functionality, performance, and user experience. It helps teams prioritize defect resolution based on potential business impact, resource allocation, and risk mitigation. This tool enhances decision-making efficiency, ensuring critical issues receive immediate attention while optimizing development workflows.
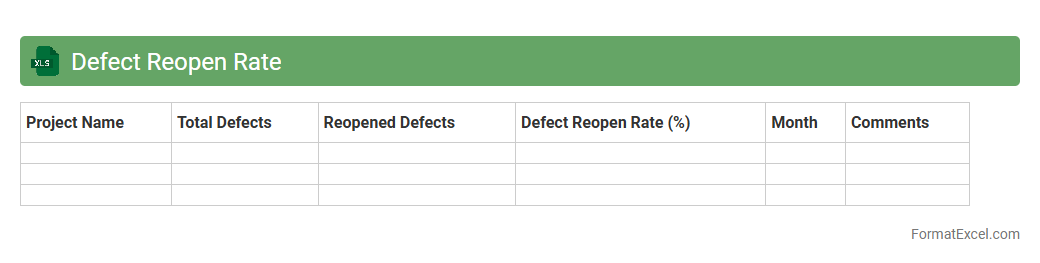
Defect Reopen Rate
The
Defect Reopen Rate Excel document tracks the percentage of software bugs reopened after being marked as resolved, providing key insights into the quality and effectiveness of the defect resolution process. It helps teams identify patterns in defect handling, measure the success of fixes, and improve overall product quality by reducing recurring issues. Analyzing defect reopen rates enables project managers to allocate resources efficiently and enhance testing strategies for better software reliability.
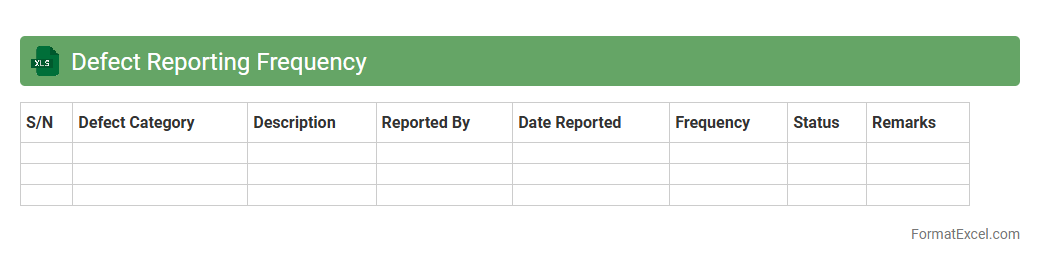
Defect Reporting Frequency
The
Defect Reporting Frequency Excel document tracks the number and recurrence of software defects over time, enabling teams to identify patterns and prioritize areas for improvement. It allows project managers and quality assurance teams to analyze defect trends, assess the effectiveness of testing processes, and allocate resources effectively. This document supports data-driven decision-making to enhance product quality and reduce the overall defect rate.
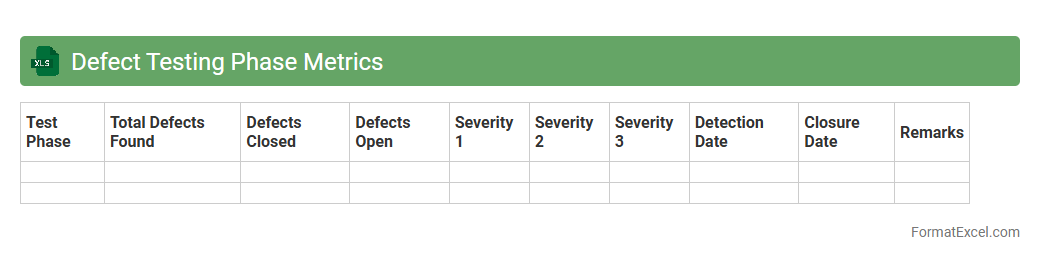
Defect Testing Phase Metrics
The
Defect Testing Phase Metrics Excel document systematically tracks and analyzes defects identified during various testing phases, providing clear insights into software quality and testing effectiveness. It enables project teams to measure defect density, defect discovery rate, and resolution times, facilitating data-driven decisions to enhance product reliability. This document is invaluable for improving testing strategies, prioritizing fixes, and ensuring timely delivery of high-quality software.
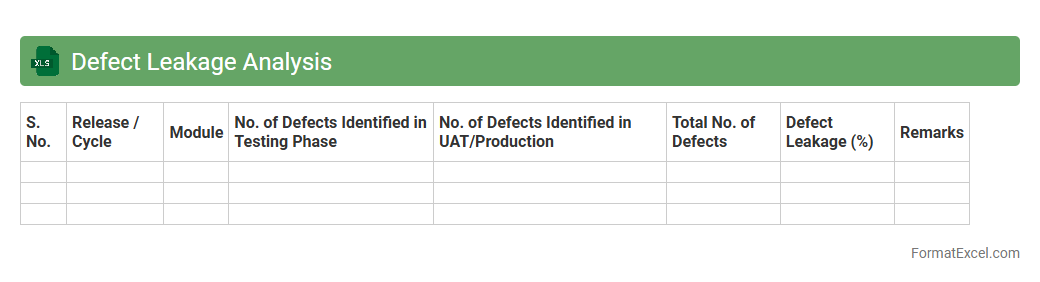
Defect Leakage Analysis
Defect Leakage Analysis Excel document is a structured tool used to track and analyze defects that escape the testing phase and are found in production or later stages. It helps identify patterns in defect leakage by capturing defect details, root causes, and impacted modules, enabling teams to improve testing strategies and enhance product quality. Using this document supports continuous improvement by reducing recurring issues and increasing the
efficiency of defect management processes.
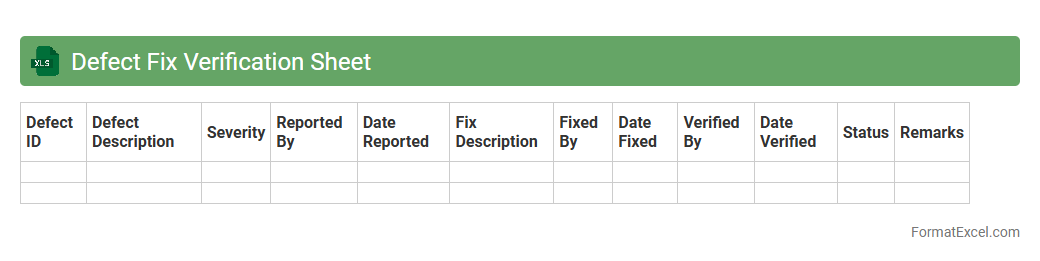
Defect Fix Verification Sheet
The
Defect Fix Verification Sheet Excel document serves as a structured tool to track and confirm the resolution of software defects. It enables teams to systematically record defect details, testing status, and verification outcomes, ensuring accountability and quality control throughout the development lifecycle. This document is crucial for enhancing communication between developers and testers, reducing the risk of unresolved issues, and streamlining project management efforts.
Introduction to Defect Analysis
Defect analysis is the process of identifying, categorizing, and tracking errors to improve product quality. It helps teams understand root causes and prevent recurrence. A well-structured defect analysis process ensures efficient resolution and quality control.
Importance of Systematic Defect Tracking
Systematic defect tracking allows for consistent monitoring of product issues over time. It helps prioritize fixes based on severity and impact, ensuring resources are allocated effectively. Accurate defect tracking enhances overall quality management and decision-making.
Key Components of a Defect Analysis Format
A typical defect analysis format includes defect ID, description, severity, status, assigned person, and resolution date. These components provide a clear overview of each defect and its current state. Including essential fields ensures effective defect documentation.
Advantages of Using Excel for Defect Analysis
Excel offers flexibility, ease of use, and powerful data manipulation tools for defect management. It allows sorting, filtering, and generating charts for better visualization. Utilizing Excel simplifies defect tracking and reporting processes.
Essential Columns in a Defect Analysis Excel Sheet
Important columns include Defect ID, Description, Priority, Status, Assigned To, Date Reported, and Resolution Notes. These fields capture comprehensive details to track and manage defects effectively. Including these columns ensures an organized and comprehensive defect log.
Step-by-Step Guide to Creating a Defect Analysis Template
Start by defining columns based on key defect information and formatting cells for clarity. Use data validation to maintain consistency and conditional formatting to highlight critical defects. This stepwise approach helps create a user-friendly and efficient defect template.
Sample Defect Analysis Format in Excel
A sample format typically includes rows for each defect and columns for details like status and priority. It may also contain drop-down menus and color codes to enhance usability. This sample provides a practical defect tracking blueprint.
Best Practices for Maintaining Defect Records
Regular updates, accurate data entry, and consistent review meetings are key to effective defect record maintenance. Backing up files and tracking changes helps prevent data loss and maintains integrity. Adhering to best practices supports reliable and up-to-date defect records.
Common Mistakes in Defect Analysis Documentation
Common errors include incomplete data, inconsistent terminology, and delayed updates. These mistakes can mislead analysis and slow down corrective actions. Avoiding such issues ensures clear and actionable defect documentation.
Downloadable Defect Analysis Excel Format Template
A downloadable template provides a ready-made structure for quick implementation of defect tracking. It often includes pre-set columns, formatting, and instructions for use. Utilizing a downloadable template streamlines defect analysis adoption.