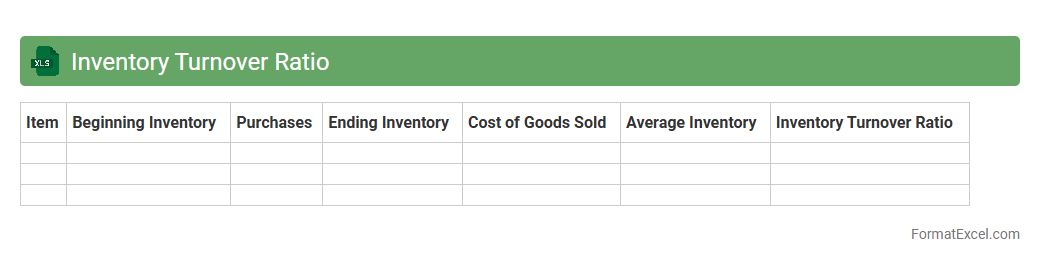
Inventory Turnover Ratio
The
Inventory Turnover Ratio Excel document is a spreadsheet tool designed to calculate and analyze how efficiently a company manages its inventory by measuring the number of times inventory is sold and replaced over a period. This document helps businesses identify trends in stock movement, optimize inventory levels, reduce holding costs, and improve cash flow management. Utilizing this ratio, companies can make informed decisions regarding purchasing, sales strategies, and inventory control practices to enhance overall operational efficiency.
Inventory Turnover by Product
The
Inventory Turnover by Product Excel document tracks the frequency at which individual products are sold and replaced over a specific period, providing detailed insights into product performance and stock management. It helps businesses identify fast-moving and slow-moving items, optimize inventory levels, reduce holding costs, and improve cash flow efficiency. This data-driven approach enables better purchasing decisions and enhances overall inventory control strategies.
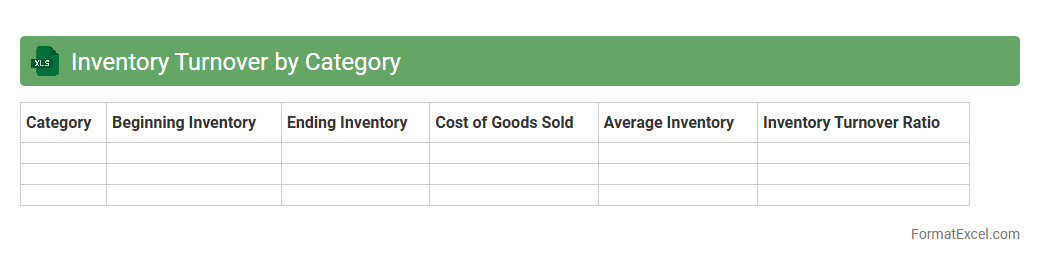
Inventory Turnover by Category
The
Inventory Turnover by Category Excel document tracks the frequency at which inventory is sold and replaced within specific product categories, providing insights into sales performance and stock management efficiency. This data helps businesses identify slow-moving items, optimize reorder schedules, and improve cash flow by reducing excess stock. Utilizing this tool supports informed decision-making to enhance overall inventory control and profitability.
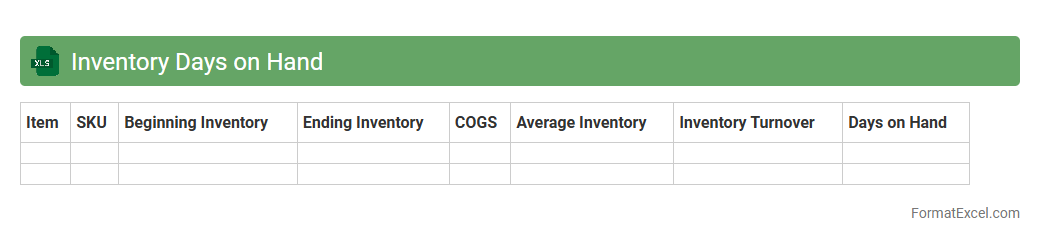
Inventory Days on Hand
Inventory Days on Hand Excel document calculates the average number of days a company holds its inventory before selling it, providing crucial insights into stock management efficiency. By analyzing
Inventory Days on Hand, businesses can optimize inventory turnover, reduce holding costs, and improve cash flow management. This tool helps identify slow-moving products and supports better demand forecasting to maintain optimal inventory levels.
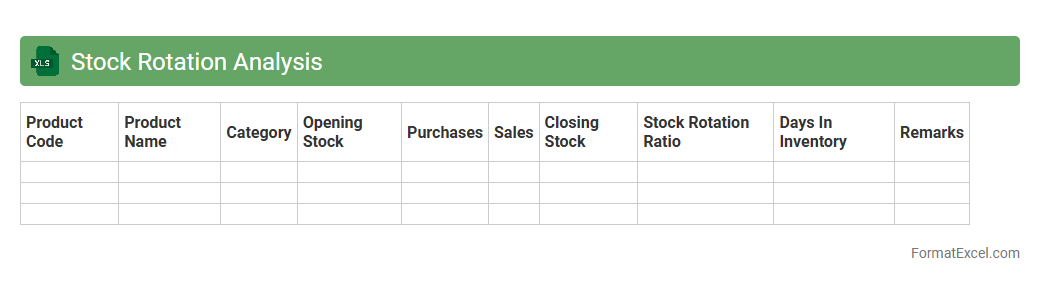
Stock Rotation Analysis
Stock Rotation Analysis Excel document is a powerful tool that tracks inventory turnover by analyzing the frequency and timing of stock movements within a specified period. It helps businesses identify slow-moving items, optimize reorder points, and reduce holding costs by ensuring efficient product rotation. Using
Stock Rotation Analysis enhances inventory management, leading to improved cash flow and minimized waste.
Inventory Turnover Trends
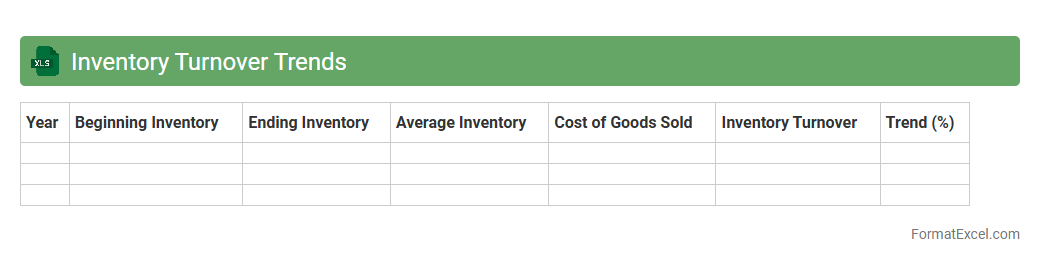
The
Inventory Turnover Trends Excel document tracks the frequency at which inventory is sold and replaced over a specific period, providing valuable insights into stock management and sales efficiency. It helps businesses identify patterns in product demand, optimize inventory levels, reduce holding costs, and improve cash flow by minimizing excess stock and stockouts. By analyzing turnover trends, companies can make informed decisions to enhance operational productivity and profitability.
Inventory Turnover Benchmarking
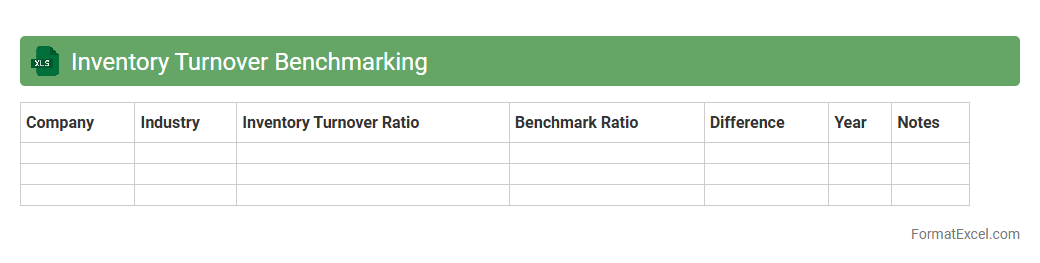
The
Inventory Turnover Benchmarking Excel document provides a detailed analysis of inventory efficiency by comparing turnover ratios across industries or competitors. It helps businesses identify inefficiencies, optimize stock levels, and improve cash flow management by highlighting how frequently inventory is sold and replaced within a specific period. Using this tool enables organizations to make data-driven decisions that minimize holding costs and enhance overall supply chain performance.
Average Inventory Calculation
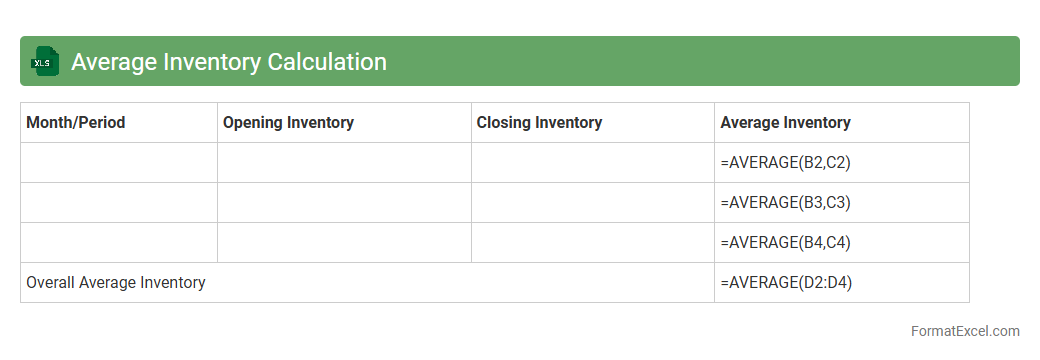
An
Average Inventory Calculation Excel document helps track and analyze inventory levels over a specific period, providing crucial insights into stock management. By calculating average inventory, businesses can optimize ordering, reduce carrying costs, and improve cash flow. This tool supports better decision-making in supply chain management and financial planning.
Opening and Closing Inventory
An
Opening and Closing Inventory Excel document is a vital tool for tracking the quantity and value of stock at the beginning and end of an accounting period, ensuring accurate inventory management. It helps businesses monitor stock levels, calculate cost of goods sold (COGS), and improve financial reporting accuracy. Using this document facilitates informed decision-making by providing clear insights into inventory fluctuations and supporting effective resource allocation.
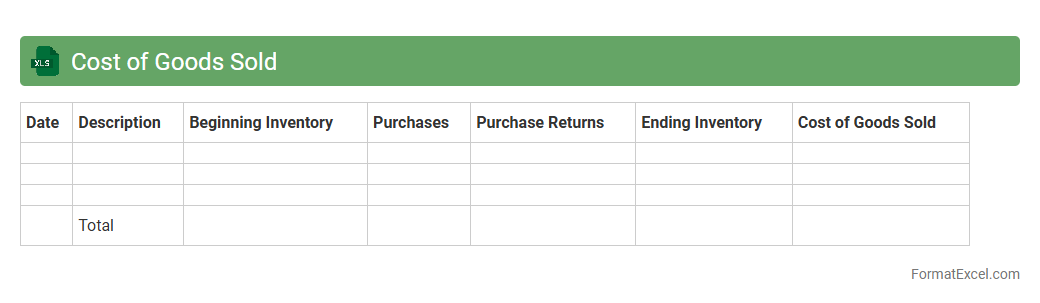
Cost of Goods Sold
Cost of Goods Sold (COGS) Excel document is a spreadsheet tool designed to track and calculate the direct costs associated with producing goods sold by a business, including materials, labor, and manufacturing expenses. It helps businesses accurately determine gross profit by subtracting COGS from total revenue, providing essential financial insights for pricing, budgeting, and inventory management. Utilizing this document enhances decision-making by offering clear visibility into production costs and profitability metrics.
Inventory Aging Report
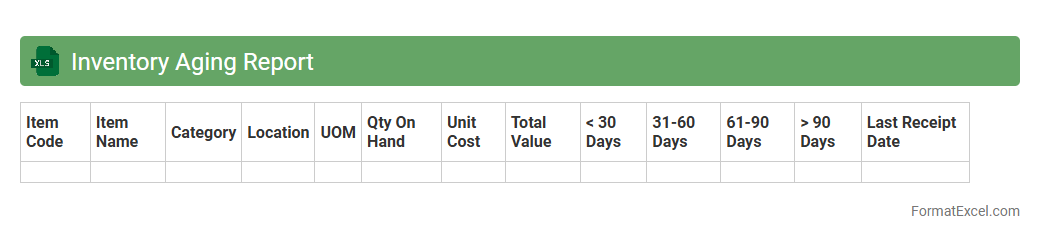
An
Inventory Aging Report Excel document tracks the age of stock items by categorizing inventory based on the duration they have been held, typically segmented into date ranges like 0-30 days, 31-60 days, and beyond. This report helps businesses identify slow-moving or obsolete inventory, enabling better decision-making related to stock replenishment, discounting strategies, and cash flow optimization. Using this data, companies can reduce carrying costs, improve warehouse space utilization, and maintain healthier inventory turnover rates.
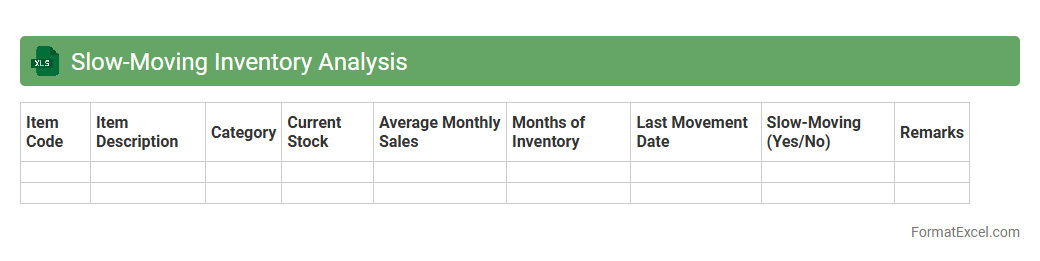
Slow-Moving Inventory Analysis
Slow-Moving Inventory Analysis is an Excel document designed to identify products with low sales velocity, helping businesses optimize stock levels and reduce holding costs. By tracking inventory turnover rates and highlighting items that remain unsold for extended periods, this tool aids in making informed decisions on purchasing, discounting, or phasing out obsolete stock. It ultimately enhances cash flow management and increases overall operational efficiency by focusing on
inventory optimization.
Excess Inventory Report
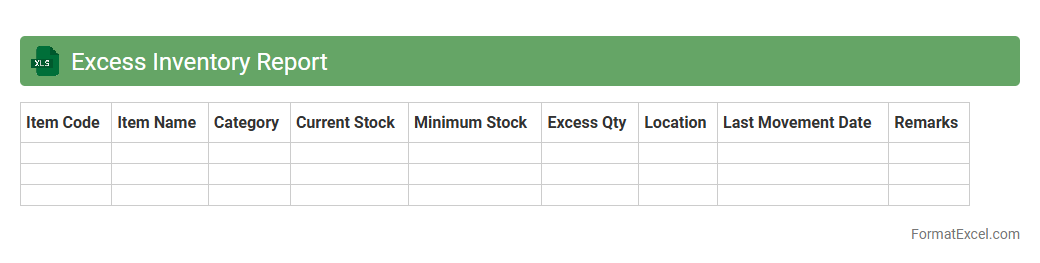
The
Excess Inventory Report Excel document identifies stock items that exceed optimal inventory levels, helping businesses minimize carrying costs and reduce waste. By analyzing inventory turnover rates and stock aging data, the report enables informed decisions on clearance sales, stock redistribution, or procurement adjustments. It supports efficient inventory management, improves cash flow, and enhances overall supply chain performance.
Fast-Moving Inventory Report
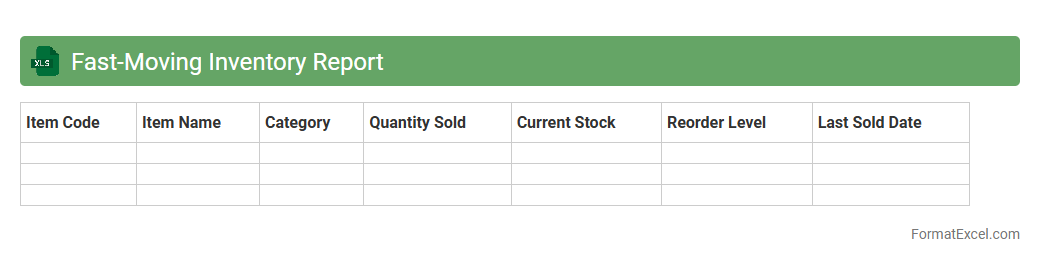
The
Fast-Moving Inventory Report Excel document tracks products with the highest sales velocity, enabling businesses to identify top-selling items quickly. This report helps optimize stock levels by highlighting which inventory needs frequent replenishment, reducing the risk of stockouts or overstocking. Utilizing this data-driven approach enhances supply chain efficiency and improves decision-making for inventory management.
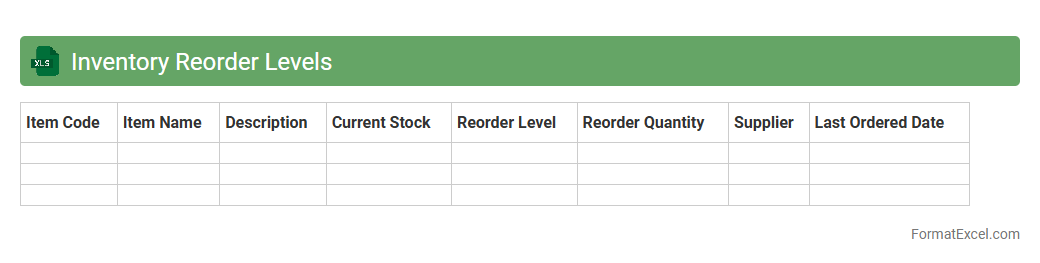
Inventory Reorder Levels
An
Inventory Reorder Levels Excel document is a tool that tracks stock quantities and sets threshold points to trigger timely restocking. It helps businesses avoid stockouts or overstocking by signaling when to reorder products based on historical sales data and lead times. Utilizing this Excel sheet enhances inventory management efficiency, reduces holding costs, and ensures continuous product availability.
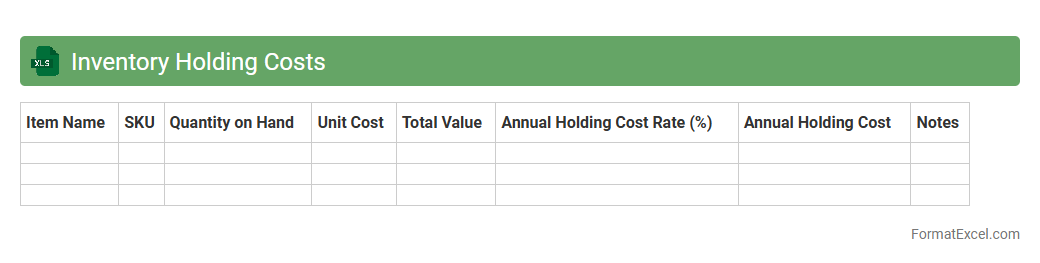
Inventory Holding Costs
An
Inventory Holding Costs Excel document is a tool designed to calculate and analyze the expenses associated with storing unsold inventory, including warehousing, insurance, depreciation, and obsolescence. It helps businesses identify the total cost tied up in inventory, enabling better decision-making for optimizing stock levels and reducing unnecessary expenses. By providing clear data insights, this document supports effective inventory management and boosts overall operational efficiency.
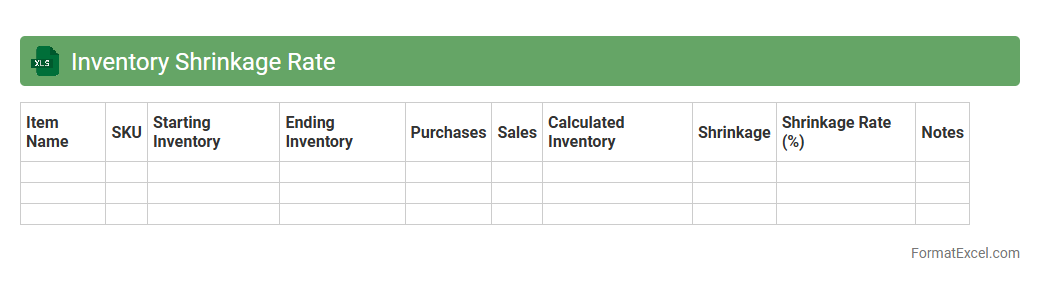
Inventory Shrinkage Rate
The
Inventory Shrinkage Rate Excel document calculates the percentage of lost merchandise due to theft, damage, or errors, helping businesses monitor discrepancies between recorded and actual stock levels. This tool enables companies to identify patterns of loss, optimize inventory management, and reduce costs associated with shrinkage. By providing clear, quantifiable insights, the document supports informed decision-making to maintain accurate inventory records and improve overall operational efficiency.
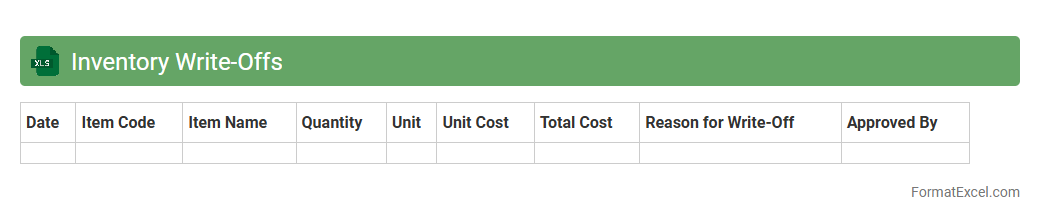
Inventory Write-Offs
An
Inventory Write-Offs Excel document is a structured spreadsheet used to record and track inventory items that are no longer sellable due to damage, expiration, or loss. It helps businesses accurately update their financial records by reflecting the reduced value of inventory, aiding in effective asset management and financial reporting. This document streamlines the audit process and supports decision-making by providing clear visibility into inventory losses and trends.
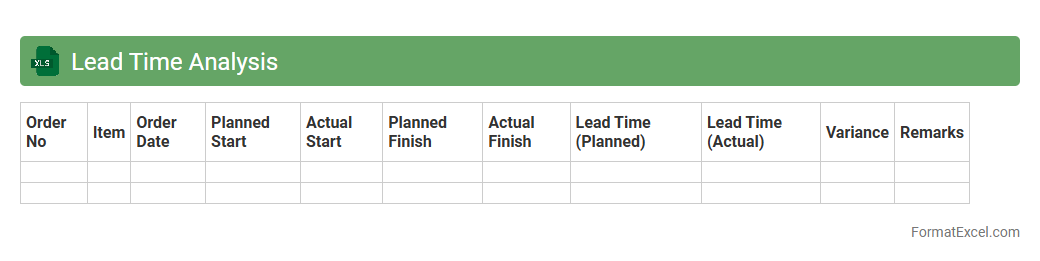
Lead Time Analysis
Lead Time Analysis Excel document is a powerful tool designed to track and measure the duration between the initiation and completion of a process, helping businesses identify inefficiencies and delays. By analyzing lead times across various stages, teams can optimize workflows, reduce bottlenecks, and improve overall productivity. This
data-driven approach enables informed decision-making, leading to enhanced customer satisfaction and timely project delivery.
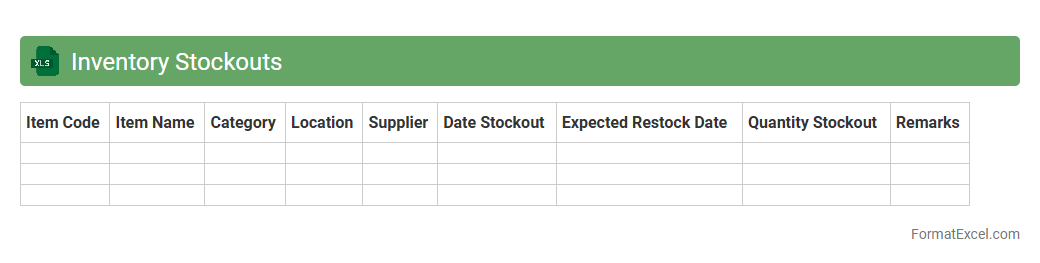
Inventory Stockouts
An
Inventory Stockouts Excel document is a spreadsheet tool designed to track and analyze instances when inventory levels fall below the required threshold, causing potential stockouts. It helps businesses monitor product availability, forecast demand, and identify patterns in stock depletion to optimize reorder points and prevent lost sales. By providing clear visibility into inventory gaps, this document supports efficient supply chain management and enhances customer satisfaction.
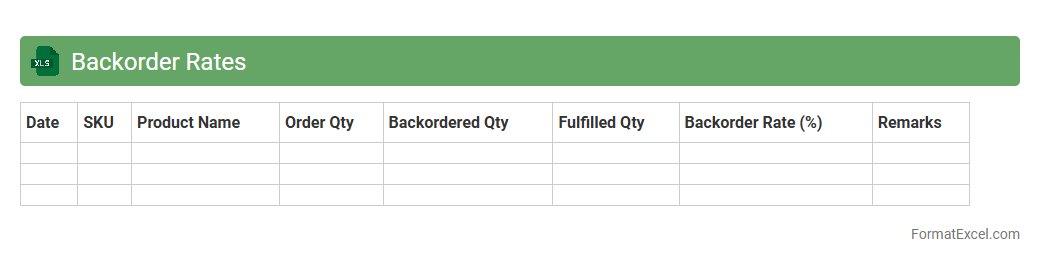
Backorder Rates
A
Backorder Rates Excel document tracks and analyzes inventory shortages and delayed orders, helping businesses identify patterns in product demand and supply chain inefficiencies. This tool enables companies to optimize stock management, reduce lost sales, and improve customer satisfaction by providing clear visibility into backorder trends. By leveraging this data, businesses can make informed decisions on inventory replenishment and streamline order fulfillment processes.
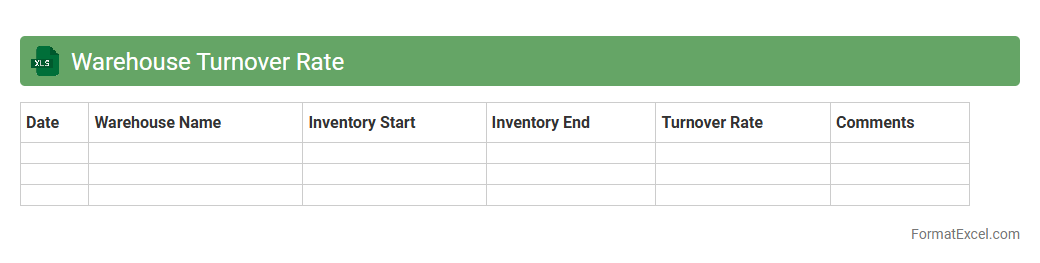
Warehouse Turnover Rate
The
Warehouse Turnover Rate Excel document is a tool designed to calculate and analyze the frequency at which inventory is sold and replaced within a specific period. By tracking this rate, businesses can identify inventory efficiency, optimize stock levels, and reduce holding costs. This insight supports better demand forecasting, improved cash flow management, and enhanced overall warehouse performance.
Seasonal Inventory Turnover
The
Seasonal Inventory Turnover Excel document is a specialized tool designed to track and analyze the rate at which seasonal products are sold and replaced within specific time frames. This document helps businesses identify trends, optimize stock levels, and reduce holding costs by accurately forecasting inventory needs based on seasonal demand patterns. Using this tool enhances decision-making processes, improves cash flow, and minimizes the risk of overstocking or stockouts during peak seasons.
Obsolete Inventory Report
The
Obsolete Inventory Report Excel document identifies stock items that are no longer in demand or have not been used over a specific period, helping businesses manage excess or dead inventory. It provides detailed data on product quantities, purchase dates, and value, enabling accurate assessment and informed decision-making for inventory reduction strategies. This report supports cost savings by facilitating the clearance or write-off of obsolete stock, improving warehouse efficiency and cash flow management.
Inventory Accuracy Rate
The
Inventory Accuracy Rate Excel document measures the precision of recorded stock levels against actual physical inventory, helping businesses identify discrepancies. This tool provides detailed insights into inventory management efficiency, reducing stockouts, overstocking, and operational costs. By enabling real-time tracking and analysis, it supports informed decision-making and improves overall supply chain performance.
Introduction to Inventory Turnover
Inventory turnover measures how often a company sells and replaces its stock within a period. It indicates inventory management efficiency and profitability. Understanding this ratio helps businesses optimize stock levels and reduce holding costs.
Importance of Inventory Turnover Analysis
Analyzing inventory turnover helps identify slow-moving or obsolete stock. It improves cash flow by ensuring inventory meets demand without excess. This analysis supports better purchasing and sales strategies for business growth.
Key Metrics for Inventory Turnover
Key metrics include cost of goods sold (COGS) and average inventory value. The turnover ratio is calculated by dividing COGS by average inventory. Tracking these metrics reveals inventory efficiency and sales performance.
Elements of an Effective Excel Format
An effective Excel format features clear headers, accurate data columns, and automated formulas. It ensures streamlined input and instant calculation of inventory turnover. Visual aids like charts enhance data interpretation and decision-making.
Step-by-Step Guide to Creating Inventory Turnover Template
Start by listing inventory items, COGS, and inventory values in columns. Use formulas to calculate average inventory and turnover ratio automatically. Format the sheet for easy data entry and summary visualization.
Essential Columns for Inventory Turnover Sheets
Crucial columns include Item Description, Beginning Inventory, Ending Inventory, COGS, Average Inventory, and Turnover Ratio. Each column tracks specific data needed for accurate turnover calculation. Proper column setup ensures reliable analysis.
Using Excel Formulas for Turnover Calculation
Employ formulas like =SUM() and division for calculating average inventory and turnover ratio (COGS/Average Inventory). Conditional formatting can highlight low turnover items. These formulas automate complex calculations, saving time.
Sample Inventory Turnover Excel Template
A sample template includes pre-filled headers and formulas for quick use. It allows users to input inventory data and instantly see turnover ratios. Using templates standardizes reporting and enhances operational insight.
Tips for Maintaining Accurate Inventory Records
Regularly update stock counts and sales data to maintain accuracy. Use Excel validation tools to reduce errors in data entry. Accurate records lead to precise turnover calculations and better inventory decisions.
Frequently Asked Questions on Inventory Turnover in Excel
Common questions address formula usage, data organization, and template customization. Answering FAQs helps users efficiently manage and interpret their inventory turnover sheets. Continuous learning ensures optimal inventory control.