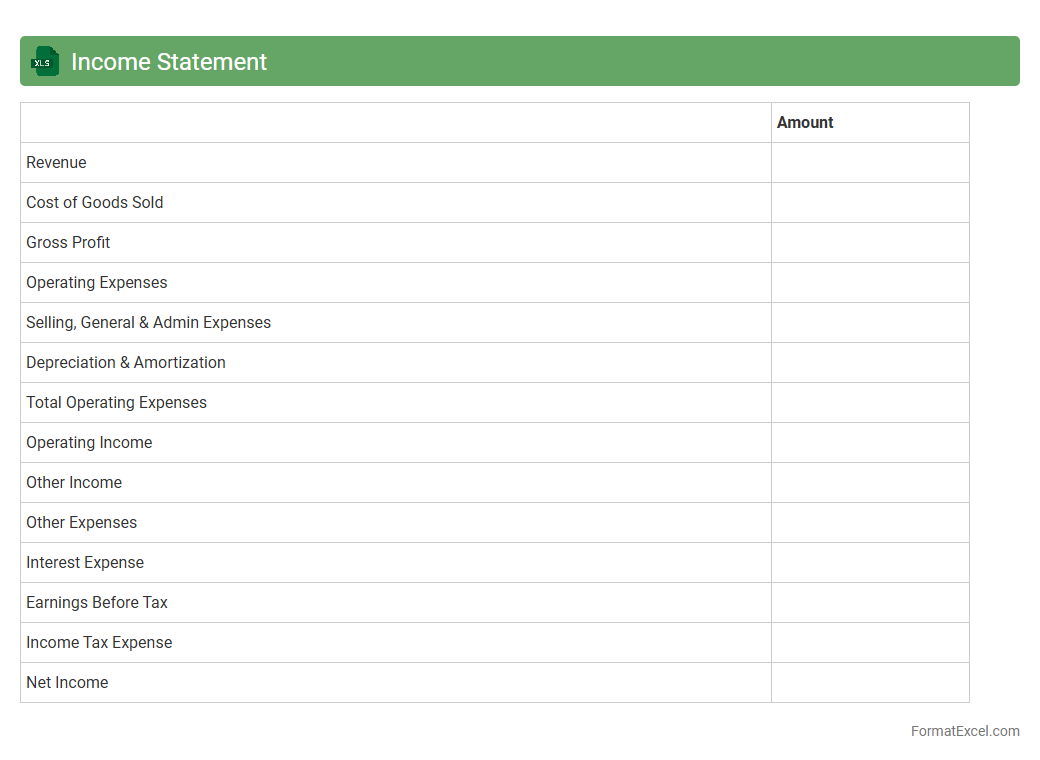
Income Statement
An
Income Statement Excel document is a financial tool that organizes and displays a company's revenues, expenses, and profits over a specific period. It helps businesses analyze financial performance, track profitability, and make informed budgeting decisions. By using Excel's formulas and functions, users can easily update data, generate precise reports, and visualize cash flow trends for strategic planning.
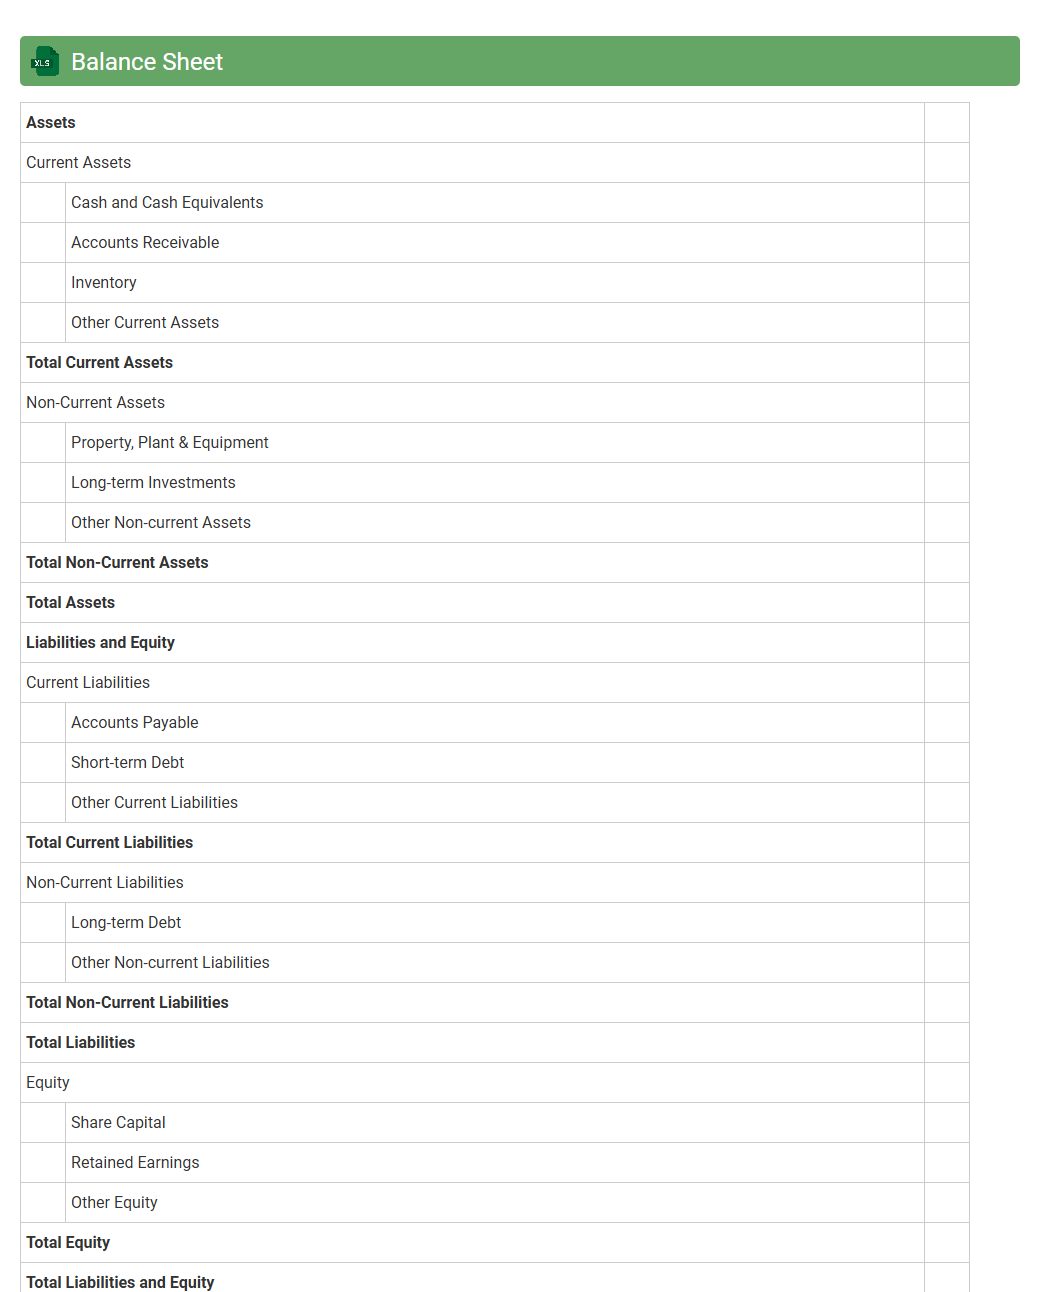
Balance Sheet
A
Balance Sheet Excel document is a digital spreadsheet designed to organize and display a company's financial position by listing assets, liabilities, and equity at a specific point in time. It is useful for accurately tracking financial health, enabling quick analysis of liquidity and solvency, and facilitating informed decision-making by management, investors, and creditors. The customizable nature of Excel allows users to update figures, perform calculations automatically, and generate reports efficiently.
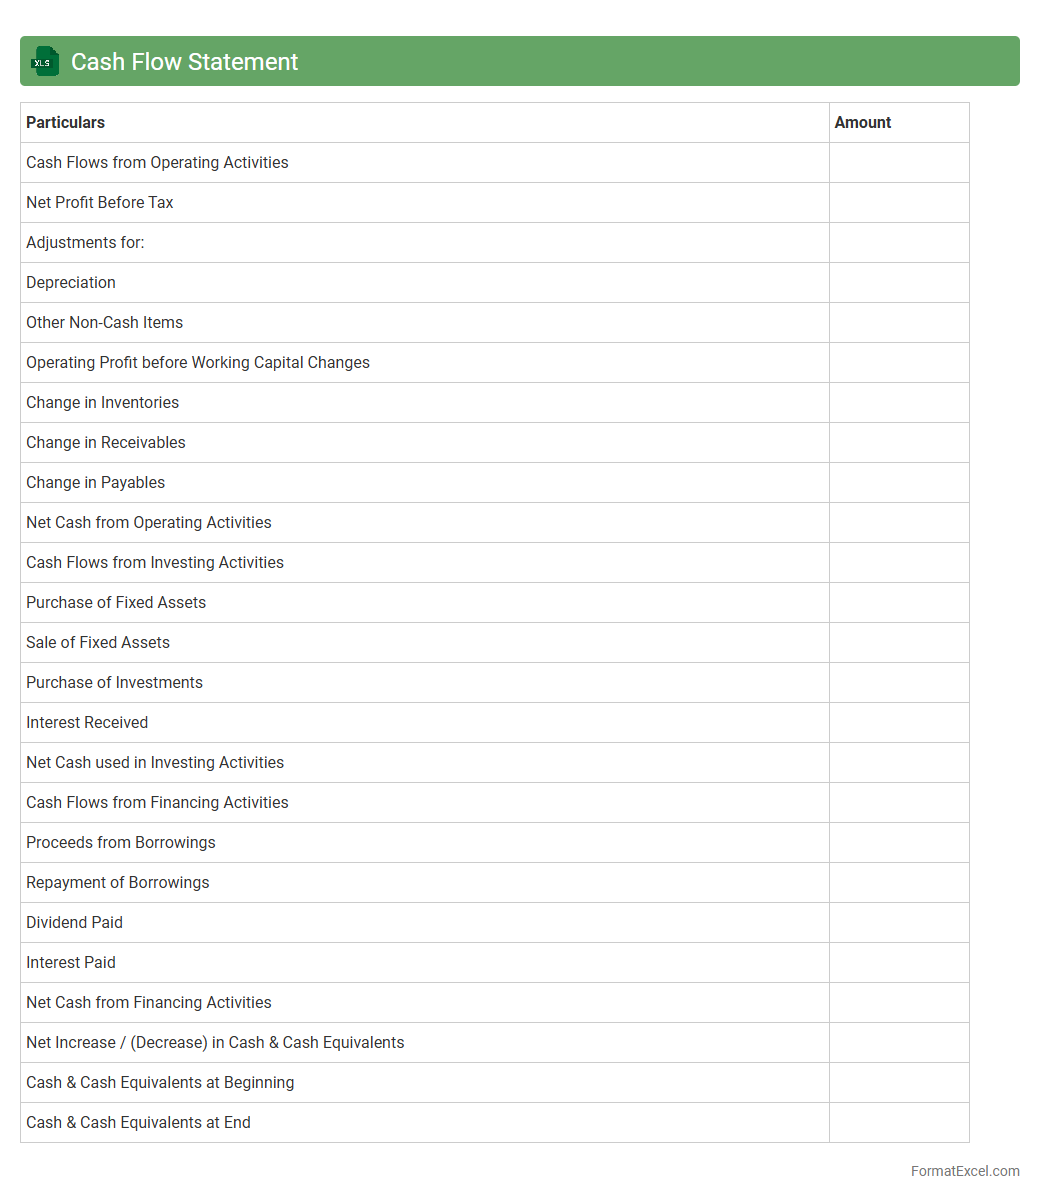
Cash Flow Statement
A
Cash Flow Statement Excel document is a financial tool that tracks the inflow and outflow of cash within a business over a specific period. It helps users analyze liquidity by categorizing cash movements into operating, investing, and financing activities. This document is essential for making informed decisions on budgeting, forecasting, and maintaining healthy financial management.
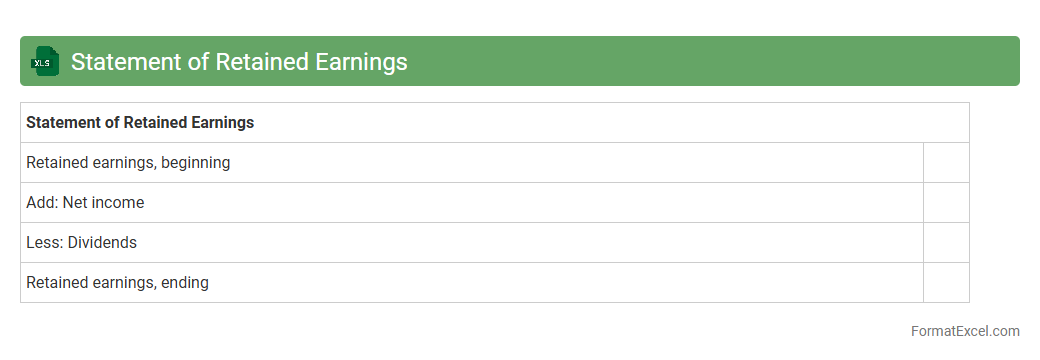
Statement of Retained Earnings
A
Statement of Retained Earnings Excel document is a financial report that outlines the changes in retained earnings over a specific period, including net income, dividends, and adjustments. It is useful for tracking how profits are reinvested in the company, providing insights into financial health and sustainability. This document helps investors and management make informed decisions by clearly showing the accumulation of earnings available for future growth or debt repayment.
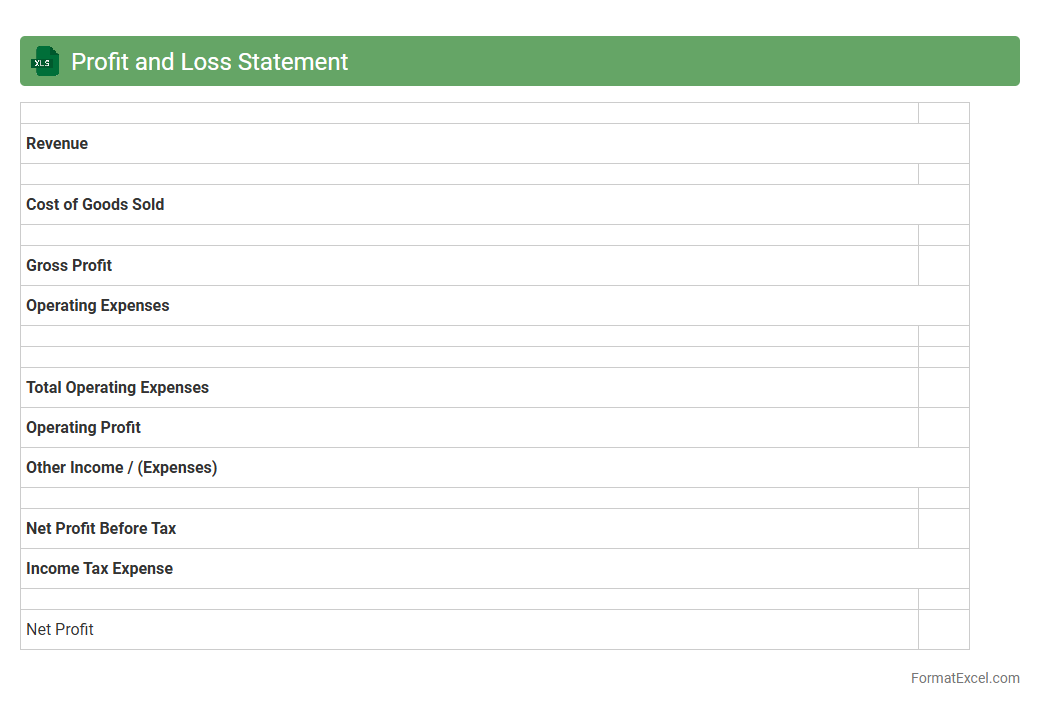
Profit and Loss Statement
A
Profit and Loss Statement Excel document is a financial spreadsheet that tracks revenues, expenses, and net profit over a specific period, enabling accurate business performance analysis. It helps identify cost-saving opportunities, forecast future earnings, and make informed budgeting decisions. By organizing financial data systematically, it simplifies complex accounting tasks and supports strategic planning.
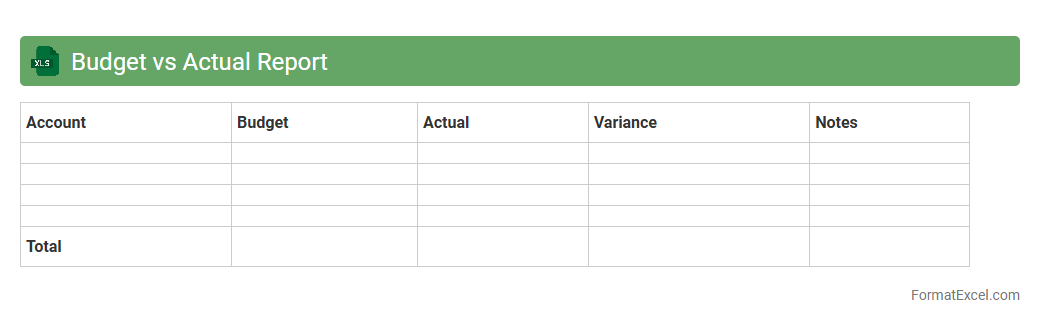
Budget vs Actual Report
A
Budget vs Actual Report Excel document compares planned financial expenditures and revenues against the real figures over a specific period. It helps businesses track performance, identify variances, and make informed decisions to control costs and optimize resources. This analysis improves budgeting accuracy and supports strategic financial planning.
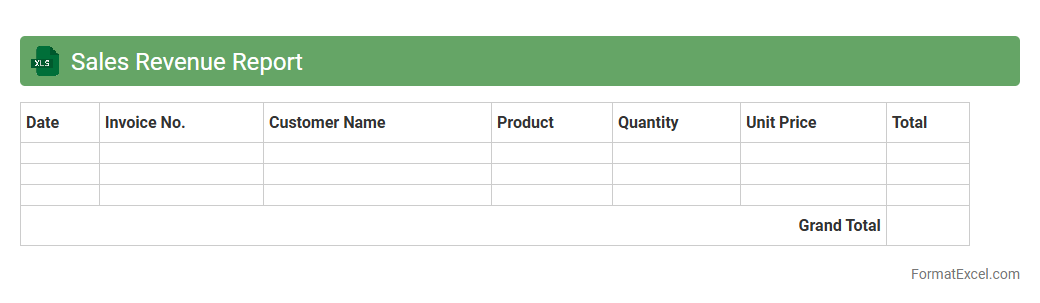
Sales Revenue Report
A
Sales Revenue Report Excel document is a detailed spreadsheet that tracks and analyzes income generated from sales over a specific period. It helps businesses monitor revenue trends, identify high-performing products or services, and make informed financial decisions. By organizing sales data efficiently, it enables accurate forecasting and strategic planning to drive growth and profitability.
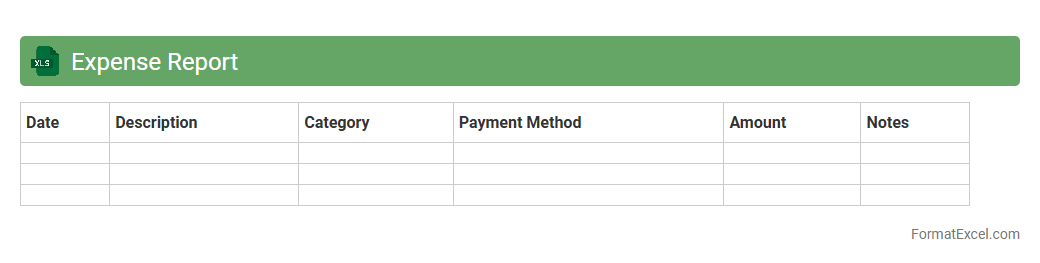
Expense Report
An
Expense Report Excel document is a structured spreadsheet used to record, categorize, and track business or personal expenditures with precision. It helps users monitor spending patterns, ensures accurate reimbursement processes, and facilitates budget management by providing clear visibility into financial outflows. This tool enhances financial accountability and simplifies expense analysis through customizable templates and automated calculations.
Accounts Receivable Report
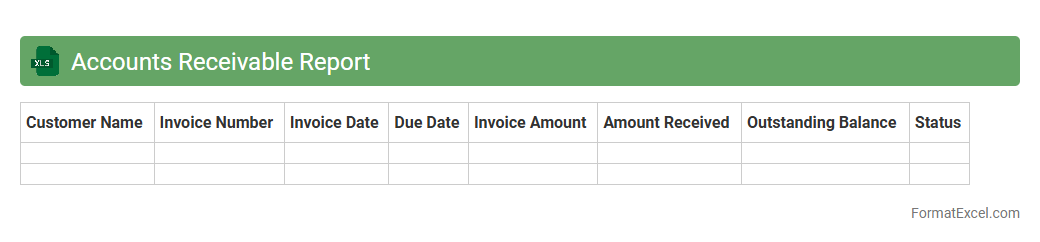
An
Accounts Receivable Report Excel document tracks outstanding customer invoices and payments, enabling businesses to monitor cash flow effectively. It details amounts owed, invoice dates, payment terms, and aging information, providing clear insights into receivables management. This report helps identify overdue accounts, optimize credit policies, and improve financial planning accuracy.
Accounts Payable Report
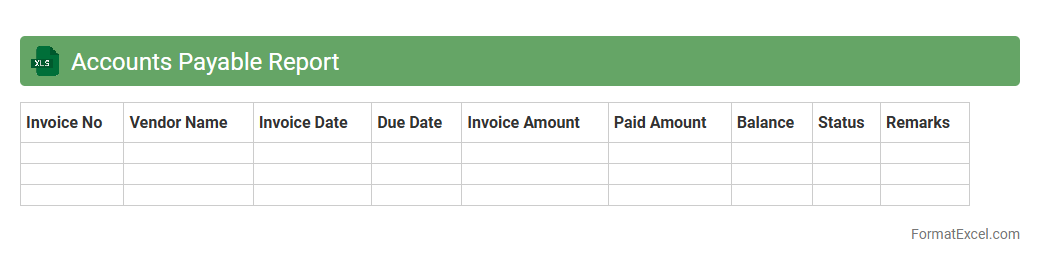
An
Accounts Payable Report Excel document is a detailed financial spreadsheet that tracks outstanding payments a company owes to suppliers and vendors. It helps businesses monitor due dates, manage cash flow effectively, and avoid late payment penalties by providing clear insights into all unpaid invoices. Utilizing this report improves financial accuracy, supports budgeting decisions, and enhances vendor relationship management.
Tax Report
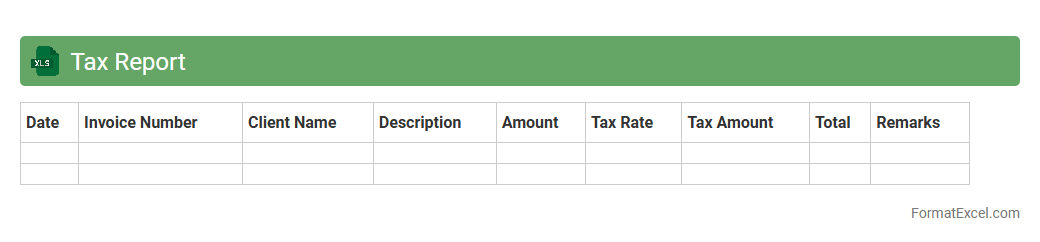
A
Tax Report Excel document is a spreadsheet designed to organize, calculate, and summarize tax-related data efficiently. It helps track income, expenses, deductions, and tax liabilities, ensuring accurate and timely tax filing. Utilizing this report minimizes errors, saves time, and provides clear insights for financial planning and compliance.
Trial Balance
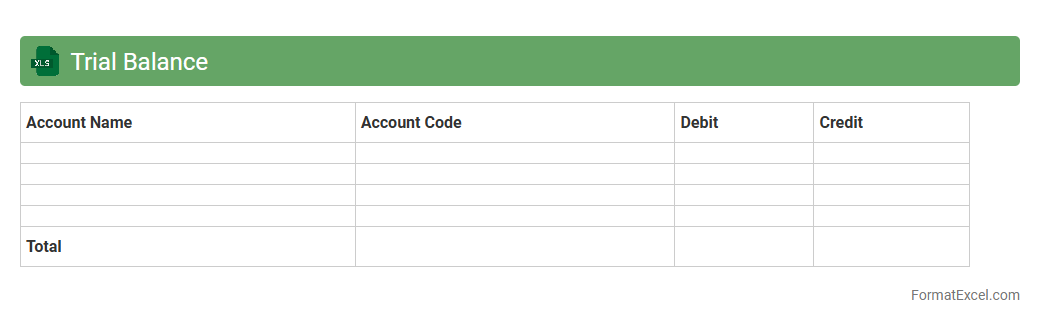
A
Trial Balance Excel document is a financial report that compiles all ledger account balances into debit and credit columns, ensuring the accounting entries are accurately recorded and balanced. It helps businesses quickly identify discrepancies and errors in their accounting data before preparing financial statements. Using Excel for trial balances enables efficient data organization, easy updates, and automated calculations for improved accuracy and time savings.
Payroll Summary Report
A
Payroll Summary Report Excel document consolidates employee compensation data, including salaries, wages, bonuses, deductions, and taxes within a specific pay period. It provides a clear overview for payroll processing, compliance audits, and financial planning by summarizing essential payroll metrics in an organized format. This report enhances accuracy, streamlines payroll management, and supports budgeting decisions in business operations.
Depreciation Schedule
A
Depreciation Schedule Excel document is a tool that systematically tracks the reduction in value of tangible assets over time. It helps businesses accurately calculate asset depreciation for accounting and tax purposes, ensuring compliance with financial reporting standards. Using this schedule improves budgeting, asset management, and decision-making by providing clear visibility into asset lifespan and expense allocation.
Asset Register
An
Asset Register Excel document is a detailed spreadsheet used to systematically record and track an organization's physical and intangible assets. It consolidates essential information such as asset description, purchase date, depreciation, location, and current value, enabling efficient asset management and accurate financial reporting. Utilizing this tool helps businesses optimize asset utilization, ensure compliance with accounting standards, and plan for maintenance or replacement strategies effectively.
Equity Statement
An
Equity Statement Excel document is a financial tool that tracks changes in owners' equity over a specific period, detailing investments, withdrawals, net income, and other equity-related transactions. It allows businesses and investors to monitor the growth or decline of equity, ensuring transparency and aiding in accurate financial analysis. Using this document helps in making informed decisions regarding financial planning, investment strategies, and assessing the overall health of a company.
Bank Reconciliation Statement
A
Bank Reconciliation Statement Excel document is a spreadsheet tool used to compare and match the company's accounting records with the bank statement to identify any discrepancies. It helps in detecting errors, fraud, or unauthorized transactions by ensuring that all entries are accurately recorded and reconciled. This facilitates accurate financial reporting, improved cash flow management, and reliable accounting records for decision-making.
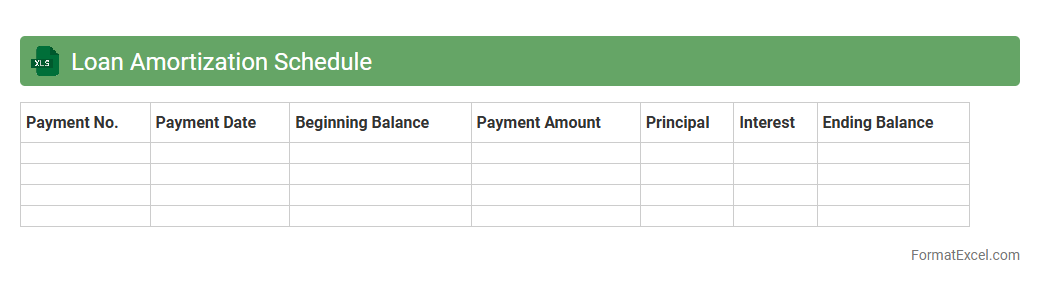
Loan Amortization Schedule
A Loan Amortization Schedule Excel document is a detailed table that breaks down each loan payment into principal and interest over the loan term, allowing borrowers to see how their debt decreases over time. This tool helps users track payment dates, remaining balances, and interest expenses, making it easier to plan finances and manage debt effectively. Using an
amortization schedule in Excel enhances transparency and financial control by providing a clear, customizable visual of loan repayment progress.
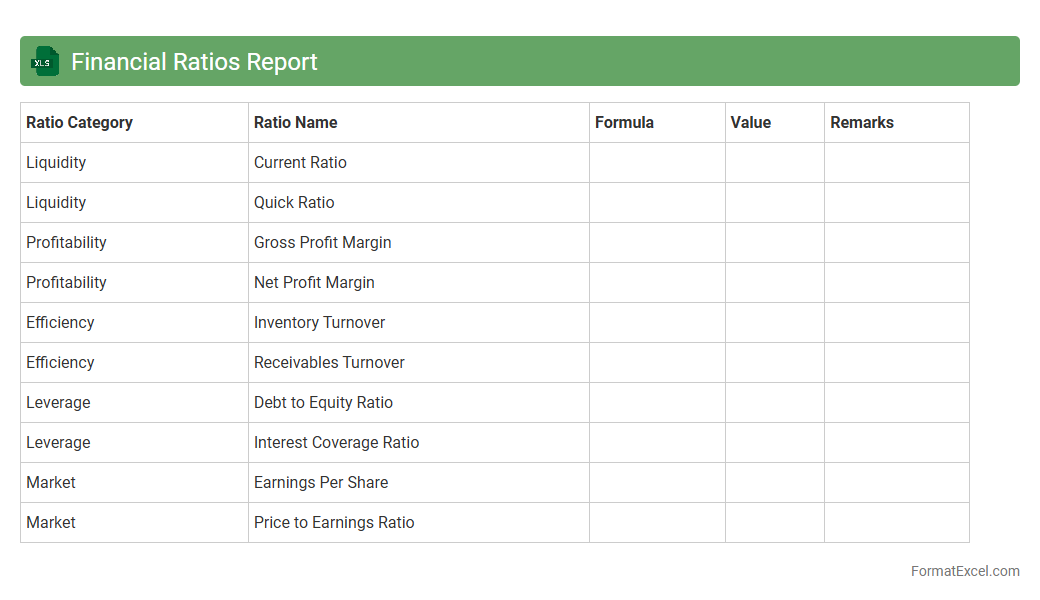
Financial Ratios Report
A
Financial Ratios Report Excel document presents key financial metrics such as liquidity, profitability, and solvency ratios derived from a company's financial statements. It enables businesses and investors to quickly assess financial health, identify trends, and make informed decisions. By organizing data in a structured and customizable format, it enhances accuracy and efficiency in financial analysis.
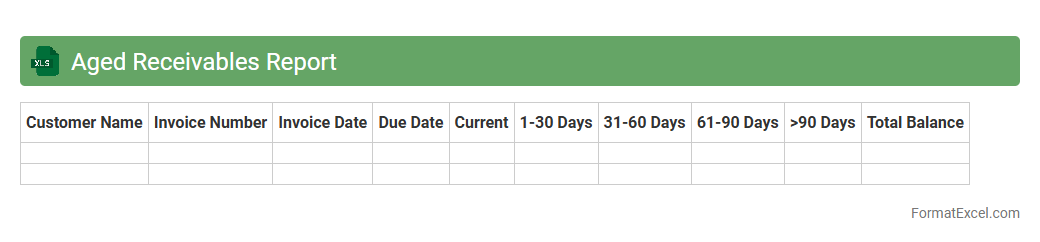
Aged Receivables Report
An
Aged Receivables Report Excel document categorizes outstanding customer invoices based on the length of time they have been unpaid, typically segmented into 30, 60, 90, and over 90 days. This report is essential for monitoring accounts receivable, identifying overdue payments, and managing cash flow effectively. Businesses use it to prioritize collection efforts and reduce the risk of bad debts, improving financial health and operational efficiency.
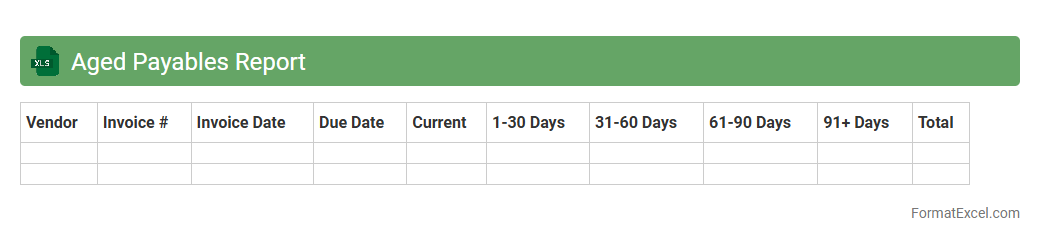
Aged Payables Report
An
Aged Payables Report Excel document categorizes outstanding supplier invoices based on the length of time they have been due, typically segmented into periods like 30, 60, and 90 days. This report is essential for monitoring and managing a company's short-term liabilities, helping to prioritize payments and maintain healthy supplier relationships. It also aids in cash flow forecasting by highlighting overdue accounts and potential financial risks.
General Ledger
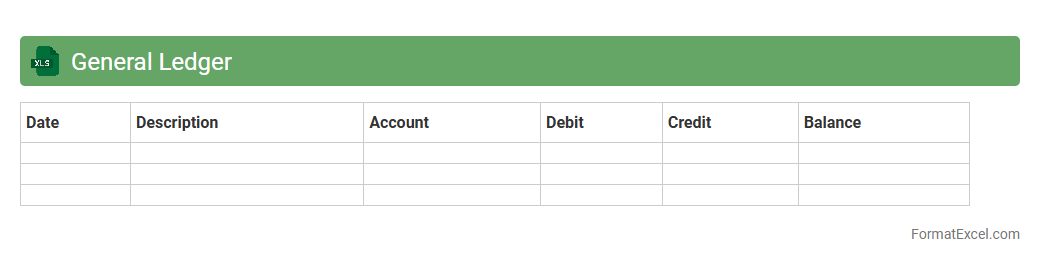
The
General Ledger Excel document is a structured spreadsheet used to record and track all financial transactions of a business, providing a comprehensive view of accounts such as assets, liabilities, income, and expenses. It facilitates accurate accounting by organizing data into categories that simplify reconciliation and reporting processes. This tool is essential for monitoring financial health, preparing financial statements, and ensuring compliance with accounting standards.
Cost of Goods Sold Report
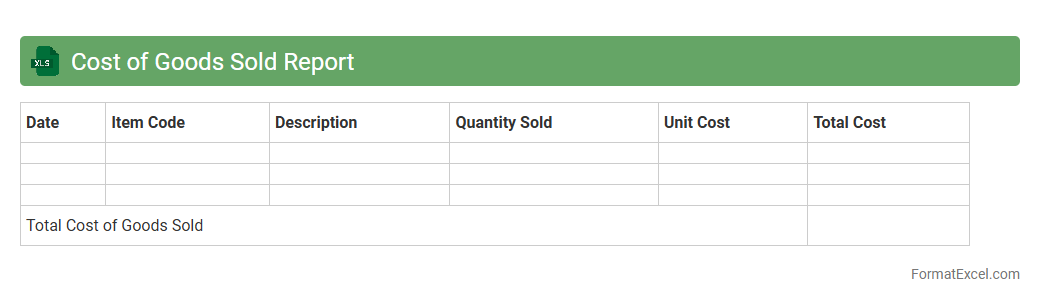
A
Cost of Goods Sold (COGS) Report Excel document is a financial tool that tracks the direct costs associated with producing goods sold by a company, including materials, labor, and manufacturing expenses. It helps businesses analyze production efficiency, manage inventory costs, and determine profit margins accurately. Using this report in Excel allows for easy data manipulation, real-time updates, and clear visualization of cost trends to support informed decision-making.
Variance Analysis Report
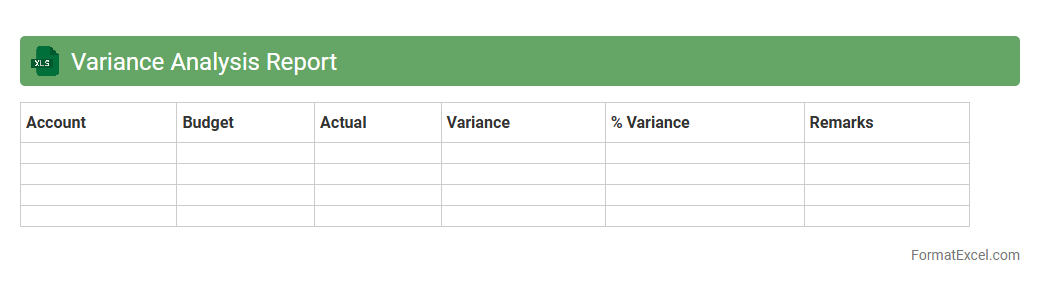
A
Variance Analysis Report Excel document is a financial management tool that compares actual financial performance against budgeted or planned figures, highlighting differences or variances. This report helps businesses identify areas where costs exceeded expectations or where revenue fell short, enabling more informed decision-making and improved budget control. By systematically analyzing variances, organizations can implement corrective actions, optimize resource allocation, and enhance overall financial performance.
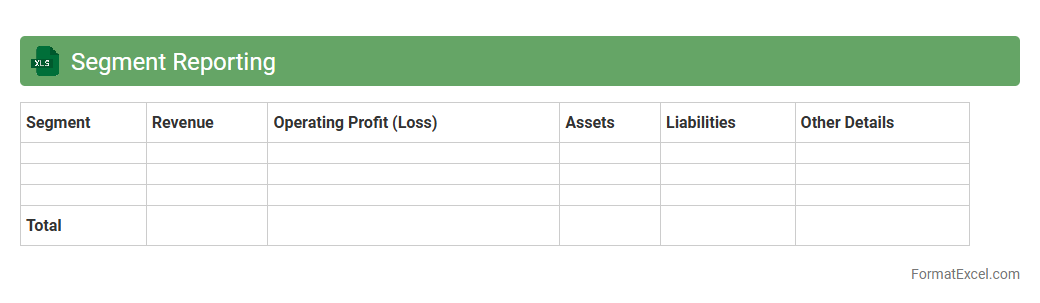
Segment Reporting
Segment Reporting excel document is a structured tool that organizes financial and operational data by distinct business units or market segments. It enables users to analyze performance metrics, revenue streams, and cost drivers within each segment, facilitating targeted decision-making and resource allocation. Using a
Segment Reporting excel document enhances transparency and aids stakeholders in evaluating the profitability and growth opportunities of individual segments.
Introduction to Financial Report Formats in Excel
Financial reports in Excel provide a structured way to present financial data for analysis and decision-making. Excel's flexibility allows users to customize reports to fit various business needs. Understanding the format is essential for clear and effective communication of financial results.
Key Components of an Excel Financial Report
Typical components include the income statement, balance sheet, and cash flow statement, each serving a distinct financial purpose. Financial reports also contain headings, footers, and summary sections for clarity. Including accurate financial data is crucial for reliability.
Essential Excel Functions for Financial Reporting
Functions like SUM, IF, VLOOKUP, and PIVOT TABLES are vital for summarizing and analyzing financial data. These functions enhance the report's accuracy and efficiency. Mastery of these tools allows for dynamic and interactive reporting.
Setting Up Your Financial Report Layout in Excel
A clear layout organizes data logically with headings, labels, and aligned columns. Use freeze panes and cell merging to maintain readability. Creating a user-friendly layout ensures ease of interpretation.
Common Templates for Excel Financial Reports
Pre-designed templates save time and standardize reporting across teams. Templates often include predefined formulas and formatting for quick setup. Utilizing a trusted template streamlines the reporting process.
Step-by-Step Guide to Creating a Financial Report in Excel
Begin with importing or entering financial data, followed by structuring the worksheet for clarity. Apply formulas and formatting, then review for accuracy. A systematic approach guarantees a comprehensive and accurate financial report.
Best Practices for Formatting and Presentation
Use consistent fonts, colors, and borders to enhance readability and professionalism. Highlight key figures with bold or color to draw attention. Proper formatting improves the report's impact and ease of use.
Automating Financial Calculations in Excel
Employ macros and advanced formulas to reduce manual input and increase consistency. Automation minimizes errors and saves time during report updates. Leveraging automation boosts efficiency and accuracy.
Tips for Data Integrity and Error Checking
Use data validation, error-checking tools, and cross-references to ensure the integrity of financial data. Regularly audit formulas and input sources for accuracy. Maintaining data integrity is vital for credible financial reporting.
Exporting and Sharing Excel Financial Reports
Export reports as PDF for secure sharing or retain Excel format for further edits. Ensure sensitive data is protected via passwords or access restrictions. Effective sharing practices guarantee stakeholder accessibility and confidentiality.